

Manuscript accepted on :
Published online on: 18-12-2015
The Present-Day Geoecologic Situation of Kenghir River Basin Geosystem
Zhanar Ozgeldinova, Kulchikhan Janaleyeva, Zaure Auyezova, Zhandos Mukayev and Nurgul Ramazanova
L. N. Gumilyov Eurasian national university Kazakhstan, 010008, Astana, Qazhymugan Street, 13
DOI : http://dx.doi.org/10.13005/bbra/1987

ABSTRACT: There were revised peculiarities of Kenghir river basin development process. The geosystems’ situation was evaluated and the problem of the river basin from geologic point of view was brought to light. There were effected geosystems’ present-day characteristics on the background key places and the places, situated in highly-technogenic-polluted areas. And there was established increasing of a concentrations of such chemical elements as Cl-, SO42, NO3- in water and Pb, Cu in the soil progressively as forthcoming to the source of emissions. A map of Kenghir river basin geosystems was produced.
KEYWORDS: river basin; geosystem; anthropogenic load; technogenesis
Download this article as:| Copy the following to cite this article: Ozgeldinova Z, Janaleyeva K, Auyezova Z, Mukayev Z, Ramazanova N. The Present-Day Geoecologic Situation of Kenghir River Basin Geosystem. Biosci Biotechnol Res Asia 2015;12(3) |
| Copy the following to cite this URL: Ozgeldinova Z, Janaleyeva K, Auyezova Z, Mukayev Z, Ramazanova N. The Present-Day Geoecologic Situation of Kenghir River Basin Geosystem. Biosci Biotechnol Res Asia 2015;12(3). Available from: https://www.biotech-asia.org/?p=2437 |
Introduction
Natural factors influencing the river basins evolution processes (climate, morphometry, a pattern of vegetation in the basin etc.) in natural conditions aren’t so dynamic as anthropogenic ones (industry, agriculture, urban development in river basins, changes of hydrographic system, etc.). As far as problems of rational use and protection of natural waters increase year by year, the whole complex of influence on basins’ geosystems, through which fundamental, sometimes inconvertible changes of waters occur should be revised. An idea of geosystem-basin approach is popular in the modern physical geography. It was developed by the works of V.N. Solntsev (1981), V.S. Mikheyev (1987), V.B. Sochav (1978), K.M. Djanaleyeba (2008), etc. Geosystem is – the unity of process and result, genesis and modern organization, functioning and structure, and the condition for each period of time (Chorley and Kennedy, 1971; Orme, 1980; Rumney, 1970). Basin approach in study of geosystems reflects the present-day condition of environment and its dynamics as well as processes of evolution in respect to time. The increase of the influence of technogenic factors on environment results a complex of counter reactions of geosystems, as well as in processes of their selfregulation. Geosystem approach to the study of differentiation of liquid in overland flow basins presupposes a interrelation and interdependence of liquid migration in correlated geosystems. The Sections of one micro geologic system divide into different sides of interstream areas, which are usually appear to be a special kind of geologic-chemic screen, serving as impenetrability for water, most of air and mechanic migrants.
The review of main publications of use of basin approach in geographic cycle sciences was made by L.M. Korytnyi (Korytnyi, 1991). Noticing the advantages of this approach he considers a wide entrenchment of basin conception to the practice as a currently central purpose. The system studies of natural-anthropogenic landscapes of river basins appear to represent a special interest. F.N. Milkov considers a river basin as a paragenetic system, consisting of two subsystems – valley-river and watershed , natural components of which are interrelated with the mutuality of origin – establishment of the river, forming of its valley and basin. In this way we recognize a paragenetic system as a riverbed and a territory attached to it, with which the riverbed is charged by surface- and underground-discharge, in result of which they develop a complicated natural complex
The main specialization of population of Kenghir river basin is the nonferrous-metal industry, provided by Ore mining and processing industrial complex, cooper-smelting factory, screening plants, casting and mechanical plant, mines and open-type mining industries. Such industries are «Zhezkazgantsvetmet», «Kazakhmys Co.» LLP and «Zhezkazganredmet» RSE. The waste waters of this industries drain into Sarysu river and pollute it.
Complex study of geosystems of the basin is conditioned by an increasing utility influence. Physic-Geographic field studies we carried out in 2012-2013 y. give us the possibility to evaluate the geo-ecologic situation of Kenghir river basin’s geologic situation.
The aim of the present work is – to evaluate results of anthropogenetic influence on the geosystem of Kenghir river basin.
Study Methods
According to the synthesis of the cartographic data and standard apparatus Arc Map 10.1 there was produced a map of geosystems of Kenghir river basin with 1:500000 size ratio. (fig. 1, table 1).
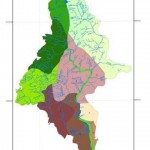 |
Figure 1: Map of Kengir river basin geosystem |
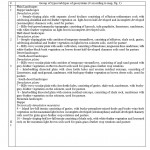 |
Table 1: Geosystems of Kenghir river basin |
We studied the spati-temporal inequality of geosystems as exemplified by background key places and the places, situated in highly anthropogenetic influence (fig. 2, tab. 2).
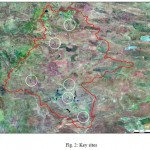 |
Figure 2: Key sites |
Table 2: Key sites of physical and geographic exploration in Kengir river basin
| # on map (fig. 2) |
Key sites
|
Coordinates | Location |
Date, time
|
t° of water |
| 1 | Yeginskii | 49°03’22” N,
67°45’03” E |
5 km southward, the Sary-Kengir river right bank | 21° | 16.07.2013
11:10 |
| 2 | Boztumykskii | 48°45’31” N,
67°30’49” E |
3 km eastward from the village, the Karakengir river left bank | 22° | 11.07.2013
13:35 |
| 3 | Zhezdinskii | 48°3’53” N,
67°2’29” E |
0,2 km westward from the township, the Zhezda river right bank | 18° | 02.07.2013
15:00 |
| 4 | Satpaevskii | 47°53’3” N,
67°34’37” E |
12 km southward from the city, the Karakengir river left bank | 19° | 03.07.2013
12:15 |
| 5 | Zhezkaganskii | 47°48’12” N,
67°43’13” E |
0,2 km eastward from the Kenghirskii water basin | 22° | 06.07.2013
16:05 |
| 6 | Surgitinskii | 47°27’32” N,
67°54’10” E |
0,5 km westward from the village, the Karakengir river left bank | 19° | 03.07.2013.
15:20 |
The bulk content of chemical elements in water samples was estimated in certified laboratory of “KAZGIDROMET” of Astana city (tab. 3,6,8). The findings were elaborated by methods of analysis of variance sensu N.A. Plokhinskiy (Plokhinskii, 1970) with the use of Microsoft Excel software. During the elaboration of findings the following statistical values: ± – average ± error in mean; lim – range of limits; p – margin of limits, σ – standard error; CV – variation coefficient, %; r – correlation coefficient, n – number of samples.
Results and Discussion
The Kenghir (Qara-Kenghir) river flows from southern and South-East hillsides of Ulytau mountains nearby the Baraqkol lake, and joins a Sarysu river 384 km far from its creek on North-West edge of Hollow Steppe (Betpaq-Dala). Length of the river – 295 km, catchment basin – 480 m, average-weighted slope – 1,07 о/оо. The main feeders of Kenghir are Sary-Kenghir, Zhylandy, Zhezdy rivers as well as 115 more feeders of total length of 840km. The feeding of the basin rivers is snowy, containing phreatic. Total dissolved soiling of river waters usually increases from North to South, from Spring to Summer and from Autumn to Winter. In a Half-desert in the spring time waters are of Calcium Bicarbonate type (fresh waters), in the Summer times they turn into Sodium Chloride (subsaline and even bitter-saline). The relief of Northern and North-East parts of basin is undulating, the heght of hills reaches 200m. In middle and lower courses it is a hummocky topography, turning into the plain. In the lower cource the basin is dissected by ravine plantations. At the upper course, the soils are light-brown solonetz, loamyand at the lower course they are brown. The vegetation consists of grain-feather, feather and salino-feather complexes (Temereeva, 2002; Kalmenova, 2000; Galperin and Moldahmetov, 2003). 60 km far from the river creek there is situated a Kenghir impoundment, which is the main source of service, drinking and technical water supply of Zhezkazgan city and its industrial complex. A negative influence on it is effected by Zhezkazgan TPP, using the impoundment as a cooling reservoir, by waste waters of Zheskazgan ore-dressing plants № 1,2. The impoundment is also fed by waters of Kara-Kenghir River, which is polluted by cattle farms’ and agricultural objects’ waste.
 |
Table 3: Concentration of main ions and minerals in Kengir river basin |
Studies attributed to the basin we carried out let us establish some hydrochemical peculiarities of its water composition (tab. 3,6), on the key areas situated nearby the industrial enterprises (Satpaevskii, Zhezkaganskii and Surgitinskii). The water is characterized by huge mineralization changes, with high concentration of Cl–, SO42- (tab. 3), overshooting the MAC 2 times (Sanitary rules.., 2012; General list of limiting permissible concentration (LPC), 1990). Chloride and Sulphate which have a big concentrations in waste waters, are classified among very fluid elements (Perelman, 1972). The average concentration of Sulphate-Ion in studied waters run at 404.69±52.93 mg/dm3 under variation coefficient running at 32.04 % and range of limits of 246-639 mg/dm3, the average concentration of Chloride-Ion in waters of the basin run at 169.61±73.02 under the rises and falls of 90.45-534.2 mg/dm3, variation coefficient was at 105.45% (tab. 4). The increase of concentration of such elements in Kenghir river basin is associated also with underground waters, coming out from border cracks of water gap and with enriched salt brine components (Temereeva, 2002).
Findings referred to NO3– concentration in the river basin demonstrate increase (2-3 times) down the stream (таб. 2), which is associated with agricultural influence of the nearby villages (Kenghir, Malshybay, Talap villages, etc.) (Sanitary rules.., 2012; General list of limiting permissible concentration (LPC), 1990). Gross output volume of the agriculture every year increases approximately by 25-30% (www.agro.jezkazgan.gov.kz). Average Nitrate concentration – 33.67±7.03 mg/dm3, variation coefficient – 72.33% (tab. 3, 4).
Table 4: Variation and statistical indicators of macrocomponental composition of water in Kengir river basin
| Parameters | ± | lim | р | σ | СV, % |
| mg/dm3 | |||||
| рН | 4.9±0.28 | 4.1-5.9 | 1.8 | 0.68 | 13.96 |
| Total hardness | 5.28±0.78 | 3-8 | 5 | 1.90 | 35.96 |
| НСО3– | 188.6±36.15 | 50.6-279 | 228.4 | 88.54 | 46.95 |
| СО2 | 6.13±3.92 | 0.1-23.5 | 23.4 | 9.61 | 156.73 |
| Cl– | 169.61±73.02 | 90.45-534.2 | 443.75 | 178.86 | 105.45 |
| SO42- | 404.69±52.93 | 246-639 | 393 | 129.65 | 32.04 |
| NO2– | 1.42±0.30 | 0.56-2.4 | 1.84 | 0.73 | 51.67 |
| NO3– | 26.17±5.59 | 17-53 | 36 | 13.69 | 52.31 |
| NH4+ | 0.60±0.17 | 0.07-1.1 | 1.03 | 0.42 | 70.13 |
| Σ viscosity | 1.19±0.32 | 0.01-2.31 | 2.3 | 0.79 | 66.96 |
| Suspended substances | 21.93±5.88 | 11-48.4 | 37.4 | 14.39 | 65.63 |
| Total phosphorus | 0.06±0.01 | 0.03-0.10 | 0.07 | 0.03 | 42.24 |
The explored waters have weak-acid reaction (average рН 4.9). On the whole, variations of рН are small, but we must note that even small changes of hydrogen index change the chemical structure of water significantly (table 4). The general hardness characterizes the basin water as hard (50%), seldom – moderately hard (33%) and soft (17%). The average quantity of the general hardness was 5.28±0.78 mg-экв/дм3. The hardest waters turned to be the waters from the key sites of the low current (Satpaevskii, Surgitinskii – tables 3, 4).
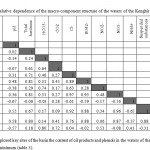 |
Table 5: Correlative dependence of the macro-component structure of the waters of the Kenghir river basin |
In all explored key sites of the basin the content of oil products and phenols in the waters of the basin is close to the absolute minimum (table 3).
According to table 5 it is seen that the chemical parameters of the studied waters of the basin Kenghir are interdependent except for NH4+, which has weak reverse non-authentic relations. The weak correlative dependence of the main components of the water with Cl– и SO42- can be explained by the mosaic pollution of the basin’s water.
Table 6: Concentration of heavy metals in the Kengir river basin
|
Key sites |
Cu2+ | Zn2+ | Pb2+ | Cr6+ | Сd2+ |
| Measuring units | mg/dm3 | mkg/dm3 | |||
| 1. Yeginskii | 0.46 | 1.45 | 0.004 | 0.011 | 0.029 |
| 2. Boztumykskii | 0.49 | 1.56 | 0.004 | 0.01 | 0.023 |
| 3. Zhezdinskii | 0.57 | 1.3 | 0.005 | 0.014 | 0.275 |
| 4. Satpaevskii | 0.32 | 1.54 | 0.0015 | 0.0078 | 0.059 |
| 5. Zhezkaganskii | 0.34 | 1.81 | 0.0028 | 0.0017 | 0.017 |
| 6. Surgitinskii | 0.74 | 2.33 | 0.0036 | 0.0017 | 0.028 |
| Limiting permissible concentration LPCw /LPCwf | 1/0.001 | 5/0.01 | 0.03/- | 0.05/0.02 | 1/5 |
Table 7: Variation and statistical indicators of distribution of heavy metals in the Kengir river basin
| Parameters | X—±x— | lim | р | σ | СV, % |
| Cu2+ mg/dm3 | 0.49±0.06 | 0.32-0.74 | 0.42 | 0.16 | 31.98 |
| Zn2+ mg/dm3 | 1.67±0.15 | 1.3-2.33 | 1.03 | 0.37 | 21.97 |
| Сd2+ mg/dm3 | 0.07±0.04 | 0.02-0.28 | 0.26 | 0.10 | 140.03 |
| Pb2+ mg/dm3 | 0.003±0.0005 | 0.002-0.01 | 0.008 | 0.001 | 34.57 |
| Cr6+ mg/dm3 | 0.008±0.002 | 0.002-0.01 | 0.008 | 0.01 | 65.68 |
The content of Cu2+, Zn2+, Сd2+, Pb2+ и Cr6+ does not exceed the norm of the limiting permissible concentration (ПДК) (table 6) (Sanitary rules.., 2012; General list of limiting permissible concentration (LPC), 1990).
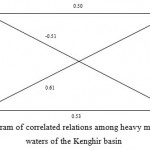 |
Figure 3: Diagram of correlated relations among heavy metals in the waters of the Kenghir basin |
On the correlated matrix (Figure 3) it is seen, that the most force of the correlated relation in the pair of the elements is Pb-Cu (r=0.50). There was marked the reverse relation between Zn and Cd. On the whole, it is necessary to mark that the revealed correlated relations among the micro-components of the water reflect the multi-fact genesis of the chemical structure of the explored waters and to some extent being subject to the techno-gene pollution.
According to the concentration in the waters of the basin the main ions form the following reducing row, mg/dc3: SO42- (404.69) > НСО3– (188.6) > Cl– (169.61) > NO3– (26.17) > Zn2+ (1.67) > NO2– (1.42) > NH4+ (0.60) > Cu2+ (0.49) > Cr6+ (0.008) > Pb2+ (0.003) > Сd2+ (0.00007).
The influence of the soil cover on the flow and other elements of the water balance is realized through the processes of infiltration and evaporation. The specification of the soil cover of the region can be considered a wide spread of semi- hydro morphed and hydro-morphed soils. Their formation is caused by the atmospheric precipitations in the conditions of the divided small-mounded relief and near layers of mineralized soil waters in low day surfaces. Their frequent saline soil and complexity may also be referred to their specification.
The complexity of soils is reflected in frequent changing of soils of various types and sub-types at big distances: at the distance of a few meters it is possible to see light-brown saline soils. In the explored territory there develop saline soils and typical saline soils with the exits of saline clays. They usually exist together with the zone soils. Salt accumulation and correspondingly the weak alkalizing of the soils are conditioned by the sharp continental climate of the basin’s territory. The complexity of the soil cover and a wide spread of saline soils create great difficulties in using lands in farming production.
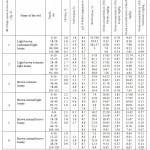 |
Table 8: Content of heavy metals and physical- chemical structure of the explored soils |
The content of heavy metals and physical-chemical structure of the basin of Kenghir are represented in table 8. As the results of the research showed, the average content of humus in horizon A is 2.23%. The content of е СО2 in humus horizons varies within the limits of 0.7-9.6%. The reaction of the soil solution in the upper horizons is weak-alkalizing (рН within the limits of 7.1-8.8%). The average content of the muddy fraction on the whole profile of soils is 24.7%and varies within the limits of 1.7-43.5%.
The average content of the gross of the lead in the basin’s soils is 16.64±1.49 mg/kg (table 8), that is close to its Clark in the earth’s surface equal to 16 mg/kg (A.P. Vinogradov). The highest concentration of the lead (34.22 mg/kg) exceeding LPC (Joint order of the Ministry of Health of RK of 30 January 2004 № 99 and the Ministry of Environmental Protection of RK of 27 January 2004 № 21- order) are discovered in the upper soil horizon of key site # 3 (Zhezdinskii), where brown saline soils are formed on the clays, covered by a small layer (20-25 cm) of the light loam or sandy loam (table 8). Their intense salinity is caused by the character of the vegetation and the existence of the alluvial condensed horizon with high alkalization. The content of the element is reducing on the profile, the intense positive correlation with humus (r=0.80) and the direct weak correlation with carbonates (r=0.15) (table 10) are observed.
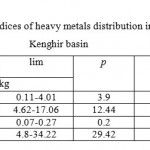 |
Table 9: Variation – statistical indices of heavy metals distribution in the soils of the Kenghir basin |
The gross content of copper in the soils of the basin is changing from 0.11 till 4.01 mg/kg under the average coefficient of variation 86.53% (table. 8). The exceeding of LPC (Joint order of the Ministry of Health of RK of 30 January 2004 № 99 and the Ministry of Environmental Protection of RK of 27 January 2004 № 21- order), the gross content of copper in the upper soil horizon (4.01 mg/kg) is established for brown normal heavy loam soils of the town of Zhezkazgan (key site # 5), where they are formed on forestry loams. The reduction of the content of the element down the profile from 4.01 till 1.56 mg/kg is observed, the interrelation with the reduction of humus is also observed from 2.1 till 0.8%. Humus has much influence on the conduct of copper in the explored soils (r=0.80) and рН (r=0.85) (table 11).
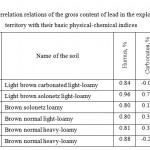 |
Table 10: The correlation relations of the gross content of lead in the explored territory with their basic physical-chemical indices |
The content of Zn and Сd does not exceed the norms of the limited permissible concentration (LPC) (table 7). The average content of zinc in the soils of the basin was 10.92±0.66 mg/kg, with the scope of the limits 4.62-17.06 mg/kg (table. 9). The minimum average content of the gross zinc 7.97 mg/kg is characteristic of the light-brown carbonate soils (key site № 1, Yeginskii), where they are developing on the products of airing of the limestone. The deep penetration of humus (table 8) is connected, probably, with its irrigation. The increase of general alkalization 20-50 cm deep is mostly characteristic of all carbonate soils, that give some researchers the reason to call them carbonate- saline. Water soluble salts 90 cm deep exist in small quantities, but the deeper they are their quantity increases much at the expense of chlorine and, especially, sulphuric-acid salts. The maximum concentration of zinc is characteristic of the brown normal loamy soils (key site # 4, Satpaevskii). Zinc in all soil samples has intense correlative relations with humus, on the average (r=0.85) (table 12).
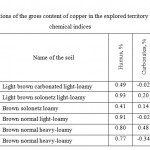 |
Table 11: The correlation relations of the gross content of copper in the explored territory with their basic physical-chemical indices |
The average content of Сd in the soils of the basin was 0.13±0.01 mg/kg, variation coefficient – 36.46% (table 8). The correlative dependence between the content of cadmium and рН of different types of soils in most cases does not exist. The influence of the carbonates on the content of general cadmium is clearly seen in light-brown saline light loamy soils (r=0.60). In the rest types of soils the relation is low and it often has a reverse character (table 13).
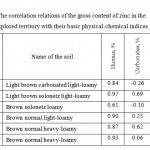 |
Table 12: The correlation relations of the gross content of zinc in the
explored territory with their basic physical-chemical indices |
In the explored soils of the basin there was found the increased content of heavy metals in the upper soil horizon. But in the profile of light-brown saline and brown normal soils we observe saturation of the alluvial horizon with lead (table 8). The reason of such distribution is differentiation of the profile on the content of the muddy fraction and carbonates, more alkalized reaction of the soil solution and saltiness of the given horizon.а. The basic factor in accumulating and distributing of the gross content of heavy metals in the profile of the explored soils is humus.
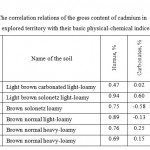 |
Table 13: The correlation relations of the gross content of cadmium in
the explored territory with their basic physical-chemical indices |
According to the quantity of the average concentration of the explored heavy metals (in mg/kg) the soils of the basin Kenghir are distributed in the following reducing order (table 8): Pb (16.64) > Zn (10.92) > Cu (1.27) > (0.13).
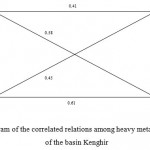 |
Figure 4: Diagram of the correlated relations among heavy metals in the soils of the basin Kenghir |
The research proved that the correlative relations among heavy metals are intense, direct, the most force of the correlated relation is in the pair of the elements Zn- Pb (r=0.79). In the whole it is necessary to state that the revealed correlated relations among heavy metals in the soil reflect the multi- factor genesis of the chemical structure of the explored soils and to some degree being subject to techno-gene pollution.
Conclusions
Geosystems of the basin of the river Kanghir refer to semi-deserted and deserted types of background, which intensifies ecological tension that appears there. Non-sufficient atmospheric moistening, sharp continental climate, drought, intensive evaporation, wide spreading of rocky karsted mountainous rocks with cracks do not further the formation of the sustainable surface flow.
The spectrum of polluting the waters of the basin Kenghir with the products of techno-genesis reflects the different profiles of the industrious production with predominant enterprises of non-ferrous metallurgy. As a result, the monitoring hydro-chemical researches showed that the significant amounts of chemical elements, mostly: Cl–, SO42, NO3– , exceeding LPC by 2-3 times join the industrious household flowing waters of Zhezkazgan industrious region to the river Kenghir.
The study of the distribution of the gross forms of heavy metals on genetic horizons of the soils of the explored region allowed revealing the regularities of their accumulation in the humus-accumulative horizon. In the course of the research it is established that the exceeding LPC of the concentration of the gross lead is characteristic of the clay soils of key-site # 3 (Zhezdinskii), LPC exceeding of the gross content of copper for brown normal soils of key-site # 5 (Zhezkaganskii). For most soils between humus and gross forms of heavy metals there was revealed the authentic high correlative relation. The content and distribution of the gross lead in the soils and the correlative dependence on the muddy fraction, carbonates, рН environment in most cases do not exist or have rather weak relation.
The results of the research create the basis for the working out the approaches and criteria of the evaluation of the geo-ecological influence of the anthropo-genetic activity on the Geosystems of the basin of the river Kenghir. For the first time it is expedient to use the compiled middle-scale (1:500000) map of the Geosystems of the basin Kenghir for the organization and conducting the further monitoring of the environment in the explored region.
References
- Solntsev, V.N., 1981. Systemic setup of landscapes: problems of methodology and theory. Moscow, Mysl. pp: 224.
- Miheyev, V.S., 1987. Background-geographic provision of complex problems. Novosibirsk, Science SО. pp: 95.
- Sochava, V.B., 1978. Introduction into the science of geosystems. Novosibirsk, Nauka SO. pp: 319.
- Dzhanaleyeva, G.M., 2008. Theoretical and methodological problems of Geography. Astana. pp: 225.
- Chorley, R.L. and B.A. Kennedy, 1971. Physical geography. A system approach. London, Prentice-Hall International Inc. рр: 127.
- Orme, A.R., 1980. Professional geographer. The need for physical geography. 2: 17-20.
- Rumney, G.R., 1970. The geosystem. Dynamic integration of land, sea and air. Dubugue. Lava, W.M.C. Brown Company Rublishers. рр: 156.
- Korytnyi, L.M., 1991. Geography and natural resources. Basin approach in geography . Irkutsk, 1. pp: 161-165.
- Plokhinskii, N.A., 1970. Biometry. Moscow, MGU. рр :367.
- Temereeva, F.M., 2002. Nature in Zhezkazgan province. Zhezkazgan. рр: 105.
- Kalmenova U.A., 2000. Physical Geography of Central Kazakhstan. Zhezkazgan. pp: 79.
- Galperin R.I., Moldahmetov M.M., 2003. Materials on Hydro-geography of Kazakhstan. Almaty. рр: 83.
- Sanitary rules “Sanitary- epidemiological requirements to water-sources, places of water-collecting for household purposes, household drinking water supply and places of cultural-household water use and security of water objects”, confirmed by order RK № 104 from 18 January, 2012.
- General list of limiting permissible concentration (LPC) of harmful substances for the water of fishery economical water reservoirs. Moscow. 1990.
- Perelman, A.I., 1972. Geochemistry of elements in the hypergenesis zone. Moscow, Nauka, рр: 288.
- Official site of state Administration ‘Agricultural department and veterinary of the city of Zhezkazgan’, sorted by date 20.05.2014 agro.jezkazgan.gov.kz.
- Joint order of the Ministry of Health of RK of 30 January 2004 № 99 and the Ministry of Environmental Protection of RK of 27 January 2004 № 21- order.

This work is licensed under a Creative Commons Attribution 4.0 International License.


