

Manuscript accepted on :
Published online on: --
Spectroscopic Studies of Natural Dyes from Brosimumrubescens Acer saccharium and Astoniascholaris
J.O. Otutu
Department of Chemistry, Faculty of Science, Delta State University, PMB 1, Abraka, Nigeria.
DOI : http://dx.doi.org/http://dx.doi.org/10.13005/bbra/1045

ABSTRACT:
The extraction and spectroscopic studies of natural dyes from Brosimiumrubescens, Acer saccharium and Astoniascholarisare described. The present study was taken up as an exploratory study to find out if some natural dyes can have properties that could make them qualify to be used as alternative sensitizers for dye-sensitized solar cells. Three natural dyes, extracted from Brosimiumrubescens, Acer saccharium and Astoniascholaris were characterized, using UV-VIS, IR, ‘H.NMR and 13CNMR analyses. The results of the UV-VIS analysis showed that the dye extracts absorbed in the near infrared region. This proved that they could find use as dye-sensitized solar cells as well as organic photoconductors. The effects of DMSO and CDCl3 solvents in the absorption of the dye extracts by the NMR spectrophotometer were also evaluated.
KEYWORDS: Extraction; Natural dyes; Effects of NMR Solvents; Characterization.
| Copy the following to cite this article: Otutu J. O. Spectroscopic Studies of Natural Dyes from Brosimumrubescens Acer saccharium and Astoniascholaris. Biosci Biotech Res Asia 2012;9(2) |
| Copy the following to cite this URL: Otutu J. O. Spectroscopic Studies of Natural Dyes from Brosimumrubescens Acer saccharium and Astoniascholaris. Biosci Biotech Res Asia 2012;9(2). Available from: https://www.biotech-asia.org/?p=10002 |
Introduction
In recent times, natural dyeshave found applications in many areas of human endeavour1. For instance, although, known for a long time for dyeing as well as medicinal properties, the structures and protective properties of natural dyes have been recognized only in the recent past. Many of the plants used for dye extraction are classified as medicinal, and some of these have recently been shown to possess remarkable antimicrobial activity2-3.
In nature, the fruit, flower, bark and leaf of plants show various colours from red to purple and contain various natural dyes which can be extracted by simple procedures. It has been emphasized by many researches to obtain useful dyes as photosensitizers for dye-sensitized solar cell from natural products4. Thus, some natural dyes as sensitizers of dye-sensitized solar cell have been reported5-9. Nanocrystalline dye-sensitized solar cells are promising synthetic nanomachines based on principles similar to the processes in natural photosynthesis. Both use an organic dye to absorb the incoming light and produce excited electrons10.
In this present study, the extraction and characterization of natural dyes from Brosimium, rubescens, Acer saccharium and Astoniascholaris using spectroscopic methods are reported. Also, the effects of DMSO and CDCl3 solvents in the absorption of the dye extracts by the NMR spectrometer were evaluated.
Experimental
Material and Methods
Extraction of Plant dyes and Purification
The barks of the three plant materials were collected, dried, weighed and ground into powdered form respectively. They were treated with ethanol and acetone respectively according to a standard procedure11. Thus the ratio of mass of plant material: volume of solvent was set at 1:50 which means that 1.0 g of plant material was extracted with 50 ml of solvent (ethanol or acetone). The experiment was carried out for approximately 5 hours at 65 0C. The filtrate was separated from the mixture by filtration. The solvent was evaporated from the mixture and the solid dye extract was purified with CCl4. The number of colorants in the dye extracts was monitored with thin layer chromatography (TLC) and purification was repeated to ensure homogeneity.
Instruments
The melting points of the solid dye extracts were determined, using a gallenkemp block apparatus and are without correction. The UV-visible spectra of the dye extracts were recorded on a Genesys10SVL.200 series spectrometer. The infrared spectra were determined on a FT-IR 8310 shimadzu spectrometer, using potassium bromide pellets. The proton nuclear magnetic resonance (‘H NMR) and 13CNMR spectra were recorded on a Mercury BB 200 Series 199.96 MHz spectrometer, using tetramethylsilane (TMS) as the internal standard and DMSO-d6 and CDCl3 as solvents. The chemical shifts are expressed in parts per million (ppm) downfield from the internal standard.
Table 1: Spectral Data of Extracted Dyes
| Plant Material | IR Bands | NMR Signals | |||
| Frequency | Characteristics | ‘H-NMR | 13C-NMR | ||
| DMSO | DMSO | CDCl3 | |||
| Brosimumrubescens
(ethaanol extract) |
3419
2928 1869 1716 1608 1201 1159 1058 |
ON,NH
C-H C=0 C=C amine and amides -OCH3 |
8.80
7.65 6.81 5.82 5.25 5.20 1.00 |
174.46
152.52 146.19 144.06 142.37 141.75 127.73 115.76 112.43 110.84 104.66 87.61 80.78 99.59 77.62 59.28 54.99 52.40 49.41 48.18
|
174.45
146.19 112.44 94.64 94.61 79.57 77.62 52.39 49.43 48.18 43.15 41.40 40.99 40.56 39.73 38.89 34.41 29.66
|
| Astonia
(ethanol extract) |
3383
2926 1734 12.79 1076 1035 |
ON,NH
C-H C=0 amines/amides -OCH3
|
8.80
6.80 3.51 2.45 1.25
|
41.41
40.10 40.57 39.74 39.32 38.90 34.34 31.98 29.70 29.39 28.32 27.26 25.17 22.78 14.64 |
94.62
41.41 40.10 40.57 39.32 38.91 34.34 29.68 29.22 27.24 25.17 |
Results and Discussion
The IR spectral data of Brosimiumrubescens, Acer saccharium and Astoniascholaris dye extracts with ethanol as solvent are shown in Table 1 and they contain absorption bands of stretching vibrations of O-H and N-H groups at 3385-3419 cm-1. The stretching vibrations of C-H bonds in aromatic ring appeared at 2928 cm-1. Also in the region 1716-1734 cm-1, possible stretching vibrations of C ═ O bonds were observed. The bands of the –C ═ C– groups were observed at 1608 cm-1.
The IR spectra of the dye extracts from the same plants but with acetone as solvent gave absorptions at 3362 – 3387 cm-1 region which is indicative of the presence of O-H and N-H stretching, vibrations. The bands at 1055 – 1244 cm-1 tend to show the presence of – OCH3.12
In the case of the Astoniascholaris dye extracts, with both ethanol and acetone as solvents, absorptions for O-H and NH stretching vibrations at 3353 – 3383cm-1 region were observed. Also observed in the IR spectra, are the C-H stretching vibrations at 2854 – 2926 cm-1. The strong bands at 1710 – 1734 cm-1 in both dye extracts indicate the presence of C═O stretch. The weak bands at 1612 – 1647 cm-1 region, represent the C═C stretching vibrations of alkene-like substances such as in aryl compounds. The stretching vibrations around 1246 – 1279 cm-1 are assignable to amines and amide groups. The presence of –OCH3 groups is shown at 1035 – 1244 cm-1region.
The ‘HNMR spectra of the dye extracts showed amine and amide groups at δ 1.25 – 2.45 ppm and possible aromatic ring structure at δ 6.80 – 7.65 ppm. Also observed at δ 3.41 – 5.50 ppm is the presence of –OCH3groups. The chemical shifts of 13CNMR observed, confirmed the presence of possible aromatic ring structures at δ 94.62 – 124.46 ppm.
The results of the UV-Visible spectra (Table 1) of the dye extracts showed strong absorptions at 707 nm and 693 nm with ethanol and acetone as solvents respectively from Brosimiumrubescens, 661 nm and 583 nm from Acer saccharium dye extract with ethanol and acetone as solvents respectively, 666 nm and 750 nm from Astoniascholaris with ethanol and acetone as solvents respectively.
All the λmax values obtained above were in agreement with literaturevalues13-15. The results shown in the Table 1 above indicates that ethanol dye extracts from the various sources contain more conjugated compounds compared to those of acetone. The opposite is, however, the casein the dye extracts from Astoniascholaris where acetone extracted the highest conjugated compound of λmax775 nm. The dyes obtained from Brosimumrubescens, gave higher melting points than the others. The differences in the λmax, absorbance and melting points showed that the various solvents extracted different coloured substances from their different sources.
Table 2: Wavelength Maxima,Absorbance, and M.P. of dye extracts
| Plant material | Physical State | Wavelength λmax (nm) (inDMF) | Absorbance (A) | M.P(0C) |
| Brosimumrubescens (otaru)(ethanol) | Solid powder | 707 | 1.100 | 270 |
| Acetone | Solid powder | 693, 800 | 0.045 | 200 |
| Acer saccharium (Ambrosia) (ethanol) | Solid powder | 661 | 1.496 | 180 |
| Acetone | Solid powder | 583 | 0.852 | 172 |
| Astonia(ethanol) | Solid powder | 666 | 2.699 | 1500 |
| (Acetone) | Solid powder | 775 | 2.080 | 1600 |
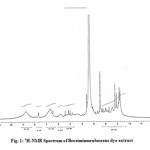 |
Figure 1: 1H-NMR Spectrum of Brosimiumrubescens dye extract.
|
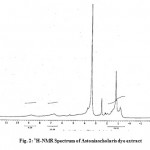 |
Figure 2: 1H-NMR Spectrum of Astoniascholaris dye extract.
|
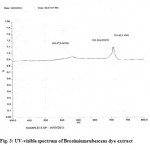 |
Figure 3: UV-visible spectrum of Brosimiumrubescens dye extract
|
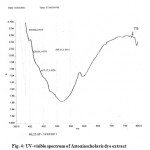 |
Figure 4: UV-visible spectrum of Astoniascholaris dye extract.
|
Effects of CDCl3 and DMSO as solvents in 13CNMR analysis of the dye extracts
Table 2, showed the results of the 13CNMRanalysis using DMSO-d6 and CDCl3 as solvents. The most characteristic feature of the 13CNMR spectra of the dye extracts from Brosimumrubescens, using the two solvents, is the presence of peaks at the δ 94.62 – 174.46 ppm. The presence of these signals show that there are aryl compounds which are aromatic in nature. The DMSO, however, gave more carbon signals at δ 104.66 – 174.46 ppm than CDCl3 (94.64 – 174.46) ppm. This shows that DMSO is a more efficient solvent in running the analysis. However, CDCl3 was observed to give two additional signals at δ 63.75 – 94.63 ppm compared to that of DMSO solvent. This indicates that CDCl3 is a much better solvent in running the analysis than DMSO for the dye extract obtained from Astoniascholaris.
Conclusions
In conclusion, the extraction and spectroscopic studies of natural dyes from Brosimiumrubescens, Acer saccharium and Astoniascholaries are described. As shown by the characterization data, the λmax of the dye extracts are quite high, with the dye extracts absorbing in the near infrared region. It is, therefore, concluded that the dye extracts that absorbed in the near infrared region are promising natural organic dyes that have the potential of acting as organic photoconductors as well as their possible use as dye-sensitized nanocrustalline energy converters. This is due mainly to two factors that the dyes have – high absorption and chemical stability.
References
- J.O. Otutu, and M.K.Yakubu: Extraction, characterization and Application of Natural dyes from Water Opepe(Nucleadideuricchi) and Water Ekimi (Vanilyaplanotolia) on Natural and synthetic fibres.Biosci, Biotec. Res. Asia. 8(2):447- 454 (2011).
- R. Singh, A.Jain, S. Panwar, D. Gupter and S.K. Khare.Antimicrobial activity of some natural dyes.Dyes and pigments66,99-102 (2005).
- R.K. Sarkar, P. De and P.D. Chauhan.Bacteriaresistfinishe on textiles.Manmade Textiles India12,460-467 (2001).
- S. Haw, J. Wu, Y.Huang and J.Lin.Natural dyes as photosensitizers for dye- sensitized solar cell. Solar energy80,209-214( 2006).
- T.B.Machado, A.V. Pinto, MCFR, Pinto ICR, Lead, M.G., Silva and A.C.F.Amaral, et al.In vitro activity of Brazilian medicinal plants, naturally occurring napthoquinones and their analogues, against methicillin resistant staphylococcus aureus. Int.J. Antimicrob.Agents21:279-84(2003).
- A.F.Nogueira, and M.A. De Paoli. A dye sensitized TiO2 photovoltaic cell constructed with an elastomerk electrolyte.Solar Energy Materials and Solar Cells61, 135-141 (2000).
- S.C. Hao, J.H. Wu and I.O. Fan.The influence of acid treatment of TiO2 porous film electrode on photoelectric performance of dye-sensitized solar cell.Solar Energy76, 745-750 (2004).
- K. Tennakone, G.R.R.R. Kumara,A.R.Kumarasinghe, K.G.UWijayanthaand P.M. Sirimanne.NanoporousTiO2photoanode sensitized with the flower pigment aniding.J. Photochem. andPhotobiology. 108, 193-198 (1997).
- B. O’Regan and M. Gratzel. A Low–cost, high efficiency solar cell based on dye-sensitized colloidal TiO2 films. Nature353, 737-740 (1991).
- S.Meng,J.Ren, and E.Kaxiras.Natural Dyes Adsorbed on TiO2Nanowire for photovoltaic Applications: Enhanced light Absorption and Ultrafast Electron Injection. Nano left.8(10), 3266 – 3272 (2008).
- T. Bechtold, R. Mussak, A. Mahmud-Ali, E. Ganglberger and S. Geissler. Extraction of natural dyes for textile dyeing from coloured plant wastes released from the food and beverage industry. J. Sci. Food & Agric.86,233 – 247 (2006).
- J.O. Otutu, E. Osabohien and E.M. Efurhievwe.Extraction of natural dyes for textile dyeing from the by-products of the timber industry.Biosci.Biotech. Res. Asia, 7(1): 87 – 92(2010).
- A.M. James, L.D. David and R.R. Osca. Experimental methods in Organic Chemistry. New York. Saunders Pub.Pp. 67 – 69 (1977).
- F.A. Carey. Organic Chemistry.3rd edn. New York. McGraw-Hill, pp. 568 – 583 (2003).
- Y.B. Paula. Organic Chemistry.3rd edn. New Jersey. Prentice-Hall Inc. 535 – 577 (2001).

This work is licensed under a Creative Commons Attribution 4.0 International License.


