

Manuscript accepted on :
Published online on: --
In vivo Animal Model for Screening of Anti Diabetic Activity
S. Raju and K. Hemamalini*
Teegala Ram Reddy College of Pharmacy, Meerpet, Hyderabad - 500 097, India.
DOI : http://dx.doi.org/http://dx.doi.org/10.13005/bbra/1062

ABSTRACT:
he Antidiabetic activity of Kigelia africana (Lam.) (Family: Bignoniaceae) and Tabebuia rosea(Bertol) DC (Family: Bignoniaceae) were investigated in Alloxan induced diabetic albino rats. A comparison was made between both the plant extracts and a known anti diabetic drug Glibenclamide (5 mg/kg body weight). The dried leaves of Kigelia africana and Tabebuia rosea were subjected to extraction by continuous hot percolation using methanol as solvent and were subjected to standardization using pharmacognostical and Phytochemical screening. Dose selection was made on the basis of acute oral toxicity study (200 mg/kg body weight) as per OECD and CPCSEA guidelines. Oral administration of extracts of Kigelia africana (200mg/kg) and Tabebuia rosea (200mg/kg) for 7 days resulted in a significant reduction in blood glucose levels. Alloxan induced diabetic rat model was used for the evaluation of anti diabetic activity. Activity is more for Tabebuia rosea in comparison with Kigelia africana. Methanolic extract of Tabebuia rosea and Kigelia africana showed significant (p<0.001) anti diabetic activity. These extracts also prevented body weight loss in diabetic rats. The drug has the potential to act as an anti diabetic drug.
KEYWORDS: Kigelia africana; Tabebuia rosea; antidiabetic activity; Alloxan;Acute oral toxicity.
| Copy the following to cite this article: Raju S, Hemamalini K. In vivo Animal Model for Screening of Anti Diabetic Activity. Biosci Biotech Res Asia 2012;9(2) |
| Copy the following to cite this URL: Raju S, Hemamalini K. In vivo Animal Model for Screening of Anti Diabetic Activity. Biosci Biotech Res Asia 2012;9(2). Available from: https://www.biotech-asia.org/?p=10103 |
Introduction
Plant
Tabebuia rosea (Bignoniaceae) is a huge canopy tree native to the Amazon rainforest and other tropical parts of south and Latin America. It is a deciduous, massive and majestic tree. It is commonly known as pink trumpet tree and can grow up to 15 meters high. It is well known for its beautiful flowers and can live for hundreds of years. The fruits are green, long and bean pod-like with a length of 20-40 cm. the fruits turn dark brown when ripe and contain flat, heart shaped seeds with tiny wings. It has other common names like paudarco, iperoxo and lapacho. It became popular in Nigeria due to its various medicinal applications traditionally, as astringent, anti-inflammatory, antibacterial, antifungal and laxative, and antidiabetic1 activity. It is used to treat ulcers, syphilis, urinary tract infections, gastrointestinal problems, cancer and allergies.
Kigelia Africana commonly known as sausage tree which grows endemically throughout Africa from Entrea and chad south to northen south Africa and west to Senegal and Namibia belonging to the family Bignoniaceae. It contains irriods, luteolin and quercetin type of flavanoids, steroidal saponins.
Materials and Methods
Animals: Healthy adult albino rats of Wister strain of either sex between the age of 2-3 months and weighing 150-200 grams were used for the present study. The animals were housed individually in polypropylene cages, maintained under standard conditions (12 hours light and12 hours dark cycle, 25 +5°C and 40-60% humidity). They were fed with standard rat pellet diet (National Institute for Nutrition, Hyderabad) and provided water ad libitum. All the animal experiments were conducted according to the ethical norms approved by CPCSEA, Ethical committee IAEC reg. no. (1447/PO/a/11/CPCSEA).
Chemicals
Alloxan monohydrate, Glibenclamide, Dextrose, Tween-80, Auto analyzer (Analytical technological limited) and One-touch (Horizon). All the other chemicals and reagents used were of analytical grade.
Collection of Plant Material
Fresh leaves were collected from Chittoor district, Andhra Pradesh, India and authentified by Dr. K. MadhavaChetty, Professor, Department of Botany S.V. University, Tirupathi, Andhra Pradesh, India.
Preparation of Plant Extraction
The collected leaves were shade dried and powdered in a grinder mixture to get coarse powder. The powdered leaves were defatted with petroleum ether and later extracted with methanol. The extract was evaporated to dryness, gave a residue of 40 % w/w.
Phytochemical Screening
A preliminary phytochemical screening of methanolic extracts of Kigelia africana and Tabebuia rosea was carried by using standard procedures2-4.
Acute Oral Toxicity Studies
Acute oral toxicity studies 5of the extracts were carried out as per the OECD guidelines, draft guidelines 423 adopted and received from Committee for the Purpose of Supervision and Control of Experiments on Animals (CPCSEA), Ministry of social justice and empowerment, Government of India. Administration of the stepwise doses of extracts of Kigelia africana from 40 mg/kg body weight up to the dose 2000 mg/kg body weight caused no considerable signs of toxicity in the tested animals. One tenth of upper limit dose were selected as the level for examination of anti-diabetic activity.
Anti-diabetic Model
Alloxan monohydrate was first weighed individually for each animal according to their weight and then solubilized with 0.2 ml saline just prior to injection. Diabetes was induced by injecting it at a dose of 120 mg/kg body weight intraperitonially6. After 1 hour of Alloxan administration, the animals were given feed ad libitum, and 5% dextrose solution was also given in a feeding bottle for a day to overcome the early hypoglycemic phase. The animals were kept under observation and after 72 hours blood glucose was measured by One-touch glucometer. The diabetic rats (glucose level 200-300 mg/dl) were separated and divided into six different groups for experimental study, with each group containing six animals.
Experimental Design
Different groups of rats were used to study the effects of MEKA and METR. The rats were divided into six groups each consisting of six rats.
Group-I: Normal/control animals received 1% tween80, 1ml per orally.
Group-II: Alloxan (120mg/kg body weight) induced diabetic animals received in 1% tween80, 3ml/kg body weight per orally.
Group-III: Alloxan (120g/kg body weight) induced diabetic animals received Glibenclamide 5mg/kg body weight per orally.
Group-IV: Alloxan (120mg/kg body weight) induced diabetic animals received TRME 200mg/kg, body weight per orally.
Group-V: Alloxan (120mg/kg body weight) induced diabetic animals received KAME 200mg/kg, body weight per orally.
Significant hyperglycemia was achieved within 48 hrs after Alloxan (120mg/kg b.w. i.p.) injection induced diabetic rats with more than 200mg/dl of blood glucose were identified as to be diabetic and used for the study.In acute study all the surviving diabetic animals and normal animals were fasted overnight Blood samples were collected from the fasted animals prior to the treatment with above scheduled and after administration, at each day up to 7 days.
Body Weight Measurement
Body weight was measured totally four times during the course of study period7 [i.e., before Alloxan induction (initial values), and on the first, fourth, and seventh days of the treatment period], using a weighing scale.
Statistical Analysis
The results of the study were subjected to one way analysis of variance (ANOVA) followed by Dunnett’s t-test for multiple comparisons. Values with P<0.05 were considered significant.
Results
Phytochemical Screening
Phytochemical screening of the extracts of Kigelia africana and Tabebuia rosea showed the presence of various chemical constituents, mainlyAlkaloids, Tannins, Flavonoids may be responsible for its Anti-diabetic properties.The results obtained were comparable and satisfied the standard literature.
Acute Oral Toxicity Studies
In acute toxicity study, none of the studied methanolic extracts of leaves showed any significant toxicity sign when observed for the parameters during the first 4 hours and followed by daily observations for 14 days and mortality was also not observed. The drug was found to be safe at the tested dose level of 2000 mg/kg b. w. One-tenth of this dose level was taken as effective dose. All the extracts were experimented at the same dose of 200 mg/kg b. w. In order to ascertain a scientific base for the usefulness of this plant in the treatment of diabetes. It was decided to evaluate experimental design of anti diabetic activity by Alloxan-induced model.
Oral glucose tolerance test
The effect of different extracts on glucose tolerance test in normal rats is shown in Table-1. At 30 min after glucose administration, the peak of blood glucose level increased rapidly from fasting value and then subsequently decreased. The methanolic extracts of Kigelia africana and Tabebuia rosea exhibited remarkable blood glucose lowering effect at 90 min.
Table 1: Effect of Methanolic extract of Kigelia africana and Tabebuia rosea on blood glucose level in Oral glucose tolerance test in normal rats.
| Blood Glucose Levels (mg/dl) | ||||
| Sample | 0 min | 30 min | 90 min | |
| Normal control | 86 + 1.065 | 127.2 + 4.23 | 83.17 + 1.24 | |
| Glibenclamide | 80.50 + 1.335*** | 127 + 4.203*** | 92.17 + 0.94*** | |
| METR | 80.33 + 0.667*** | 122.5+ 0.284*** | 90.33+ 2.12*** | |
| MEKA | 80.83+ 0.4774*** | 127.2 +4.23*** | 88.83+0.6007*** | |
The values are expressed as mean + SEM. n=6 animals in each group Statistical significant test for comparison was done by ANOVA, followed by Dunnett’s t-test. The blood glucose values of groups are compared with normal control animals, values ***p<0.001, **p<0.01, *p<0.05.
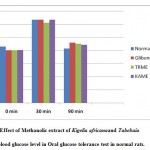 |
Figure 1: Effect of Methanolic extract of Kigelia africanaand Tabebuia rosea on blood glucose level in Oral glucose tolerance test in normal rats.
|
Alloxan induced diabetic model
As expected in the diabetic control, there was severe hyperglycemia as compared to the normal animals. Compared to the diabetic control, the TRME and KAME lowered the elevated blood glucose levels only in sub acute treatment Table-2. It was observed that the standard drug Glibenclamide lowered the blood glucose level significantly, bringing it nearly back to normal, whereas TRME and KAME significantly (p<0.01) decreased fasting blood serum glucose in diabetic rats on 3rd and 7th days as compared to initial (0 hr) blood serum glucose levels and on comparison the Tabebuia rosea showed more significant anti diabetic activity when compared to Kigelia africana, significance was found to be **p<0.01.
Table 2: Effect of Methanolic extract of Kigelia africana and Tabebuia rosea on blood glucose level of Alloxan induced diabetic albino rats.
| Group | Treatment | Blood Glucose Levels (mg/dl) | ||
| 0 day | 3rd day | 7th day | ||
| I | Normal Control | 83.67 + 2.48 | 83.5 + 1.83 | 84.17 + 2.15 |
| II | Diabetic Control | 323.3 + 12.92 | 369.7 + 7.06 | 414.2 + 5.03 |
| III | Glibenclamide | 277.3 + 5.22* | 127 + 4.2*** | 107.2 + 4.11*** |
| IV | METR | 277.3+ 5.22* | 129.8 + 5.16** | 108.2+4.11*** |
| V | MEKA | 295.3+3.95* | 146.8 +5.57** | 127.5+2.56*** |
The values are expressed as mean + SEM. n=6 animals in each group Statistical significant test for comparison was done by ANOVA, followed by Dunnett’s t-test. The blood glucose values of groups III, IV, V and VI are compared with control animals, values ***p<0.001, **p<0.01, *p<0.05
Table 3: Effect of Oral administration of the methanolic extracts of Kigelia african aand Tabebuia rosea on serum profile in experimental rats after 7 days.
| G | TG | TP | LDH | Chol | Creat | ALP | AST | ALT | Alb | BUN | HDL | LDL |
| NC | 86.17+1.8 | 6.45+0.1 | 2192 + 80 | 139.3 + 2.98 | 0.53 + 0.03 | 114.7 + 1.61 | 50.67 + 2.04 | 90.5 + 0.99 | 4.145 + 0.11 | 24 + 1.5 | 43.5 + 0.763 | 70.83 + 0.98 |
| DC | 107.0+
2.68 |
5.16 + 0.14 | 1485 + 15.0 | 274.5+ 1.94 | 1.30 + 0.11 | 315.3 + 8.83 | 91.33 + 1.70 | 165.2 + 4.67 | 2.75 + 0.29 | 60.80 + 0.89 | 32.17 + 0.6 | 109.5 + 1.765 |
| Gli | 92.17 + 1.70*** | 6.27+0.08*** | 1944 + 26.15*** | 144.7 +3.2*** | 0.55 + 0.03*** | 130.3 + 3.99*** | 61.17+ 1.53*** | 110.0 + 4.96*** | 3.66 + 0.15*** | 30.46 + 1.33*** | 45.5 + 1.118*** | 72.83+ 1.376*** |
| METR | 93+ 2.12*** | 6.27+0.13*** | 1911+ 22.85*** | 159.5+4.2 | 0.52+ 0.06*** | 133.5+ 2.64*** | 62.17 + 2.272*** | 107.0 + 2.04*** | 3.662 + 0.13*** | 29.25+1.26*** | 46.67+ 0.666*** | 75.+ 1.673*** |
| MEKA | 93.17 + 2.613*** | 5.96+ 0.12*** | 1995+13.29*** | 171.2+2.044 | 0.79+ 0.048*** | 135+3.16*** | 71+ 2.596*** | 141.7+ 1.83*** | 3.623+ 0.16*** | 39.74+ 0.30*** | 41+ 0.730*** | 84.17+ 1.515*** |
Values are expressed as mean + SEM, n=6. Statistical significance test for comparison was done by ANOVA, followed by Dunnett’s t-test.***p<0.001, **p<0.01, *p<0.05.
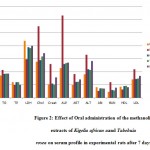 |
Figure 2: Effect of Oral administration of the methanolic extracts of Kigelia african aand Tabebuia rosea on serum profile in experimental rats after 7 days.
|
Body Weight Measurement
In the present study, diabetic rats had lower body weights and high blood glucose level as compared to normal rats. In spite of increased food consumption, loss of body weight due to defect in glucose metabolism and excessive breakdown of tissue protein is a characteristic condition in diabetics. As shown in Table-4, treatment with METR and MEKA improved the average body weights of rats, which indicates that control over polyphagia and muscle wasting resulted due to hyperglycemic condition.
Table 4: Effect of the methanolic extracts of Kigelia africana and Tabebuia rosea on body weight after treatment in diabetic rats.
| Group | Treatment | Average body weight (g) +SEM | |
| Initial value | Day 7 | ||
| I | Normal control | 170 + 1.36 | 185.8 + 2.15 |
| II | Diabetic control | 141.3 + 1.99 | 118.3 + 2.09 |
| III | Glibenclamide | 180 + 4.5*** | 203.8 + 3.18*** |
| IV | METR | 180+ 4.5*** | 201.3 + 2.30*** |
| V | MEKA | 169.8+2.4*** | 172+4.08*** |
The values are expressed as mean + SEM. n=6 animals in each group Statistical significant test for comparison was done by ANOVA, followed by Dunnett’s t-test. The Average body weight values of groups are compared with normal control animals, values ***p<0.001, **p<0.01, *p<0.05.
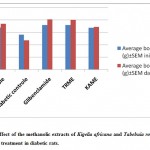 |
Figure 3: Effect of the methanolic extracts of Kigelia africana and Tabebuia rosea on body weight after treatment in diabetic rats.
|
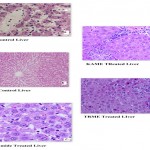
Histopathology:
Photomicrograph of liver stained with haemotoxylin and Eosin (magnification x 400).
a) Group-I (Normal control) Hepatocytes are normal, b) Group-II (Diabetic control) with shrunken nuclei, granular cytoplasm and dilated sinusoids, c) Group-III (Glibenclamide) Normal hepatocytes, dilated central veins are seen, d) Group-V (KAME) Focal areas of necrosis are seen and hepatocytes are normal. Perivascular round cell collection (PVRCC) and portal tract infiltration with lymphocytes are also seen, e)Group-IV (TRME) hepatocytes are normal. Occasional dilated central veins are seen along with occasional focal areas of necrosis.
 |
Graph 1
|
 |
Graph 2
|
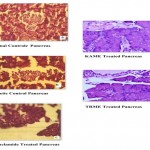
Photomicrograph of Pancreas stained with haemotoxylin and Eosin (magnification x 400).
a) Group-I (Normal control) Normal islets with acni, b) Group-II (Diabetic control) islet cells with fatty infiltration shows damaged and atrophic islet with acni, c) Group-III (Glibenclamide) islet cells are small, d) Group-V (KAME) islets with normal structural intactness with their nucleus, e) Group-IV (TRME) islets with normal round and elongated.
Discussion
In the recent times many traditionally used medicinally important plants were tested for their anti hyperglycemic potential by various investigators in experimental animals. I have undertaken a study on Kigelia africana and Tabebuia rosea for their anti diabetic activity.
The present experiment was continuous post treatment for 7 days with the METR and MEKA where METR showed more potential hypoglycemic activity than in MEKA in OGTT and normoglycemic rats and Alloxan induced diabetogenic rats.
Preliminary Phytochemical screening revealed that MEKA showed positive response to Alkaloids, Tannins, Flavonoids, Carbohydrates, Lignins, Proteins and in METR, the response was positive to Flavonoids. The increased level of glycosylated haemoglobin (HbA1c) is directly proportional to the decreased level of hemoglobin in diabetic control experimental rats. HbA1c is used as most reliable marker and standard diagnosis practices for estimating the degree of protein glycation during diabetes mellitus9. Proglycation is a non-enzymatic reaction between excess glucose present in the blood and free amino groups on the globin component of haemoglobin. Measurement of HbA1c level provides information of long term glycemic status and to correlate with various complications related to Diabetes mellitus. On oral administration of METR and MEKA, the METR, is more significantly decreased the Hb1c level possibly due to normoglycemic control mechanisms in experimental rats which also reflect the decreased protein glycation condensation reactions and the reports obtained is concordant with the previous result10. A marked increase in serum concentration of TC, TG, LDL and decreased HDL was observed with diabetic rats than normal control group which is often linked with hyperlipidaemia. Hyperlipidaemia certainly contributes to major risk factor for cardio vascular diseases11,12. During diabetic state, insulin deficiency contributes to derangements of various metabolic and regulatory mechanisms in body. At normal state insulin activates the lipolytic hormones action on the peripheral fat depots which hydrolyses triglycerides and prevents mobilization of free fatty acids13, 14. However, insulin deficiency inactivates the lipoprotein lipase which promotes liver conversion of free fatty acids into phospholipids and cholesterol and finally discharged into blood which resulted into elevated serum phospholipid level15,16. My result of this study reveals that the administration of TRME and KAME not only lowered TC, TG and LDL, but also enhanced the cardioprotective lipid HDL.
References
- Maria Lopez- Ramos, Lauro Figuero- valverde, Francisco Diaz-Cedillo, Elodia Garcia-Cervera and Eduardo Pool- Gomez “ effect induced by Tabebuia rosea on glucose concentration in a rat diabetic model” African Journal of Pharmac y and Pharmacology, 6(16), 1288-1297, 2012.
- Roopashree TS, Dang R, Rani SRH, Narendra C. Antibacterial activity of anti-psoriatic herbs: Cassiatora, Momordicacharantia and Calendula officinalis. International Journal of Applied Research in Natural Products, 1(3), 20-28, 2008.
- Obasi NL, Egbuonu ACC, Ukoha PO, Ejikeme PM. Comparative phytochemical and antimicrobial screening of some solvent extracts of Samaneasaman pods. African journal of pure and applied chemistry, 4(9), 206-212, 2010.
- Audu SA, Mohammed I, Kaita HA. Phytochemical screening of the leaves of Lophiralanceolata (Ochanaceae). Life Science Journal, 4(4), 75-79, 2007.
- OECD/OCDE, OECD Guidelines for the testing of chemicals, revised draft guidelines 423: Acute Oral toxicity- Acute toxic class method, revised document, CPCSEA, Ministry of Social Justice and Empowerment, Govt. of India; 2000.
- Sellamuthu PS, Muniappan BP, Perumal SM, Kandasamy M. Antihyperglycemic effect of mangiferin in streptozotocin induced diabetic rats. Health Sci, 55, 206-214, 2009.
- Kannur DM, Hukkeri VI, Akki KS. Antidiabetic activity ofCaesalpiniabonducella seeds extracts in rats. Fitoterapia, 77, 546-549, 2006.
- Nagappa AN, Thakurdesai PA, VenkatRao N, Singh J. Antidiabetic activity ofTerminaliacatappa linn fruits. Journal Ethnopharmacol, 88, 45-50, 2003.
- E. Goldstein, R. R. Little, H. M. Wiedmeyer, J. D. England, C. L. Rohlfling, A. L. Wilke, Is glycohemoglobin testing useful in diabetes mellitus? Lessons from the diabetes control and complications trial.Clin. Chem, 40, 1637-1640, 1994.
- K. Jain, J. L. Croad, Effect of chromium niacinate and chromium picolinate supplementation on lipid peroxidation, TNF-alpha, IL-6, CRP, glycatedhemoglobin, triglycerides, and cholesterol levels in blood of streptozotocin-treated diabetic rats. Free Rad Biol Med, 43, 1124-1131, 2007.
- S. Umesh, K. Yadav, K. Moorty, Z. B. Najma,Combined treatment of sodium orthovanadate andMomordicacharantia fruit extract prevents alterations in lipid profile and lipogenic enzymes in alloxan diabetic rats.Mol cell Biochem, 268, 111-120, 2005.
- A. Nikkila, M. Kekki, Plasma triglyceride transport kinetics in diabetes mellitus.metabolism, 22, 1, 1973.
- R. Briones, S. J. T. Mao, P. J. Palumbo, W. M. OFallon, W. Chenoweth, B. A. Kottke,Analysis of plasma lipids and apolipoproteins in insulin-dependent and noninsulin-dependent diabetics. Metabolism, 33, 42-49, 1984.
- A. Nikkila, Plasma lipid and lipoprotein abnormalities in diabetes. In: Jarrett, R. J. (Ed.), Diabetes and heart Disease. Elsevier Science Publishers B. V., Amsterdam, the Netherlands, 134-167, 1984.
- Shirwaikar, K. Rajendran, I. S. R. Punitha, Antidiabetic activity of alcoholic stem extract of Cosciniumfenestratum in streptozotocin-nicotinamide induced type 2 diabetic rats. J. Ethnopharmacol, 81, 199-204, 2002.
- N. Pushparaj, H. K. Low, J. Manikandan, B.K. Tan, C.H. Tan, Anti-diabetic effects of Cichoriumintybus in streptozotocin-induced diabetic rats.J. Ethnopharmacol, 111(2), 430-434, 2007.

This work is licensed under a Creative Commons Attribution 4.0 International License.


