

Manuscript accepted on :
Published online on: --
Effect of soyabean diet on body weight and serum protein level of alloxan induced diabetic rats
Andrew C. Nwaka1* and Peter N. Uzoegwu2
1Department Of Biochemistry, Anambra State University, Uli, Nigeria.
2Tropical Diseases Research Unit, Department of Biochemistry, University of Nigeria, Nsukka, Nigeria.
Corresponding Author E-mail: andynwaka@yahoo.com
DOI : http://dx.doi.org/http://dx.doi.org/10.13005/bbra/1046

ABSTRACT: In this study, the effect of soyabean supplemented diet on serum protein level and body weight of diabetic rats were evaluated in a total of 32 rats weighing 150-250 grams. The rats were separated into four groups of eight rats each. The groups were as follows: A- Rats fed on rat feed, B-rats fed on rat feed and soyabean meal, C-diabetes-induced rats fed on rat feed and D-diabetes induced rats fed on rat feed and soyabean meal. The rats were fed for 28days, while their body weights were measured at 7 days intervals using electronic metler weighing balance. At the end of the 28days, the rats were bled and sera obtained used to determine serum albumin, globulin and total protein using standard biochemical methods. The results of this study indicated that the mean serum total protein, albumin and globulin concentrations of the diabetic rats fed on normal rat feed (group C) were significantly lower (P<0.5) than those of the control (Group A) and those of diabetic rats fed on soyabean supplemented diet (Group D). There was no significant difference (P>0.05) observed between the mean serum total protein, albumin and globulin levels of diabetic rats fed on soyabean supplemented diet (group D) when compared to those of the control (Group A i.e. rats fed on normal rat fed on normal rat feed). The result of the mean percentage changes in body weight on the first, second and third week of the study indicated significant reduction (P<0.05) in body weight of diabetic rats fed on normal feed when compared to that of the control (Group A), while there was no significant difference (P>0.05) observed in the mean percentage change in body weight of diabetic rats fed on soyabean supplemented diet (Group D) when compared to that of the control, (Group A).
KEYWORDS: Diabetes Mellitus; Serum Protein; Body Weight and Soyabean.
| Copy the following to cite this article: Nwaka A. C, Uzoegwu P. N. Effect of soyabean diet on body weight and serum protein level of alloxan induced diabetic rats. Biosci Biotech Res Asia 2012;9(2) |
| Copy the following to cite this URL: Nwaka A. C, Uzoegwu P. N. Effect of soyabean diet on body weight and serum protein level of alloxan induced diabetic rats. Biosci Biotech Res Asia 2012;9(2). Available from: https://www.biotech-asia.org/?p=10008 |
Introduction
Diabetes mellitus, often referred simply as diabetes, is a syndrome characterized by disordered metabolism and abnormally high fasting blood-sugar (hyperglycaemia) resulting from insufficient levels of the hormone, insulin or its insensitivity (Tierney et al., 2002). It is a chronic disease characterized by elevated blood glucose levels and disturbances in carbohydrate, fat and protein metabolism (Sky, 2000; Rother, 2007).
The World Health Organization, recognizes three main form of diabetes mellitus: type I, type 2 and gestational diabetes (occurring during pregnancy) (WHO, 1999). Type I diabetes mellitus formerly called Juvenile onset or Insulin-Dependent diabetes mellitus (IDDM) is characterized by loss of the insulin-producing beta cell of the islets of langerhans of the pancreas, leading to a deficiency of insulin. The main cause of this loss of β cell is a T-cell mediated autoimmune attack (Rother, 2007). There is no known preventive measure which can be taken against type I diabetes. While type 2 diabetes mellitus, also known as Non-Insulin Dependent diabetes mellitus (NIDDM), is characterized differently due to insulin resistance or reduced insulin sensitivities combined with reduced insulin secretion (Rosenbloom and Silverstain, 2003). Furthermore, gestational diabetes mellitus (GDM) resembles type 2 diabetes in several respects, involving a combination of relatively inadequate insulin secretion and responsiveness (WHO, 1999).
According to the World Health Organization, at least 171 million people worldwide (2.8% of the population) suffer from diabetes mellitus (Wild et al., 2004). Its incidence is increasing rapidly, and it is estimated that the year 2030, this number will also double (Wild et al., 2004). While in Nigeria, diabetes mellitus has emerged as one of her biggest health problems and its prevalence is increasing at an alarming rate (Unadike, 2010).
Soyabean is a plant of the family leguminoseae. Legumes are noted for their relatively high protein content when compared with cereals, tubers, fruits and vegetables. Soyabean contains about 40% protein, 18% fat and has a high concentration of minerals such as calcium, iron etc (Anosike et al., 2007).
Materials and Methods
Materials
Chemical used
All the chemicals used in this research were of Analytical Grade.
Animal Used
Mature healthy male albino rats of average age of 13 weeks
weighing 150-250 grams were procured from the faculty of Veterinary Medicine laboratory and the animal house, University of Nigeria, Nsukka campus. The rats were acclimatized for 14days before the commencement of this study. The rats were all supplied with normal standard pelleted rat feed and water ad libitum.
Soyabean
Soyabean seeds were purchased from Nsukka market, roasted, deshelled and processed into powder (Soyabean powder). Its proximate composition was determined using the method described by AOAC (2000).
Soyabean Meal
Rats on soyabean meal were given 9.6g/kg body weight of soyabean powder dispersed in water by intubation each morning before the animals were fed for the day
Rat Feed
The normal rat feed used in this study was pelleted growers feed (Vital Feeds®)
Methods
Experimental Design
Thirty-two (32) mature male albino rats, weighing 150-250 grams were used in this study. The rats were separated into four goups of eight rats each, and kept in four different standard cages as follows:
Groups Treatment
A Rats fed on rat feed
B Rats fed on rat feed and soyabean meal
C Diabetes-induced rats fed on rat feed
D Diabetes-induced rats fed on rat feed and soyabean meal
All the protocols as approved by the Institution Animal Ethics Committee (IAEC) were observed in this study. At the end of 28days, the rats were fasted for 12hours and bled from the retro-bulbar plexus of the medial canthus of the eyes. The blood were collected into plain sample bottles and allowed to stand for 30 minutes and clotted. The clotted blood was then centrifuged at 3,000 revolutions per minute for 10 minutes. The serum was extracted and used for serum protein assays. Serum total protein was determined using Direct Biuret Method (Luban, 1978), while serum albumin was determined using Bromocresol Green Method (Doumas et al., 1971; Doumas and Peter, 1997).
Serum globulin was determined indirectly by subtracting the albumin concentration from serum total protein concentration (Ochei and Kolhatkar, 2008b).
Induction of Diabetes
Diabetes was induced in the rats by injecting 180mg/kg body weight of alloxan monohydrate intraperitoneally in 0.9% w/v Nacl (normal saline) after fasting the rats for 12hours. Seven days after the alloxan administration, the rats were fasted for 12hours and their blood glucose level was measured. Rats having blood glucose level of 400mg/dl and above were selected and used as diabetic rats in this study. Rats that were described as fasted were deprived of food for at least 12 hours but were allowed free access (ad libitum) to drinking water.
Results
The result of proximate analysis for the soyabean powder used in this study (Fig.1) indicated that its moisture content was 7.40%, protein 48.22%, fibre 3.80%, fat 15.90%, ash 4.60%, and carbohydrate content 20.08%. Also, the result of proximate analysis of normal feed (pelleted growers mash of vital feed) used this study (Fig. 2) showed that the feed’s moisture content was 16.75%, fat 5.80%, ash 7.25%, fibre 2.60%, protein 17.95% and carbohydrate content was 49.65%
The result of the mean serum total protein for the different groups of rats used in this study as shown in table 2 indicated that the mean serum total protein, albumin and globulin concentrations of the diabetic rats fed on normal rat feed (group C) were significantly lower (P< 0.05) than those of the control (group A), those of normal rats fed on normal feed and soyabean meal (Group B) and those of diabetic rats fed on soyabean supplemented diet (group D).
Moreover, Table 2 indicated that there was no significant difference (P> 0.05) existing between the mean serum total protein, albumin and globulin of the normal rats fed on soyabean diet (group B) when compared to those of the normal rats fed on normal feed (group A). Table 1 shows the result of percentage changes in the body weights for the different groups of rats used in this study at weekly intervals. Result (table 1) showed that in the first, second and third weeks of the study, the mean percentage increases in the body weight for the rats fed on normal feed and soyabean meal (group B) were lower than those of the rats fed on normal feed (Group A). the diabetic rats fed on normal feed only (Group C) showed significant percentage decrease (PC0.05) in body weight on the first, second and third week of the study, while the diabetic rats fed on soyabean supplemented diet (group D) had significant percentage weight gain (P <.0.05) on the first, second and third week.
Discussion
The results of the mean percentage changes in body weight (table I) revealed significant percentage increase in the weight (P < 0.05) for groups A,B and D rats on the first, second and third weeks of the study. However, the percentage weight increase in the groups that soyabean meal was incorporated in their diet (groups B and D) was significantly lower (P< 0.05) than that of the control group. This could be as a result of proximate composition of soyabean (Fig. 1), when compared to that of the normal feed (Fig. 2), which indicated that soyabean has a very high protein (48.22%) and low carbohydrate (20.08%) composition, when compared to normal feed used in this study with higher carbohydrate (49%) and lower protein (18%) contents (Fig. 2). Weight gain is normally associated with diets with high carbohydrate and fats contents, while protein diet is normally associated with growth and development of tissues. So, the significant (P< 0.05) percentage decrease in body weight of rats fed on soyabean diet when compared with their counterparts fed on normal feed could be as a result of low carbohydrate and high protein contents with its essential amino acids of the soyabean diet used in this study. This confirms soyabean’s potential to stabilize body weight (Macveigh et al., 2006).
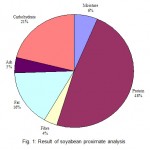 |
Figure 1: Result of soyabean proximate analysis.
|
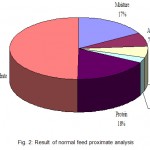 |
Figure 2: Result of normal feed proximate analysis.
|
Table 1: Result of the mean percentage changes in body weight for the diabetic and normal rats fed on normal and soyabean meal used
| Time on diet (week) | Mean+ Standard Deviation percentage increase and decrease in body weight (%) | |||
| Group A | Group B | Group C | Group D | |
| 0 | 0 | 0 | 0 | 0 |
| 1 | 8.50± 1.94 | 6.12± 1.76 | -3.51± 1.50 | 1.82± 0.35 |
| 2 | 6.32± 1.20 | 3.16± 0.92 | -1.68± 0.86 | 1.37± 0.45 |
| 3 | 7.34± 3.17 | 4.89± 1.84 | -1.64± 1.20 | 1.94± 0.34 |
NB: Minus (-) sign represent percentage decrease in body weight
Table 2: Result of the Mean + Standard Deviation Serum Protein Profile in (g/dl)
| Groups | Total Protein (g/dl) | Albumin (g/dl) | Globulin (g/dl) |
| A | 7.60± 0.86 | 4.21± 0.74 | 3.39± 0.84 |
| B | 7.90± 0.53 | 3.99± 0.64 | 3.91 ± 0.73 |
| C | 4.50± 0.81* | 2.79± 0.23* | 2.11± 0.59* |
| D | 6.52± 0.76 | 3.42± 0.45 | 3.10± 0.36 |
* = Values significantly different (p < 0.05) from that of group A (general control)
Table I, shows significant percentage decrease (P. <0.05) in the body weight of diabetic rats fed on normal feed (group C), indicative of the inability of diabetic rats to convert excess glucose into glycogen and triacylglycerols for storage. Diabetics therefore could lose weight even if the caloric content of the diet is high due to excretion of excess glucose in urine instead of being metabolized to and stored as fat (Lehninger, 1987). Also during chronic diabetic condition, amino acids of muscles and tissues are metabolized to furnish the needed energy due to inability of the body to utilize blood glucose for energy generation. The loss of these amino acids in the muscles could be responsible for the shrinking or loss in the body weight experienced in group C rats. This percentage decrease in weight observed in group C, which is normally associated with severe diabetes, was however, alleviated with the introduction of soya diet in group D, probably due to high protein content of the soyabean with its essential amino acids. The essential amino acids could have helped to replenish those lost in the muscles for the energy generation in diabetic rats fed with soyabean diet (group D). So, the gain in body weight experienced in diabetic rats fed on soyabean supplemented diet (group D) could be as a result of replenishment of the lost amino acids in the muscle by the essential amino acids of the soyabean. This may also help in explaining soyabean’s ability to stabilize blood glucose level in diabetics (Kaufman et al., 1997, Messina, 1999, Villegas and Geto, 2008).
Furthermore, table 2 revealed significant increases (P<.05) in the mean serum total protein for both diabetic and non diabetic rats fed on normal feed and soyabean meal when compared to their counterparts fed on only normal feed. This could be as a result of the high protein content of soyabean used in this study as indicated in its proximate analysis (Fig. 1).
The results also revealed significant reduction (P< 0.05) in the mean serum total protein of diabetic rats fed on normal feed only (Group C) when compared to the control (group C) when compared to the control (group A). Muscle protein is utilized for energy generation in diabetics due to inability to utilize blood glucose. The utilization of muscle protein for energy generation could have caused reduction in serum protein of diabetic rats fed on normal feed (group c).
In addition, this reduction in serum protein could also result from pancreatic dysfunction usually associated with diabetes mellitus in which there is always decrease in serum protein and increase in blood glucose levels. However, this reduction in mean serum protein was almost completely restored to normal level when soyabean was incorporated into the rats’ diet (group D), due to perhaps the replenishment of lost protein for energy generation by the essential amino acids of soyabean diet. This observation seems to be supported by the fact that total protein levels could be improved or brought to normal level in diabetic and cancer patients following soyabean supplementation intervention (Terpstra et al., 1982, Mukhopadhyay et al., 1995) . Table 2, also indicated significant decrease (P< 0.05) in the mean serum globulin levels in diabetic rats fed on normal feed, (group C), which could be due to the loss of protein for energy generation in diabetic rats fed on normal feed (group C). This decrease was restored to almost normalcy in the diabetic rats fed on normal feed and soyabean meal (Group D). High protein content of soyabean diet with its essential amino acids could have helped in replenishing the lost ones in diabetic rats fed on soyabean supplemented diet (group D). This result also could corroborate the reports of Terpstra et al., (1982) and Mukhopadhyay et al., (1995), that total protein and globulin levels could be improved through soyabean supplementation.
Conclusion
The results of this study suggest that soyabean diet could assist in boosting the serum protein level and in stabilizing the body weight of albino rats.
References
- Anosike, C.A., Ezeanyika, L.U.S. and Obidoa, O. (2007). Effect of Roasted Soyabean (Glycine max) diet on the Histology of selected Rats Tissues. Bio-Res., 5 (2): 237-240.
- AOAC (2000). Official Method of Analysis of Association of Official Analytical chemists. Washington D.C., 16th Edition.
- Doumas, B.T. and Peter, T. Jr. (1997). Serum and Urine Albumin: a Progress Report on their Measurement and Clinical Significance. Clin. Chim. Act. 258: 3-29.
- Doumas, B.T., Watson, W.A. and Biggs, H.G. (1971) Albumin Standards and the Measurement of Serum Albumin with Bromocresolgrain. Clin. Chim. Act. 31 :87-96.
- Kaufman, P., Duke, J., Brieimama, H., Bak, J and Hoyt, J.A. (1997). A Comparative Study of Leguminous Plants are Sources of the Isoflavozes, Genistem and Diadzein implications for Human Nutrition and Health. J. Alter. Complin. Med. 3(1): 7-12
- Lehninger, A.L. (1987). Diagnosing and Treating Diabetes Mellitus relies on Biochemical Measurements. Principle of Biochemistry. Worth Publishers Inc., New York. Pp. 712-715
- Lubran, M.M. (1978). The Measurement of Total serum Proteins by Biuret Method. Ann. Clin. Lab. Sc., 8 (2): 106-110.
- Macveigh, B.L., Dallingham, B.L., Lampe, J.N., Duncan, A.M., (2006). Effect of Soyabean Varying Isoflavoze Content on Serum Lipids in Healthy Young Men. Am. J. Clin. Nutr. Journal of Clinical Nutrition, 83(2): 224-251.
- Messina, M.J. (1999). Legumes and Soyabean: An overview of their Nutritional Profiles and Health effects. Am. J. Clin. Nutr., 70: 4395-4505.
- Mukhopadayay, P., Bhattacharyya, J., Sanyal, U. Sukta, D. (1995). Serum Protein, Lipid and selected Vitamins during Caloric restriction and Soyabean supplementation in the Diet of normal and tumor bearing Mice. Nutri. Res., 15(7): 983-992.
- Ochei, J. and Kolhatkar, A. (2008b). Estimation of Serum Globulin. Medical Laboratory Science (Theory and Practice). Tata McGraw-Hill Publishing Company Limited, New Delhi. Pp. 176-185.
- Rosenbloom, A. and Silverstein, J.H. (2003). Type 2 Diabetes in Children and Adolescents: A Clinicians Guide to Diagnosis, Epidemiology, Pathogenesis, Prevention and Treatment. American Diabetes Association, U.S.I.
- Rother, K.T. (2007). “Diabetes Treatment-Bridging the Divide”. N. Engl. J. Med. 356 (15): 1499-1501
- Sky, G.M. (2000). Kinetics of Insulin Secretion Underlying Metabolism Events in Diabetes Mellitus. Diabetes Mellitus: A Fundamental and Clinical Text Lippicott Williams and Wilkins, Philadephia. Pp. 2-11
- Terpstra, A.H., Van, T.G. and West, C.E. (1982). The Hypocholesterolemic Effect of Dietary Soy Protein in Rats. J. Nutr., 112: 810-817.
- Tierney, I.M., McPhee, S.J. and Papadakis, M.A. (2002).Current Medical Diagnosis and Treatment of Diabetes. Large Medical Books. McGraw-Hill, New York. Pp. 1203-1215.
- Unadike, B.C. (2010). Awareness and Knowledge about Diabetes Mellitus among Nursing Students in the Niger delta Region of Nigeria Middle East. J. Nurs. 4(1): 1-8.
- Villegas, R. and Gao, Y.T. (2008). Legume and Soy Food intake and incidence of type 2 Diabetes in the Shanghai Women’s Health. Am.J. Nutr. 87(1): 162-167.
- WHO (World Health Organization) (1999) Department of Non-communicable Disease Surveillance (1999). Definition, Diagnosis and Classification of Diabetes Mellitus and its Complications.
- Wild, S., Roglic, G., Green, A., Sicree, R. and king, H. (2004). Global Prevalence of Diabetes: Estimate for the year 2000 and Projections for 2030. Diab. Car., 27(5): 1047-1053.

This work is licensed under a Creative Commons Attribution 4.0 International License.


