

Manuscript accepted on : 24 May 2012
Published online on: --
Ravichandra Potumarthi1,2*, Keerthana Nagavalli R.¹ and Annapurna Jetty¹
¹Bio Engineering and Environmental Center (BEEC); Indian Institute of Chemical Technology (CSIR), Tarnaka, Hyderabad 500 607, India.
²Bio Engineering Laboratory, Department of Chemical Engineering, Monash University, Clayton, Victoria 3800, Australia.
Corresponding Author E-mail: pravichandra@gmail.com
ABSTRACT: Alkaline protease production was studied in a batch stirred tank reactor at different initial casein concentrations in the range of 20, 30, 40 and 50 g/l by Bacillus licheniformis NCIM-2042. Protease production was observed during the bioreactor operation substrate utilization, protease formation and biomass growth was estimated. With the variation of initial casein concentration on the levels of 20, 30, 40 and 50 g/l, the protease production pattern was changed respectively at the end of 72 hours of bioreactor operation. As the concentration of limiting substrate increased, the protease production was found to decrease. The Ks value was found to be 23.361 g/l, Ki is 0.2647 g/l and μm is 60.65, hr-1. A maximum of 3.3681 U/ml.hr protease product formation rate could be achieved as calculated by the Vm value. The Km value is the saturation constant or Michaelis constant of the product formation kinetics, the Km value in the present study was 2.32E-08.
KEYWORDS: Stirred tank reactor; Protease production; Inhibition kinetics; Michaleis-Menten
Download this article as:| Copy the following to cite this article: Potumarthi R, Nagavalli K. R, Jetty A. Kinetic Analysis of Alkaline Protease Production at Different Substrate Concentrations by Bacillus licheniformis - NCIM 2042 in Stirred Tank Reactor. Biosci Biotech Res Asia 2012;9(1) |
| Copy the following to cite this URL: Potumarthi R, Nagavalli K. R, Jetty A. Kinetic Analysis of Alkaline Protease Production at Different Substrate Concentrations by Bacillus licheniformis - NCIM 2042 in Stirred Tank Reactor. Biosci Biotech Res Asia 2012;9(1). Available from: https://www.biotech-asia.org/?p=9675 |
Introduction
Microbial processes for primary and secondary metabolites production is gaining attention around the globe due to various advantages it presents. However, various biological (1) and physical (2) conditions of the process influences the overall productivity. Alkaline proteases are accounting for 60-65% of market demand among all industrial enzymes (3,4) with two third alone used in detergent industry and increased use in other sectors like textile, tanning etc (5-11). Bacterial proteases processes are gaining importance due to ease in process operation and high yield under optimized conditions when compare with other microbes like yeast and fungus. Bacillus is well known source of bacterial alkaline protease (6, 9-13) and The reason being their higher stability to extreme pH and temperature at industrial level of production (5, 14) although several fungal sources are being increasingly employed (3-5). Currently a large proportion of the commercially available alkaline proteases are derived from Bacillus strains, Production medium composition plays a critical role in the fermentative production of alkaline proteases in particular concentration of limiting substrate has substantial effect on the overall performance of the process and yield (7-18). Although, there have been a number of studies on protease production by Bacillus species, little information on kinetic analysis of the protease production process is available in literature.(14, 19) Bacillus sphaericus kinetics showed both growth and non-growth associated protease production characteristics. (20). Kinetics for β-glucanase production was studied in stirred tank bioreactor after optimizing the culture medium to increase the production (21). Although protease production is an inherent property of all organisms, only those microbes that produce a substantial amount of extracellular protease have been exploited commercially. In our previous studies we have developed a production medium for alkaline protease production from Bacillus licheniformis NCIM-2042 (15, 16) and identified casein as critical compound which has large influence on the yield of alkaline protease production. In our present studies the effect of different levels of initial levels of casein concentration on the protease production in terms of Michelies menton inhibition kinetics were studied.
Materials and methods
Bioreactor operation
From the results of earlier shake flask studies (unpublished) it has been observed that casein was acting as limiting nutrients for the protease production and growth by Bacillus licheniformis. Therefore, the experiments were conducted in batch STR at different casein concentration for protease production using previously optimized agitation and airflow rates based on maximum specific protease production rate i.e., 200 rpm and 3 vvm. The experiments were carried out in a lab scale 7.5-litre bioreactor (Biolfow, NBS, USA) with 5 litre working volume, fixed with two-stage rushton type impeller of 50 mm diameter.
Effect of casein concentration on protease production
Four experiments E1, E2, E3 and E4 were conducted in batch mode, at different initial concentrations of casein in the levels of (g/l) 20, 30, 40 and 50 respectively for the maximum production of protease in STR operation. The 2-day old inoculum grown in 250 ml flask was used as seed to the reactor (10% of the working volume). Each batch was cultivated for 5 days at constant pH of 9.5 and temperature at 35+2oC and during the operation at every 24 hours protease production, carbohydrates, and biomass were estimated and recorded. Simple Monod growth kinetic studies were done in batch STR using casein as limiting substrate.
Kinetic analysis
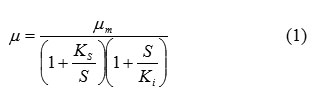
The specific growth rate of the biomass was calculated as a function of the rate of change of substrate consumption at a given substrate concentration. In the present microbial system, the growth rate clearly inhibited at the highest casein concentration. Therefore the growth of a microorganism on an inhibitory substrate can be simply modeled in a batch well stirred tank reactor by the following equation (1).
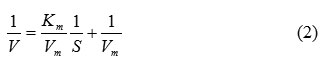
The protease production kinetics at different casein concentrations was calculated by linearizing the Michelis-Menton equation by double reciprocal method as given by equation (2) and calculating the constants by Lineweaver Burke plot.
The equation 4 and 5 were solved and kinetic constants were estimated by using the software SCIENCE, SPSS Inc, Chicago, USA.
Analytical methods
Protease assay
Protease activity was determined by a modified method using casein as substrate. 50 μl of crude protein was added to 450 μl of substrate solution (1% (v/v) casein with 50mM Tris-HCl buffer pH 8.0) and incubated at 30°C for 30 min independently with respective controls. The reaction was stopped by adding 750 μl of 5% TCA mixture (5% TCA, 9% Na- acetate, 9% acetic acid) followed by 30 min incubation at room temperature followed by centrifugation at 10,000 rpm for 15 min. The absorbance of supernatant was measured at 280nm. One unit of enzyme activity was defined as the amount of enzyme, which releases 1 μmol of tyrosine per min under the assay conditions. The amount of tyrosine was determined from the tyrosine standard curve. Carbohydrate estimation: Total carbohydrate content was determined according to the phenol–sulfuric acid method (22). Estimation of biomass: Two milliliter sample was collected in a pre-weighed eppendorf tube and centrifuged at 5000 rpm for 10 min. Supernatant was discarded and the pellet was washed thrice with sterile distilled water, followed by drying the pellets at 950C till constant weight and expressed in DCW (mg/ml).
Results and Discussions
Effect of casein concentration on protease production
From the results of earlier shake flask studies (unpublished) it has been observed that casein was acting as limiting nutrients for the protease production and growth by Bacillus licheniformis. Therefore, the experiments were conducted in batch STR at different casein concentration for protease production using previously optimized agitation and airflow rates based on maximum specific protease production rate i.e., 200 rpm and 3 vvm.
The variations in DCW, carbohydrate utilization and protease production with cultivation time is shown in table 1-4. It is evident that from table 1-4 that during batch STR operation (E1-E4) the trend of carbohydrate utilization, biomass formation (DCW) and protease production is similar with maximum protease production during 72 hours. As the initial carbohydrate concentration in the STR increases, the protease production rate decreases. Maximum production (E3), 330 U/ml, is observed at 36.2 g/l of carbohydrate concentration and a further increase in the carbohydrate concentration of 52.2 g/l inhibited the product formation rate by recording a low protease production of 175 U/ml on 3rd day.
Higher concentration of casein (E4) also inhibited the growth and biomass yields with a low DCW of 5.6 mg/ml on 3rd day, which is very less when compared with E1 where a maximum DCW was observed at 8.2 g/l on 3rd day. Higher concentrations of casein resulted in inhibition on the cell growth, which in turn affected the protease production. The effects of casein concentration on protease production in batch STR could be best studied by calculating the specific product formation rate of protease with respect to DCW, and the yields of biomass and protease with respect to carbohydrates concentration for the entire period operation. The results for all batches (E1-E4) were tabulated in Table 5. From table 5 it is evident that maximum specific product formation rate of protease with respect to DCW was 109.04, U/mg DC, (E1) during 3rd day of operation. But, in the case of E3 and E4, the specific product formation rate of protease was drastically reduced to 48.37 and 42.9 (U/mg DC) respectively during the 3rd day of STR operation. By observing the trend of specific product formation rate of protease, it was evident that the increase in concentration of casein had shown significant effect on protease yields beyond 20 gm/l.
Microbial Growth and protease production kinetics
The values of μm, Ks and Ki using noncompetitive substrate inhibitory growth equation were estimated as shown in figure 1 and the data is depicted in Table 6. The saturation constant (Ks) is the measure of the affinity of the organism for the growth-limiting substrate (i.e. casein). Smaller the Ks value, higher is the substrate affinity and greater is the capacity to grow rapidly at lower growth-limiting substrate concentration. Whereas the Ki is the inhibitory constant and it is a measure of the inhibition offered by higher concentrations of the single substrate in the fermentation process. The Ks value was found to be 23.361 g/l, Ki is 0.2647 g/l and μm is 60.65, hr-1.
Similarly the protease production kinetics was calculated by Michelis Menten equation by linearization and by Lineweaver Burk plot as shown in figure 2. The maximum possible SPF could be estimated by increasing the substrate concentration by solving Michelis Menten equation. The Vm represents the maximum possible protease product formation rate (U/ml.hr) when the casein concentration was varied in the levels of 20, 30, 40 and 50 g/l. A maximum of 3.9619 U/ml.hr protease product formation rate could be achieved as calculated by the Vm value and the data is shown in table 8. The Km value is the saturation constant or Michelis constant of the product formation kinetics, the Km value in the present studies was 2.32E-08.
The residual estimation offers a good fit of the model and the data is shown in Table 7 and Table 9. The pattern of scattering of residual points and standard error of estimation shows the goodness of the fit, that the model used for the estimation of microbial growth and protease product kinetic constants has resulted in less error of prediction in the 95% confidence limits. This residual represents the difference between the observed response variable and the value predicted by the regression line.
Table 1: Effect of casein concentration on protease production (E1).
| Time, hrs | DCW, x, g/l | Carbohydrates (S), mg/l | Protease, (P), U/ml |
| 0 | 1.1 | 19.8 | |
| 24 | 1.5 | 18.4 | 112 |
| 48 | 1.8 | 17.8 | 134 |
| 72 | 3.2 | 14.2 | 250 |
| 96 | 3.5 | 13.8 | 220 |
| 120 | 3.8 | 13.2 | 180 |
Table 2: Effect of casein concentration on protease production (E2)
| Time, hrs | DCW, x, g/l | Carbohydrates (S), mg/l | Protease, (P), U/ml |
| 0 | 1.2 | 31.2 | |
| 24 | 1.7 | 26 | 122 |
| 48 | 2.2 | 24.8 | 158 |
| 72 | 3.8 | 17.4 | 220 |
| 96 | 4 | 16.8 | 185 |
| 120 | 4.1 | 16.4 | 178 |
Table 3: Effect of casein concentration on protease production (E3)
| Time, hrs | DCW, x, g/l | Carbohydrates (S), mg/l | Protease, (P), U/ml |
| 0 | 1.3 | 39.7 | |
| 24 | 2.5 | 35 | 180 |
| 48 | 4.6 | 29 | 210 |
| 72 | 8.2 | 18.4 | 330 |
| 96 | 8.5 | 17.8 | 280 |
| 120 | 8.7 | 17.4 | 245 |
Table 4: Effect of casein concentration on protease production (E4)
| Time, hrs | DCW, x, g/l | Carbohydrates (S), mg/l | Protease, (P), U/ml |
| 0 | 1.2 | 48.9 | |
| 24 | 2.2 | 46 | 108 |
| 48 | 4.1 | 42 | 146 |
| 72 | 5.6 | 34 | 175 |
| 96 | 5.8 | 32 | 156 |
| 120 | 5.9 | 31.4 | 130 |
Table 5: Protease production kinetics: effects of substrate concentration (at the end of 3rd day of bioreactor operation)
| Experiment | Yx/s
mg/gm |
Yp/s
U/gm |
Yp/x U/mg DC |
| E1 | 0.375 | 44 | 109.04 |
| E2 | 0.188 | 15 | 84 |
| E3 | 0.323 | 15 | 48.37 |
| E4 | 0.2953 | 12 | 42.9 |
Table 6: Noncompetitive single substrate inhibitory kinetics
| Kinetic Parameters | Value | ±Std. Error | 95% Conf. Interval |
| µm | 60.65 | 3.00E+05 | -3.81E+06 to 3.81E+06 |
| KS | 23.36 | 1.16E+08 | -1.47E+09 to 1.47E+09 |
| Ki | 0.264 | 1,492.78 | -18,967.01 to 18,967.53 |
Table 7: Noncompetitive single substrate inhibitory kinetics
| Substrate, g/l | Growth rate, mg/l hr | Predicted Growth rate,
mg/l hr |
Max Residual |
| 20 | 0.0444 | 4.87E-02 | -4.29E-03 |
| 30 | 0.0528 | 6.79E-02 | -1.51E-02 |
| 40 | 0.1139 | 8.24E-02 | 3.15E-02 |
| 50 | 0.0778 | 9.23E-02 | -1.45E-02 |
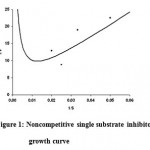 |
Figure 1: Noncompetitive single substrate inhibitory growth curve.
|
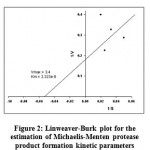 |
Figure 2: Linweaver-Burk plot for the estimation of Michaelis-Menten protease product formation kinetic parameters.
|
Table 8: Linweaver-Burk plot for the estimation of Michaelis-Menten protease product formation kinetic parameters
| Kinetic Parameters | Value | ±Std. Error | 95% Conf. Interval |
| Vmax | 3.36 | 1.50 | -3.0969 to 9.8331 |
| Km | 2.32E-08 | 13.10 | -56.375 to 56.375 |
Table 9: Linweaver-Burk plot for the estimation of Michaelis-Menten protease product formation kinetic parameters
| Substrate, g/l | Protease
production rate, U/ml. hr |
Predicted Protease
production rate, U/ml. hr |
Max Residual |
| 20 | 3.4722 | 3.1636 | 0.1042 |
| 30 | 3.0556 | 3.3645 | -0.3125 |
| 40 | 4.4444 | 3.9619 | 1.0764 |
| 50 | 2.5 | 2.9213 | -0.8681 |
Conclusions
With the variation of initial casein concentration on the levels of 20, 30, 40 and 50 g/l, the protease production pattern was changed respectively at the end of 72 hours of bioreactor operation. As the concentration of limiting substrate increased, the protease production was found to decrease. The Ks value was found to be 23.361 g/l, Ki is 0.2647 g/l and μm is 60.65, hr-1. A maximum of 3.3681 U/ml.hr protease product formation rate could be achieved as calculated by the Vm value. The Km value is the saturation constant or Michaelis constant of the product formation kinetics, the Km value in the present study was 2.32E-08.
Acknowledgements
Authors are thankful to Dr. J.S. Yadav, Director, Indian Institute of Chemical Technology, Hyderabad, India, for his encouragement.
Nomenclature
STR Stirred Tank Reactor
DCW Dry cell weight
Yp/x specific product formation (SPF) of protease with respect to biomass, U/mg DC
Yx/s Yield of biomass with respect to substrate, mg/gm
Yp/s Yield of protease with respect to substrate, U/gm
Ks Saturation constant, g/l
μm Maximum specific growth rate, hr-1
Ki Inhibitory constant, g/l
References
- Himabindu, M., Potumarthi, R., Jetty, A. Enhancement of gentamicin production by mutagenesis and non-nutritional stress conditions in Micromonospora echinospora. Process Biochem., 2007; 42: 1352-6
- Himabindu, M., Potumarthi, R., Jetty, A. Gentamicin production by Micromonospora echinospora (Me‐22) in stirred tank reactor: effect of various parameters. J Basic Microbiol., 2008; 48: 53-8
- Gupta, R., Beg, Q.K., Khan, S., Chauhan, B. An overview on fermentation, downstream processing and properties of microbial alkaline proteases. Appl Microbiol Biotechnol., 2002; 60: 381-95.
- Kumar, C.G., Hiroshi, Takagi, Microbial alkaline proteases: from a bioindustrial viewpoint. Adv., 1999; 17: 561–94.
- Gupta, M.N., and Roy, I. Applied biocatalysis: an overview, Indian J Biochem Biophys., 2002; 39: 220–8.
- Yang, J.K., Shih, I.L., Tzeng, Y.M., Wang, S.L. Production and purification of protease from a Bacillus subtilis that can deproteinize crustacean wastes. Enzyme Microb Technol., 2000; 26: 406-13.
- Samal, B.B., Karan, B., Stabinsky, Y. Stability of two novel serine proteinases in commercial laundry detergent formulations. Biotechnol Bioeng., 1990; 28: 609-12.
- Phadatare, S.U., Deshpande, V.V., Srinvasan, M.C. High activity alkaline protease from Conidiobolus coronatus (NCL 86.8.20): enzyme production and compatibility with commercial detergents. Enzyme Microb Technol., 1993; 15: 72-6.
- Banerjee, U,C., Sani, R.K., Azmi, W., Soni, R. Thermostable alkaline protease from Bacillus brevis and its characterization as a laundry detergent additive. Process Biochem., 1999; 35: 213-9.
- Hameed, A., Keshavarz, T., Evans, C.S. Effect of dissolved oxygen tension and pH on the production of extracellular protease from a new isolate of Bacillus subtilis K2, for use in leather processing. J Chem Technol Biotechnol., 1999; 74: 5-8.
- Varela, H., Ferrari, M.D., Belobradjic, L., Weyrauch, R., Loperena, M.L. Effect of medium composition on the production by a new Bacillus subtilis isolate of protease with promising unhairing activity. World J Microbiol Biotechnol., 1996; 12: 643-5.
- Manachini, P.L., Fortina, M.G. Production in sea-water of thermostable alkaline proteases by a halotolerant strain of Bacillus licheniformis. Biotechnol Lett., 1998; 20: 565-8.
- Beg, Q,K., Saxena, R.K., Gupta, R. De-repression and subsequent induction of protease synthesis by Bacillus mojavensis under fedbatch operations. Process Biochem., 2002; 37: 1103-9.
- Takii, Y., Kuriyama N., Suzuki, Y. Alkaline serine protease production from citric acid by Bacillus alcalophilus sub sp. halodurans KP 1239, Microbiol. Biot., 1990; 34: 57–62.
- Potumarthi, R., Subhakar, Ch., Annapurna, J. Alkaline protease production by submerged fermentation in stirred tank reactor using Bacillus licheniformis NCIM-2042: Effect of aeration and agitation regimes. Biochem Eng J., 2008; 34: 185–92.
- Potumarthi, R., Subhakar, Ch., Pavani, A., Annapurna, J. Evaluation of various parameters of calcium-alginate immobilization method for enhanced alkaline protease production by Bacillus licheniformis NCIM-2042 using statistical methods. Bioresource Technol., 2008; 99: 1776–86.
- Annapurna, J., Subhakar, Ch., Kranthi, K., Potumarthi, R. Cascade operation of stirred tank reactors for alkaline protease production by Bacillus subtilis. Biotech Res Asia, 2006; 3: (2a), 345-50.
- Joo, H.S., Kumar, C.G., Park, G.C., Kim, K.T., Paik, S.R., Chang, C.S. Optimization of the production of an extra cellular alkaline protease from Bacillus horikoshii. Biochem., 2002; 38: 155–9.
- Mao, W., Pan, R., Freedman, D. High production of alkaline protease by Bacillus licheniformis in a fed-batch fermentation using a synthetic medium. Ind. Microbiol., 1992; 11: 1–6.
- Jasvir, S., Vohra, R. M., Sahoo, D. K., Enhanced production of alkaline proteases by Bacillus sphaericus using fed-batch culture. Process Biochem., 2004; 39: 1093-101.
- Usama, B., El-Enshasy, H., Ismail, I. M. K., Hassan, M., Ewa, W., Abd-El-Ghany, S. β-Glucanase production from genetically modified recombinant Escherichia coli: Effect of growth substrates and development of a culture medium in shake flasks and stirred tank bioreactor. Process Biochem., 2003; 39: 307-13.
- Dubois, M. Colorimetric method for determination of sugars and related substances. Chem., 1956; 28: 350–6.

This work is licensed under a Creative Commons Attribution 4.0 International License.


