

Manuscript accepted on : 25 January 2012
Published online on: --
M. H. Asadi1, M. Sayyah2 and M. Rajabi3
1Deparment of Baghiyatollah(a.s.) University of Medical Sciences.
2Department of Anatomical Sciences Research Center, Kashan University of Medical Sciences, Kashan, Iran.
3Deparment of anesthesiology Group, Kashan University of Medical Sciences, Kashan, Iran.
Corresponding Author E-mail: mansorsayyah@gmail.com
ABSTRACT: Anthropometric measures such as height, weight, and body composition have long been indispensable measures used to assess the health of general population in medicine and fitness in sport sciences. The purpose of this descriptive study was to compare the mean values of height, weight, and BMI of different age groups male student athletes participating in the Ministry of Health and Medical Education Competition. In this descriptive cross sectional study, a total of 840 young male student athletes competing in the Ministry of Health and Medical Education Competition voluntarily participated. The data were collected at the competition sites by using a Seca scale equipped with adjustable height bar made in Germany. All the statistical analysis was performed by SPSS:PC version 12.0. The results of the study showed that the means for age, weight, height, and BMI were 23.72±3.51yr, 69.16±9.43kg, 175.72±6.62cm and 22.38±2.59kgm2, respectively. The results of ANOVA test showed a significant increase in the BMI and weight of male athletes (p<0.05). However no such increase was present for the height variable. It was concluded that BMI and weight of the male athlete students increases significantly by the increase in age.
KEYWORDS: Athletes; Anthropometry; BMI; Competition
Download this article as:| Copy the following to cite this article: Asadi M. H, Sayyah M, Rajabi M. Comparing Age Groups Anthropometric Measures of Young Male Student Athletes Participating in the Ministry of Health and Medical Education Competetions. Biosci Biotech Res Asia 2012;9(1) |
| Copy the following to cite this URL: Asadi M. H, Sayyah M, Rajabi M. Comparing Age Groups Anthropometric Measures of Young Male Student Athletes Participating in the Ministry of Health and Medical Education Competetions. Biosci Biotech Res Asia 2012;9(1). Available from: https://www.biotech-asia.org/?p=9524 |
Introduction
One of the subjects of interest for the specialists in health, medicine and sports sciences is the changing anthropometric characteristics of the individuals as they grow older. While the formers scrutinize the change for the health purposes, the later are interested to closely monitor the changes as they may be associated with sport performance in the field of competitions. Measuring anthropometric characteristics of athletes is an important index for evaluating their physical fitness (1). Weight and height are two important factors that are commonly used in identifying underweight, overweight, and obesity. The changes in body mass index and other characteristics of the athletes are the subject of some studies (2). While some researchers are interested in physical fitness of the athletes (3), others focus on the body weight control or injuries (4, 5). Goodpaster (1997) regards BMI=19.06 as a criterion for masculinity and the ratio of 40 and above as an index of excessive obesity (6). Jett (1993) identified BMI within the range 27-29.9 as overweight and above this range as obese (7). Lee (1997) claimed that BMI can be successfully used to predict VO2 max which is a very reliable estimate of cardiovascular fitness (8). Lukhanen (1992) demonstrated that there was a significant relation between VO2 max and BMI in certain age groups (9). Sayyah and associates (2011) conducted a research examining the relationship between the anthropometric characteristics of female athletes and the frequency of injury in the competitions of female athletes. The results of this research showed a significant difference between the mean value of BMI of the injured and non-injured athletes (10). Huang reported that BMI significantly and differentially influenced individual fitness tests, but effects varied with age and sex. Higher BMIs were generally associated with lower fitness (11). Katya and associates (2010) showed that youth BMI was positively associated with general health (12). Considering the significance of Body Mass Index in health and fitness, this study was designed for two purposes: first to determine the anthropometric index of male student athlete participating in sport Olympiad of the Ministry of Health and Medical Education; second, to determine whether significant change occur in anthropometric indices such as weight and height since they are the important variable that determine BMI, an important index that under certain circumstances is considered as a risk factors for health.
Methods and materials
Data were collected during the two weeks of competitions. Seca model scales made in Germany equipped with adjustable height bar were employed to measure the height and weight of athletes. The measurements were conducted during the events by referring to the arena or by transferring the scales to the residential place where the athletes were residing during the events. Prior to participating in the measurement, every athlete was asked to complete a question form containing demographic data such as age, name, and other information and then take his shoes and warm-up suit off. Then, he was asked to step on the surface of the scale face up to the researcher in such a way that his back was straight and parallel to the height bar. At this point, the researcher adjusted the height bar to the top of the head of the subject that was in full standing position. The reading from the height bar was recorded as the height of the subject for measuring the weight, the weight gauge indicating the weight of the subject was recorded as the weight of the subject. Following the completion of the data collection, statistical analysis was performed on data using SPSS 12.0. The variable of Body Mass Index was calculated by the formula:
W (kg)/ H squared (m)
Results
A total of 840 male athlete students from different medical universities participated in this project. The results of analysis are presented in table 1 to 3. The results showed that the means for age, weight, height, and BMI were 23.72±3.51yr, 69.16±9.43kg, 175.72±6.62cm and 22.38±2.59kgm2, respectively. Kolmogrove-smirinov test confirmed the normality of the variables; therefore, parametric statistical procedure was applied to analyze the data. The results of ANOVA test showed that there was a significant increase in mean values of BMI and weight of the athletes (p<0.05). However no such increase was present for the height variable. Scheffe post hoc test showed that the significant difference was present between the BMI of the age group 18, 19, 20, 21, and 22 compared to the age groups 23 and higher ( p<0.05). No significant differences was found between the BMI of the age group 18, 19, 20, 21, and 22 (p>0.05). Similar results were found for the weight of the subjects. That is, significant difference was present between the weight of the age group 18, 19, 20, 21, and 22 compared to the age groups 23 and higher ( p<0.05). No significant differences was found between the weight of the age group 18, 19, 20, 21, and 22 (p>0.05). However, no significant differences was found between the height of the age groups (p>0.05). Pearson correlation coefficient was used to test the association between weight, height and age (table 4). The association between the weight and age; weight and height were significant (P<0.05).
Table 1 : Comparing the Body Mass Index of the athletes according to age.
| Age(year) | Frequency | Mean | Std. Deviation | Minimum | Maximum |
| 18 | 7 | 20.40 | 2.654 | 17 | 26 |
| 19 | 39 | 21.36 | 2.208 | 18 | 26 |
| 20 | 92 | 21.61 | 2.592 | 16 | 31 |
| 21 | 119 | 21.98 | 2.506 | 18 | 31 |
| 22 | 121 | 22.11 | 2.199 | 17 | 30 |
| 23 | 112 | 22.42 | 2.487 | 18 | 31 |
| 24 | 65 | 22.28 | 2.244 | 18 | 28 |
| 25 | 67 | 22.63 | 1.980 | 18 | 27 |
| 26 | 48 | 22.75 | 2.731 | 16 | 31 |
| Over 26 | 170 | 23.74 | 2.820 | 18 | 31 |
| Total | 840 | 22.38 | 2.598 | 16 | 31 |
Table 2 : Comparing the weight of the athletes according to age
| Age(year) | Frequency | Mean | Std. Deviation | Minimum | Maximum |
| 18 | 7 | 62.714 | 6.7753 | 53.0 | 75.0 |
| 19 | 39 | 67.423 | 9.1842 | 51.0 | 86.0 |
| 20 | 92 | 66.897 | 9.3137 | 51.0 | 99.5 |
| 21 | 119 | 67.992 | 8.7248 | 47.5 | 97.0 |
| 22 | 121 | 65.967 | 7.6767 | 48.0 | 95.0 |
| 23 | 112 | 69.527 | 10.1571 | 50.0 | 99.5 |
| 24 | 65 | 68.500 | 8.8724 | 51.0 | 97.0 |
| 25 | 67 | 69.940 | 9.0309 | 50.0 | 93.0 |
| 26 | 48 | 70.071 | 9.4041 | 46.0 | 99.5 |
| Over 26 | 170 | 73.594 | 9.5541 | 53.0 | 99.5 |
| Total | 840 | 69.163 | 9.4312 | 46.0 | 99.5 |
Table 3 : Comparing the height of the athletes according to age.
| Age(year) | Frequency | Mean | Std. Deviation | Std. Error | Minimum | Maximum |
| 18 | 7 | 175.57 | 4.721 | 1.784 | 171 | 183 |
| 19 | 39 | 174.69 | 6.838 | 1.095 | 164 | 193 |
| 20 | 92 | 175.89 | 6.899 | .719 | 164 | 198 |
| 21 | 119 | 175.85 | 6.579 | .603 | 160 | 192 |
| 22 | 121 | 175.83 | 6.409 | .583 | 158 | 194 |
| 23 | 112 | 175.18 | 6.326 | .598 | 158 | 194 |
| 24 | 65 | 175.59 | 5.445 | .675 | 165 | 186 |
| 25 | 67 | 175.70 | 7.883 | .963 | 155 | 189 |
| 26 | 48 | 176.07 | 6.620 | .955 | 160 | 189 |
| Over 26 | 170 | 177.44 | 6.764 | .519 | 159 | 198 |
| Total | 840 | 175.72 | 6.623 | .229 | 155 | 198 |
Table 4: One-way Analysis of variance comparing BMI, weight and height of the athletes.
| Sources of variatios | Sum of Squares | df | Mean Square | F | Sig. | |
| bmi | Between Groups | 541.330 | 9 | 60.148 | 9.747 | .000 |
| Within Groups | 5121.991 | 830 | 6.171 | |||
| Total | 5663.321 | 839 | ||||
| Wt* | Between Groups | 5743.181 | 9 | 638.131 | 7.688 | .000 |
| Within Groups | 68972.501 | 831 | 82.999 | |||
| Total | 74715.683 | 840 | ||||
| Ht* | Between Groups | 290.503 | 9 | 32.278 | .734 | .678 |
| Within Groups | 36510.907 | 830 | 43.989 | |||
| Total | 36801.410 | 839 |
*wt stands for weight
*ht stands for height
Table 5: Correlation matrix of weight, height, age. and BMI of athlete students.
| Variables | Age | Weight | Height | BMI |
| Age | 1 | 0.24 | 0.10 | 0.30 |
| Weight | 1 | 0.49 | 0.79 | |
| Height | 1 | -0.40 | ||
| BMI | 1 |
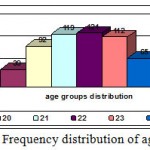 |
Figure 1: Frequency distribution of age groups.
|
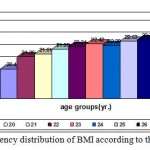 |
Figure 2: Frequency distribution of BMI according to the age groups.
|
Results and Conclusion
In this research, the anthropometric indices of the male athletes were examined. The results of analysis showed that the BMI and weight of the athletes did increase from age 18 onward. This increase was not statistically significant up to the age 23. However, after this age, the increase was statistically significant. Similar findings were observed when analyzing the weight. Such parity of increase is predictable since BMI is the function of weight and height. The size of height reaches its peak during these years and insignificant changes may occur after the age 18 as it was observed in this research. Many researchers have presented height and weight changes in their attempt to show the changes in height and weight, thus examining the the association between these variables and physical activities (16).
The increases in BMI beyond 25 may be an indication of loss of physical fitness and is regarded as a health risk factor. Numerous studies have assessed body mass index in order to evaluate the health condition of individuals (12-15). These studies demonstrate that body mass index is an important factor to judge the likelihood of success as well as injury in athletes ( 13, 15 ).
The relationship between the BMI and weight permits the alteration of BMI to an ideal level to avoid the chance of injury to lesser degree and get in better shape to participate in sport competitions. By participation in various forms of physical activity, it is possible to reduce weight and BMI quantity. The student athletes in this research showed an increasing trend in their BMI value approaching the border beyond which they may be considered as overweight and face a health risk factor. Therefore, based on the results of this research, it is suggested the coaches and individuals in charge of preparing the student athletes for competitions to monitor the weight of their athletes prior to the start of competitions.
References
- Benedettini, MM (Benedettini, MM) , Analysis of the body mass index (BMI) in athletes over age 18 examined at the Sports Medicine Services of the Republic of San Marino in a 1-year period , MEDICINA DELLO SPORT V: 58. 1: 29-35 : MAR 2005.
- Fujii, Katsunori, Demura, Shinichi, Relationship between change in BMI with age and delayed menarche in female athletes. Journal of Physiological Anthropology and Applied Human Science,V: 22: 2 P: 97-104 March 2003
- Watson AW: “Physical and fitness characteristics of successful gaelic footballers. British Journal of sport Medicine. 1995, Dec. 29(4): 229-31.
- Smith N J: “Weight control in athlete” Clinics- in- Sports- medicine- Philadelphia 3(3) July 1985, 93-7.
- Yard E, Comstock D, Injury patterns by body mass index in US high school athletes. J Phys Act Health, 2011 Feb; Vol. 8 (2), pp. 182-91
- Goodpaster HBI, Thaete FLI, Simoneau JA: Subcutaneous abdominal fat and thigh muscle. Composition predicting Insulin sensitivity Independent of Visceral Fat. “Diabetes. 1997. Oct. 46 1579-85.
- Jette M, Sidny K, Lewis W: Fitness, performance, and anthropometric characteristics of 169185 Canadian forces personnel classified according to body mass index”. Military medicine.
- Lee Ag, Meyees JI, Cearry WM: Influence of players physique and football injuries. British Journal of sports Medicine. 1997. June 31(2): 135-8.
- Laukkanen R, Oja-P: Validity of a two kilometer walking test for estimating maximal aerobic power in overweight adults. International Journal of obesity. 1992 Apr, I, 16(4), 263-8.
- Sayyah, M, Rahimi, M, Bigdeli, M, and Rajabi, M. Comparing the Anthropometric Characteristics of Injured and Non-Injured Girl Student Athletes Participating in the Sport Olympiads Held by the Ministry of Health and Medical Education in the Summer of 2009 in the City of Yazd Biosciences, Biotechnology Research Asia Vol. 8(2), 367-372 (2011)
- Huang YC, Malina RM, BMI and health-related physical fitness in Taiwanese youth 9-18 years. Med Sci Sports Exerc. 2007 Apr;39(4):701-8.
- Katya M. Herman • Wilma M. Hopman • Cora L. Craig Are youth BMI and physical activity associated with better or worse than expected health-related quality of life in adulthood? Qual Life Res (2010) 19:339–349
- Bowers AL, Spindler KP, McCarty EC, Arrigain S. Height, weight, and BMI predict intra-articular injuries observed during ACL reconstruction: evaluation of 456 cases from a prospective ACL database. Clin J Sport Med. 2005 Jan;15(1):9-13.
- Beets MW, Pitetti KH. One-mile run/walk and body mass index of an ethnically diverse sample of youth. Med Sci Sports Exerc. 2004 Oct;36(10):1796-803.
- Astorino TA, Tam PA, Rietschel JC, Johnson SM, Freedman TP. Changes in physical fitness parameters during a competitive field hockey season. J Strength Cond Res. 2004 Nov;18(4):850-4.
- Dickerson JB, Smith ML, Benden ME, Ory MG. The association of physical activity, sedentary behaviors, and body mass index classification in a cross-sectional analysis: are the effects homogenous? BMC Public Health. 2011 Dec 14;11(1):926.
- Hemmingsson E, Ekelund U. Is the association between physical activity and body mass index obesity dependent? Int J Obes (Lond). 2007 Apr;31(4):663-8.

This work is licensed under a Creative Commons Attribution 4.0 International License.


