

Manuscript accepted on : 30 October 2011
Published online on: 28-12-2011
Afaf I. Shehata2, A. A. Al-Aidan3, B. Al-Shahrani2, N. A. Al-Harbi1,2 and Sulamain Ali Alharbi2
1Addiriyah Chair for Environmental Studies,College of Science, King Saud University, P.O. Box 2455, Riyadh 11451 Saudi Arabia.
2Department of Botany and Microbiology, College of Science, King Saud University, P.O. Box 2455, Riyadh 11451 Saudi Arabia.
3Molecular Virology and Infectious Disease Laboratory, Research, Centre, King Faisal Specialist Hospital and Research Centre Saudi Arabia.
ABSTRACT: Eighty-one clinical Acinetobacter baumannii isolates were included in this study collected from year 2001 to 2006. The strains were originally isolated from different clinical and environmental specimens by the Microbiology Laboratory of the King Faisal Specialist Hospital and Research Centre, Riyadh, Saudi Arabia. They were preserved in tryptic soy broth (TSB) supplemented with 20% (vol/vol) glycerol. Pure isolates were stored at -80OC until used in the Research Centre, KFSH&RC. For ARDRA genomic typing, the 16S rRNA gene of each of the 81 Acinetobacter baumannii strains was amplified and restricted with the restriction enzymes Alu I, Mbo I and Msp I. Each enzyme generated 3-7 bands per strain, analyzed visually by comparing the differences in the banding patterns generated and grouped the isolates into Strain A to G, while isolates that are untypeable or undetermined were group into Strain H. ARDRA could not accurately distinguish the 81 different Acinetobacter baumannii strains using three restriction enzymes, indicating low discriminatory power for the method.
KEYWORDS: Acinetobacter Baumannii; Hospital patients; Amplified Ribosomal DNA
Download this article as:| Copy the following to cite this article: Shehata A. I, Al-Aidan A. A, Al-Shahrani B, Al-Harbi N. A, Alharbi S. A. Typing of Acinetobacter Baumannii Strains isolated from Hospital Patients by Amplified Ribosomal DNA Restriction Analysis (ARDRA). Biosci Biotech Res Asia 2011;8(2) |
| Copy the following to cite this URL: Shehata A. I, Al-Aidan A. A, Al-Shahrani B, Al-Harbi N. A, Alharbi S. A. Typing of Acinetobacter Baumannii Strains isolated from Hospital Patients by Amplified Ribosomal DNA Restriction Analysis (ARDRA). Biosci Biotech Res Asia 2011;8(2). Available from: https://www.biotech-asia.org/?p=9274/ |
Introduction
Bacteria of the genus Acinetobacter are increasingly being implicated in numerous outbreaks and have become a growing concern in hospitals, identifying Acinetobacter baumannii as the most predominant species involved. Acinetobacter spp. can cause a wide range of clinical conditions, including pneumonia, septicemia, urinary tract infections, wound infections, endocarditis, and meningitis. Contaminated hospital equipment or colonized hands of hospital staff have previously been identified as reservoirs of this organism in epidemics. Resistance to multiple antibiotics is a frequent finding with this organism (Karlowsky, et al., 2003; Paton et al., 1993; Lyytikainen et al., 1995; Van Looveren et al., 2004). Risk factors for acquisition of this organism include prolonged hospital stay, serious underlying disease, intravascular and intravesical catherization, and treatment with broad – spectrum antibiotics. Characteristics of Acinetobacter spp. may contribute to their epidemic behavior, such as the ability to acquire multiple antibiotic resistance and the ability to survive on inanimate and dry surfaces for prolonged periods of time. However, it should be noted that Acinetobacters are ubiquitous organisms that can also be isolated readily from non clinical sources such as soil, drinking and surface waters, sewage, and a variety of different foodstuffs (Glew et al., 1977; Joly – Guillou et al., 1992) In many cases, the true source of infection cannot be traced, because members of the genus Acinetobacter are widespread in the hospital environment and can be isolated from sinks, tap water, and dust or can be present as commensal organisms of human skin and respiratory tract (Mandell et al., 2000; Seifert et al., 1993; Trouillet et al., 1995). In order to understand the epidemiology of Acinetobacter spp., in hospitalized patients and in the hospital environment, it is therefore vital that the organism be identified to the genomic species level and then typed before epidemiological conclusions are drawn.
Typing methods are important tools for establishing the sources and modes of transmission for epidemic strains. No single typing system has so far gained acceptance for typing Acinetobacter spp., and this area is still the subject of research. The past 20 years have seen significant advances in the ability of the clinical microbiologist to identify substrains of bacterial pathogens and use this information to track infectious diseases. Medical diagnostic evaluations for a particular infectious disease usually end with identification of pathogens to their species; most clinical microbiology laboratories do not routinely identify organisms to the substrain level (Bergogne-Berezin and Towner, 1996). Strain typing is used to determine how close isolates of the same species are related to one another (Andrews, 1986; Bergogne-Berezin and Towner, 1996). When isolates from different patients are related or identical to one another, it may indicate a common source of the infection. This information is useful for epidemiologists who are responsible for tracking communicable diseases within a health care institution or a community (Karlowsky et al., 2003; Mandell et al., 2000). Such information helps them to identify point sources and transmission patterns of infections so that appropriate interventions may be applied. Likewise, when isolates are found differ by subspecies analysis, it suggests a different source of infection. Hence, if two people are diagnosed with tuberculosis in the same community at the same time, differences by strain typing indicate that the individuals are highly unlikely to have passed the infection between them. In short, the goal of strain typing is to distinguish epidemiologically related isolates from those which are unrelated, based on the premise that related isolates share detectable characteristics that will distinguish them from others. Established criteria for evaluation of typing systems include Typability, reproducibility, ease of both interpretation and performance. As with other kinds of epidemiological investigations, control strains known to be unlinked epidemiologically must be included in a subtyping analysis. The ability of a typing method to distinguish epidemiologically related isolates from epidemiologically unrelated isolates is termed “discriminatory power” (Karlowsky et al., 2003).
Strain typing techniques are now used for other clinical applications as well. To determine if isolates of the same genus and species cultured from a patient weeks or months apart represent reinfection with a new strain or recrudescence of a previous infection, they might be typed by a molecular methods (Bergogne-Berezin and Towner, 1996; Gallego and Towner, 2001; Koeleman et al., 1998; Kuo et al., 2004)
The objective of this study was undertaken to elucidate the molecular epidemiology of Acinetobacter baumannii using the most widely applicable DNA – based typing methods namely, Amplified rDNA Restriction Analysis (ARDRA)
Material and Methods
Sample collection
A total of 84 Acinetobacter isolates were investigated in this study. Bacterial strains tested were obtained from the Microbiology Laboratory of the King Faisal Specialist Hospital and Research Centre (Riyadh, Saudi Arabia), collected from year 2001 till 2006. The strains were originally isolated from different clinical and environmental specimens, e.g., blood, cerebrospinal fluid, sputum, tracheal aspirate, urine and wound. They were preserved in tryptic soy broth (TSB) supplemented with 20% (vol/vol) glycerol. Pure isolates were stored at -800C until used in the Research Centre, KFSH&RC.
Confirmation of bacterial identification
Samples were already identified as Acinetobacter sp. in Microbiology Laboratory, Department of Pathology and Laboratory Medicine, King Faisal Specialist Hospital & Research Centre. Frozen bacterial suspension was streaked in Tryptic Soy agar (TSA) and incubated overnight at 370C [TSA was prepared by dissolving 30grams of Tryptic Soy broth (TSB) (Cat. No. 211825; Becton, Dickinson and Company, MD, USA) powder in 1 liter of water; autoclaved for 15 – 20 minutes and allowed to cool for 15 – 30 minutes in 500C water bath; 25ml were transferred to a 90mm Petri dish (Cat. No. 08-757-100D; Fisher Scientific Co., USA) and allowed to solidify]. A single bacterial colony was grown overnight in 5ml TSB with two different temperatures (1) 370C and (2) 440C shaker incubator. To confirm bacterial specie, 2 drops of bacterial broth that were grown overnight at 440C were added to 5ml of fresh TSB and incubated once again overnight at 440C in a shaker incubator. Only Acinetobacter baumannii grows at 440C after consecutive incubation.
For Gram’s staining, reagents and gram stain kit were used from BD were used (Cat. No. 8820191; Becton, Dickinson and Company, MD, USA). Colonies from an 18 – 24 hour culture were fixed on the slide by passing the slide through a low flame 2 – 3 times. Cool the slide to room temperature before staining. Flood the smear with primary stain (Gram Crystal Violet) and stain for 1 minute. Remove the primary stain by gently washing with cold tap water. Flood the slide with mordant (Gram Iodine) and retain on the slide for 1 minute. Remove the mordant by gently washing with tap water. Decolorize with Gram decolorizer [25% acetone (Cat. No. A949 – 1; Fisher Scientific, USA) and 75% isopropanol] until solvent running from the slide is colorless (30 – 60 seconds). Wash the slide gently in cold tap water. Flood the slide with counterstain (Gram Safranin) and stain for 1 minute. Wash the slide with cold tap water. Blot with blotting paper or paper towel or allow to air dry. Stained specimens were examined under an oil immersion lens.
DNA Extraction
Two methods have been carried out to check which will give a better amplifiable DNA. First, using the classical Proteinase K treatment and the second method using a commercial kit, GenomicPrep Cells and Tissue DNA Isolation Kit (Catalog No. 27 – 5237 – 01; Amersham Biosciences, USA).
DNA extraction using commercially available kit – GenomicPrep Cells and Tissue DNA Isolation Kit
Streak bacterial suspension in tryptic soy agar (TSA) and incubate overnight at 370C. Tryptic soy broth (TSB) was made for further subculturing by taking a single colony from the TSA plate and inoculating the colony in 1ml of TSB to 1.5ml microcentrifuge tubes. The inoculated TSB was placed overnight at 370C shaker incubator. Centrifugation was performed for 5 minutes at 13,000 rpm at room temperature. The supernatant was decanted and the pellet was collected; and extracted using the commercially available GenomicPrep Cells and Tissue DNA Isolation Kit (Amersham Biosciences, USA; Catalog No. 27 – 5237 – 01). Add 600ml of cell lysis solution and gently pipet up and down until the cells are suspended (samples are stable in cell lysis solution for at least 18 months at room temperature). Incubate the sample at 800C for 5 minutes to lyse the cells and allowed to cool at room temperature.
For RNase treatment, 3ml of RNase A solution (4 mg/ml) was added to the cell lysate. Mix the sample by inverting the tube 25 times and incubate at 370C for 15 – 60 minutes.
For protein precipitation, samples should allow to cool at room temperature. Add 200ml of protein precipitation solution to the RNase A-treated cell lysate. Vortex samples vigorously at high speed for 20 seconds to mix the protein precipitation solution uniformly with the cell lysate. Centrifuge at 13,000 – 16,000 ´ g for 3minutes. The precipitated proteins will form a tight
pellet [Note: If pellet is not visible or tight: The sample was not cooled sufficiently (< 210C) prior to adding the protein precipitation solution. Cool the sample to room temperature (or below). Vortex for 20 seconds to mix the sample, then incubate on ice for 5 minutes to chill the sample. Centrifuge at 13,000 – 16,000 ´ g for 3 minutes to pellet the precipitated protein. Or the protein precipitation solution was not thoroughly mixed with the cell lysate. Vortex or mix vigorously for the specified time].
For DNA precipitation, pour the supernatant containing the DNA into a clean 1.5ml tube containing 600ml of 100% isopropanol (Cat. No. I9516; Sigma Chemical Co., St. Louis, MO, USA) and discard the tube containing the precipitated protein pellet. Mix the sample by inverting gently 50 times until the white threads of DNA form a visible clump. Centrifuge at 13,000 – 16,000 ´ g for 1 minute; the DNA will be visible as a small white pellet. Pour off the supernatant and drain the tube on clean absorbent paper. Add 600ml of 70% ethanol (Cat. No. 437433T; VWR International, England) without dislodging the DNA pellet. Drain the tube on clean absorbent paper and allow the sample to air-dry 10-15 minutes.
For DNA hydration, add 100ml of DNA hydration solution to the DNA pellet (100ml will give a concentration of 500mg/ml if the total yield is 50mg DNA). Allow the DNA to rehydrate overnight at room temperature; alternatively, heat at 650C for 1 hour. Tap the tube periodically to aid in dispersing the DNA. Store at -800C until use.
Amplified Ribosomal DNA Restriction Analysis (ARDRA)
Same DNA template used for RAPD analysis (extracted using GenomicPrep Cells and Tissue DNA Isolation Kit) was used to perform ARDRA. Amplification reactions were performed in a final volume of 50 µl containing 1.25 units of Taq polymerase (Cat. No. N808 – 0152; Applied Biosystems, CA, USA), 100 µM (each) deoxynucleoside triphosphates (dNTPs) (Cat. No. 27 – 2094 – 01; Amersham Biosciences, NJ, USA), 0.2 µM of each primer, PCR buffer (10 mM Tris – HCl [pH 8.3], 50 mM KCl, 2.5 mM MgCl2, 0.001% gelatin) (Cat. No. N808 – 0129; Applied Biosystems, CA, USA), and 10 ng of template DNA. After initial denaturation at 950C for 5 minutes, the reaction mixture was run through 35 cycles of denaturation at 950C for 45 seconds, annealing at 620C, and extension at 720C for 1 minute followed by a 7 minute extension period at 720C. The primers used were 5’ TGGCTCAGATTGAACGCTGGCGGC (5’ end of 16S rRNA) and 5’ TACCTTGTTACGACTTCACCCCA (3’ end of 16S rRNA) (Rossau et al., 1991). 18 µl of amplified product was mixed with 2 ml loading dye and loaded into the wells of 1% agarose gel and run at 120V in 0.5X TBE buffer. The negative control contained all components except template DNA. Amplified products of 1500 bp were visualized by agarose gel electrophoresis after staining with ethidium bromide (1 µg/ml).
Restriction Analysis
Amplified DNA (16 µl) was digested overnight at 37OC in a 20 µl reaction volume containing 10 units of restriction enzyme: Alu I (AGCT) (Cat. No. R0137L; New England Biolabs, USA), Mbo I (GATC) (Cat No. R0147S; New England Biolabs, USA) and Msp I (CCGG) (Cat. No. R0106L; New England Biolabs, USA) in appropriate restriction enzyme buffer. Restriction digestion was stopped by addition of 2 µl of 5X loading dye. Restriction fragment patterns were separated by agarose gel electrophoresis at 120V in 1X tris – borate – EDTA (TBE) buffer and visualized after being stained with ethidium bromide (1 µg/ml). Gels were photographed under UV illumination.
Results
ARDRA Analysis
The 16S rRNA gene of each of the 81 Acinetobacter strains was amplified and restricted with the Alu I, Mbo I and Msp I.
Figure 1 to 27 show fragments after digestion with Alu I (Source: an E. coli strain that carries the cloned Alu I gene from Arthrobacter luteus ATCC 21606) and yielded 4 groups (see Table 3). Wherein the Strain A is the biggest in the group comprising of 71 isolates (samples number 1, 3, 4, 5, 6, 7, 8, 9, 10, 12, 14, 15, 16, 17, 18, 19, 20, 21, 22, 24, 25, 26, 27, 28, 29, 31, 32, 33, 34, 35, 36, 37, 38, 39, 41, 42, 44, 45, 47, 48, 52, 53, 55, 56, 57, 58, 59, 60, 61, 62, 63, 64, 65, 66, 68, 69, 70, 71, 72, 73, 74, 75, 76, 77, 78, 79, 80, 81, 82, 83 and 84). Isolates number 2, 11, 13, 46, 51, 54 and 67 were grouped into Strain B. Strain C is represented by sample number 30. Two samples were undetermined or untypeable – 49 and 50.
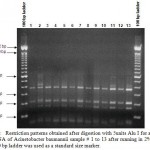 |
Figure 1: Restriction patterns obtained after digestion with 5units Alu I for amplified 16S rDNA of Acinetobacter baumannii sample # 1 to 13 after running in 2% agarose gel. 100 bp ladder was used as a standard size marker. |
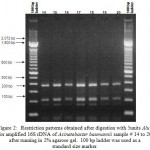 |
Figure 2: Restriction patterns obtained after digestion with 5units Alu I for amplified 16S rDNA of Acinetobacter baumannii sample # 14 to 20 after running in 2% agarose gel. 100 bp ladder was used as a standard size marker. |
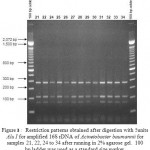 |
Figure 3:Restriction patterns obtained after digestion with 5units Alu I for amplified 16S rDNA of Acinetobacter baumannii for samples 21, 22, 24 to 34 after running in 2% agarose gel. 100 bp ladder was used as a standard size marker. |
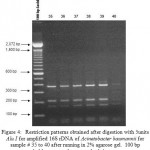 |
Figure 4: Restriction patterns obtained after digestion with 5units Alu I for amplified 16S rDNA of Acinetobacter baumannii for sample # 35 to 40 after running in 2% agarose gel. 100 bp ladder was used as a standard size ma |
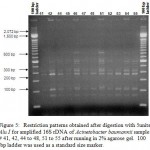 |
Figure 5: Restriction patterns obtained after digestion with 5units Alu I for amplified 16S rDNA of Acinetobacter baumannii sample # 41, 42, 44 to 48, 51 to 55 after running in 2% agarose gel. 100 bp ladder was used as a standard size marker |
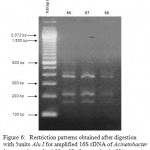 |
Figure 6: Restriction patterns obtained after digestion with 5units Alu I for amplified 16S rDNA of Acinetobacter baumannii sample # 56 to 58 after running in 2% agarose gel. 100 bp ladder was used as a standard size marker. |
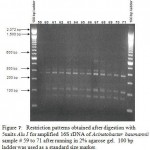 |
Figure 7: Restriction patterns obtained after digestion with 5units Alu I for amplified 16S rDNA of Acinetobacter baumannii sample # 59 to 71 after running in 2% agarose gel. 100 bp ladder was used as a standard size marker. |
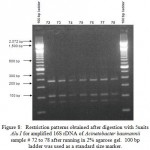 |
Figure 8: Restriction patterns obtained after digestion with 5units Alu I for amplified 16S rDNA of Acinetobacter baumannii sample # 72 to 78 after running in 2% agarose gel. 100 bp ladder was used as a standard size marker. |
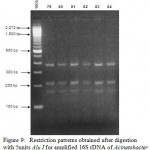 |
Figure 9: Restriction patterns obtained after digestion with 5units Alu I for amplified 16S rDNA of Acinetobacter baumannii sample # 79 to 84 after running in 2% agarose gel. 100 bp ladder was used as a standard size marker |
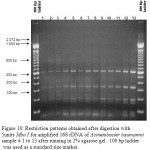 |
Figure 10: Restriction patterns obtained after digestion with 5units Mbo I for amplified 16S rDNA of Acinetobacter baumannii sample # 1 to 13 after running in 2% agarose gel. 100 bp ladder was used as a standard size marker.
Click here to View figure |
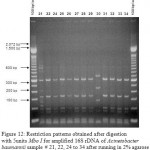 |
Figure 11: Restriction patterns obtained after digestion with 5units Mbo I for amplified 16S rDNA of Acinetobacter baumannii sample # 14 to 20 after running in 2% agarose gel. 100 bp ladder was used as a standard size marker. |
 |
Figure 12: Restriction patterns obtained after digestion with 5units Mbo I for amplified 16S rDNA of Acinetobacter baumannii sample # 21, 22, 24 to 34 after running in 2% agarose gel. 100 bp ladder was used as a standard size marker. |
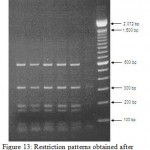 |
Figure 13: Restriction patterns obtained after digestion with 5units Mbo I for amplified 16S rDNA of Acinetobacter baumannii sample # 35 to 40 after running in 2% agarose gel. 100 bp ladder was used as a standard size marker. |
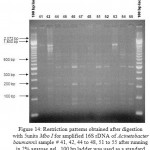 |
Figure 14: Restriction patterns obtained after digestion with 5units Mbo I for amplified 16S rDNA of Acinetobacter baumannii sample # 41, 42, 44 to 48, 51 to 55 after running in 2% agarose gel. 100 bp ladder was used as a standard size marker. |
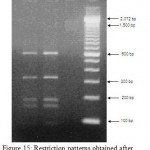 |
Figure 15: Restriction patterns obtained after digestion with 5units Mbo I for amplified 16S rDNA of Acinetobacter baumannii sample # 56 to 58 after running in 2% agarose gel. 100 bp ladder was used as a standard size marker. |
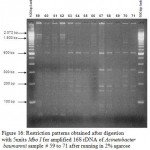 |
Figure 16: Restriction patterns obtained after digestion with 5units Mbo I for amplified 16S rDNA of Acinetobacter baumannii sample # 59 to 71 after running in 2% agarose gel. 100 bp ladder was used as a standard size marker.
|
 |
Figure 17: Restriction patterns obtained after digestion with 5units Mbo I for amplified 16S rDNA of Acinetobacter baumannii samples 72 to 78 after running in 2% agarose gel. 100 bp ladder was used as a standard |
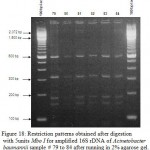 |
Figure 18: Restriction patterns obtained after digestion with 5units Mbo I for amplified 16S rDNA of Acinetobacter baumannii sample # 79 to 84 after running in 2% agarose gel. 100 bp ladder was used as a standard size marker. |
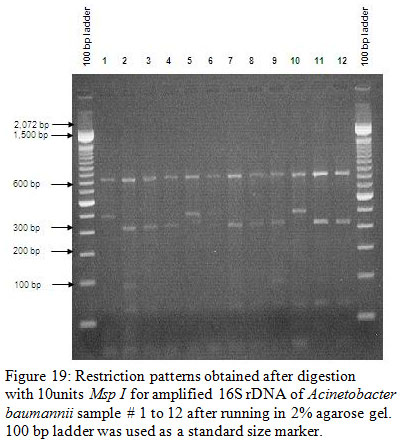 |
Figure 19: Restriction patterns obtained after digestion with 10units Msp I for amplified 16S rDNA of Acinetobacter baumannii sample # 1 to 12 after running in 2% agarose gel. 100 bp ladder was used as a standard size marker. |
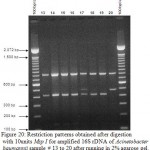 |
Figure 20: Restriction patterns obtained after digestion with 10units Msp I for amplified 16S rDNA of Acinetobacter baumannii sample # 13 to 20 after running in 2% agarose gel. 100 bp ladder was used as a standard size marker. |
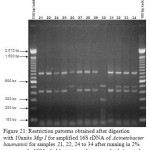 |
Figure 21: Restriction patterns obtained after digestion with 10units Msp I for amplified 16S rDNA of Acinetobacter baumannii for samples 21, 22, 24 to 34 after running in 2% agarose gel. 100 bp ladder was used as a standard size marker |
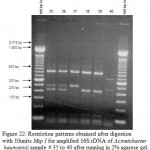 |
Figure 22: Restriction patterns obtained after digestion with 10units Msp I for amplified 16S rDNA of Acinetobacter baumannii for samples 21, 22, 24 to 34 after running in 2% agarose gel. 100 bp ladder was used as a standard size marker |
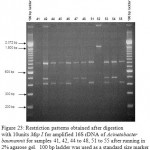 |
Figure 23: Restriction patterns obtained after digestion with 10units Msp I for amplified 16S rDNA of Acinetobacter baumannii for samples 41, 42, 44 to 48, 51 to 55 after running in 2% agarose gel. 100 bp ladder was used as a standard size marker |
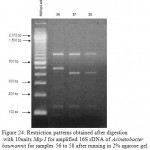 |
Figure 24: Restriction patterns obtained after digestion with 10units Msp I for amplified 16S rDNA of Acinetobacter baumannii for samples 56 to 58 after running in 2% agarose gel. 100 bp ladder was used as a standard size marker. |
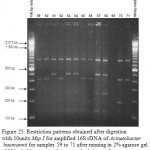 |
Figure 25: Restriction patterns obtained after digestion with 10units Msp I for amplified 16S rDNA of Acinetobacter baumannii for samples 59 to 71 after running in 2% agarose gel. 100 bp ladder was used as a standard size marker. |
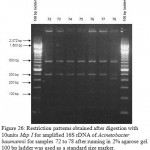 |
Figure 26: Restriction patterns obtained after digestion with 10units Msp I for amplified 16S rDNA of Acinetobacter baumannii for samples 72 to 78 after running in 2% agarose gel. 100 bp ladder was used as a standard size marker. |
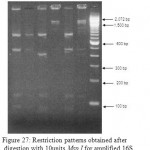 |
Figure 27: Restriction patterns obtained after digestion with 10units Msp I for amplified 16S rDNA of Acinetobacter baumannii for samples 79 to 84 after running in 2% agarose gel. 100 bp ladder was used as a standard size marker. |
ARDRA fingerprinting could not distinguish the 81 isolates, indicating low discriminatory power for the method.
Table 1. ARDRA profiles of 81 Acinetobacter baumannii digested with 5units Alu I restriction enzyme for 4 groups of similarity (A, B, C, D & H); Patterns are shown in Figure 16 to 24.
| Alu I | A | 1 | 3 | 4 | 5 | 6 | 7 | 8 | 9 | 10 | 12 | 14 | 15 |
| 16 | 17 | 18 | 19 | 20 | 21 | 22 | 24 | 25 | 26 | 27 | 28 | ||
| 29 | 31 | 32 | 33 | 34 | 35 | 36 | 37 | 38 | 39 | 41 | 42 | ||
| 44 | 45 | 47 | 48 | 52 | 53 | 55 | 56 | 57 | 58 | 59 | 60 | ||
| 61 | 62 | 63 | 64 | 65 | 66 | 68 | 69 | 70 | 71 | 72 | 73 | ||
| 74 | 75 | 76 | 77 | 78 | 79 | 80 | 81 | 82 | 83 | 84 | |||
| B | 2 | 11 | 13 | 46 | 51 | 54 | 67 | ||||||
| C | 30 | ||||||||||||
| H
(untypeable) |
49 | 50 |
Table 2: ARDRA profiles of 81 Acinetobacter baumannii digested with 5units Mbo I restriction enzyme for 8 groups of similarity (A, B, C, D, E, F, G & H); Patterns are shown in Figure 25 to 33.
| Mbo I | A | 1 | 4 | 5 | 6 | 7 | 8 | 9 | 10 | 11 | 12 | 13 | 14 |
| 15 | 16 | 17 | 18 | 19 | 20 | 22 | 24 | 25 | 26 | 27 | 28 | ||
| 29 | 31 | 32 | 33 | 34 | 35 | 36 | 37 | 38 | 39 | 45 | 46 | ||
| 47 | 48 | 51 | 52 | 54 | 55 | 56 | 57 | 58 | 63 | 64 | 65 | ||
| 67 | 68 | 69 | 71 | 75 | 78 | 79 | 80 | 81 | 82 | 83 | 84 | ||
| B | 2 | 3 | 21 | 44 | 60 | 61 | 70 | 73 | 76 | ||||
| C | 41 | 53 | 59 | 66 | 77 | ||||||||
| D | 62 | ||||||||||||
| E | 72 | 74 | |||||||||||
| F | 30 | ||||||||||||
| G | 42 | ||||||||||||
| H
(untypeable) |
49 | 50 |
Table 3: ARDRA profiles of 81 Acinetobacter baumannii digested with 10units Msp I restriction enzyme for 6 groups of similarity (A, B, C, D, E, F & H); Patterns are shown in Figure 34 to 42.
| Msp I | A | 2 | 3 | 4 | 7 | 8 | 9 | 11 | 12 | 13 | 14 | 15 | 16 |
| 18 | 19 | 21 | 22 | 24 | 25 | 27 | 28 | 29 | 31 | 38 | 39 | ||
| 41 | 44 | 45 | 46 | 51 | 55 | 57 | 58 | 59 | 60 | 62 | 65 | ||
| 66 | 70 | 71 | 81 | ||||||||||
| B | 1 | 5 | 10 | 20 | 26 | 37 | 47 | 48 | 54 | 56 | 61 | 63 | |
| 64 | 67 | 68 | 72 | 73 | 74 | 75 | 76 | 77 | 79 | 80 | 83 | ||
| C | 6 | 17 | 32 | 33 | 34 | 35 | 36 | 42 | 53 | 78 | |||
| D | 52 | 82 | 84 | ||||||||||
| E | 30 | ||||||||||||
| H
(untypeable) |
49 | 50 | 69 |
Figure 1 to 27 show fragments after digestion with Mbo I (Source: an E. coli strain that carries the cloned Mbo I gene from Moraxella bovis ATCC 10900) and was categorized into 8 groups (Strain A to H) (Table 3).
Strain A, comprising of 60 isolates, the biggest group in the analysis is represented by samples number 1, 4, 5, 6, 7, 8, 9, 10, 11, 12, 13, 14, 15, 16, 17, 18, 19, 20, 22, 24, 25, 26, 27, 28, 29, 31, 32, 33, 34, 35, 36, 37, 38, 39, 46, 47, 48, 51, 52, 54, 55, 56, 57, 58, 63, 64, 65, 67, 68, 69, 71, 75, 78, 79, 80, 81, 82, 83 and 84. Strain B is represented by samples number 2, 3, 21, 44, 60, 61, 70, 73 and 76. Strain C is represented by samples number 41, 53, 58, 59, 62, 66 and 77. Strain D is represented by sample number 62. Strain E is represented by samples number 72 and 74. Strain F and G is represented by sample number 30 and 42, respectively. Strain H (undetermined or untypeable) is represented by sample number 49 and 50.
Figure 19 to 27 show fragments after digestion with Msp I (Source: an E. coli strain that carries the cloned Msp I gene from Moraxella species ATCC 49670) and was categorized into 6 groups (Strain A to F, and Strain H) (see Table 8). Strain A, comprising of 40 isolates, the biggest group in the analysis is represented by samples number 2, 3, 4, 7, 8, 9, 11, 12, 13, 14, 15, 16, 18, 19, 21, 22, 24, 25, 27, 28, 29, 31, 38, 39, 41, 44, 45, 46, 51, 55, 57, 58, 59, 60, 62, 65, 66, 70, 71 and 81. Strain B is represented by samples number 1, 5, 10, 20, 26, 37, 47, 48, 54, 56, 61, 63, 64, 67, 68, 72, 73, 74, 75, 76, 77, 79, 80 and 83. Strain C is represented by samples number 6, 17, 32, 33, 34, 35, 36, 42, 53 and 78. Strain D is represented by samples number 52, 82 and 84. Strain E is represented by sample number 30 . Strain H (undetermined or untypeable) is represented by sample number 49, 50 and 69.
Discussion
Acinetobacter spp. has unique characteristics among nosocomial gram – negative bacteria that favor their persistence in the hospital environment. This organism spreads easily in the environment of infected or colonized patients and can persist in that environment for many days, a factor that may explain their propensity for causing extended outbreaks. However, it should be noted that acinetobacters are ubiquitous organisms that can also be isolated readily from nonclinical sources such as soil, drinking and surface water, sewage, and a variety of different foodstuffs. There appears to be a significant population differences between the genomic species found in clinical specimens and those found in other environments, and it is therefore vital that acinetobacters be identified to the genomic species level and then typed before epidemiological conclusions can be drawn. The increased incidence of Acinetobacter baumannii infection required clarification of a possible mode of transmission.
The predominant of one genotype in patient or environmental specimens seemed to suggest transmission from common sources. Bacterial typing schemes based on genotypic analysis of multiple isolates within a particular species to identify characteristics that may subdivide the strains into smaller groupings. Such analyses have several uses – to investigate outbreaks that may in turn influence or focus epidemiological investigations, to examine sequential isolates from a single patient to determine whether infection is recurring or the patient has suffered a relapse, to establish whether certain strains are associated with specific clinical syndromes, and therefore, have unusual pathogenic mechanisms, and in a wider context, to increase our understanding of the epidemiology of infection. Nevertheless, typing is most often used to differentiate dissimilar isolates rather than to confirm a relationship between two different strains. The basic premise of all typing schemes is that strains isolated from an epidemiological cluster arise from a common precursor and therefore, that these strains will share certain characteristics that can distinguish them from epidemiologically unrelated strains of the same species. At least three criteria are necessary for the evaluation of typing schemes: (1) Typability – the ability to obtain a definite result for each isolate tested, (2) reproducibility – the ability to achieve the same result whenever and wherever the same strain is tested, and (3) discrimination – the ability to distinguish between epidemiologically unrelated strains.
AP – PCR / RAPD typing, the simplest technique employed in this study, is suitable for processing isolates within a short time. The main advantage of this technique is that it is rapid, relatively inexpensive, technically feasible for most laboratories and theoretically applicable to any organism. Reproducibility of AP – PCR is low, which renders comparison of new fingerprints in ongoing or repeated outbreaks with previous ones. Typing data cannot be stored in a database for future comparison. All previous strains representing the different genotypes have to be reanalyzed together with the new isolate in the same experiment. Therefore, the number of isolates which can be analyzed ultimately depends on the number of gel lanes available. Whereas Typability is excellent for RAPD, batch to batch reproducibility is sometimes poor. Alteration in concentration of primers, template DNA, Taq or magnesium will influence results. Different lots of Taq or primer, or use of different thermocycler, can affect fingerprints, as can contamination with a product from a previous run. Frequently, nonspecific bands will be produced when any of these variables are changed. In general, RAPD is a more rapid method and is less technically demanding than PFGE because fewer steps are involved. However, RAPD can be more difficult to interpret than PFGE (Shehata. et al., 2010). The bands seen on RAPD gels generally vary in intensity, depending on reaction conditions.
ARDRA fingerprinting could not distinguish the 81 isolates, in contrast to RAPD/AP – PCR and PFGE (Shehata. et al., 2010), indicating low discriminatory power for the method.
In this study, to give an assessment in which typing method is the most efficient several factors must be considered that includes: reproducibility, Typability and discrimination. Reproducibility is the percentage of strains that give the same result on repeated testing. Typability of a method is the percentage of distinct bacterial strains which can be assigned a positive typing marker. PFGE and RAPD give 100% typability, while ARDRA pattern shows 96.2% – 97.5% typability using different restriction enzymes
The discriminatory power of a typing method is its ability to distinguish between unrelated strains. Numerical Index of discriminatory ability of typing system was calculated using Simpson’s index of diversity. It can be seen that the discriminatory power of PFGE (0.914) is relatively high compare to RAPD (0.79), and the ARDRA analysis is relatively poor, which varies between 0.773 (Alu I), 0.438 (Mbo I) and 0.659 (Msp I) (Shehata. et al., 2011).
Acknowledgment
The study was supported in part by Addiriyah Chair for Environmental Studies (Department of Botany and Microbiology, College of Science, King Saud University, Saudi Arabia); we also thank the Centre for Excellence and Diversity, College of Science, King Saud University (Saudi Arabia), for support.
References
- Andrews H. 1986. Acinetobacter bacteriocin typing. J. Hosp. Infect. 9: 169 – 175
- Bergogne-Berezin E and Towner KJ. 1996. Acinetobacter spp. as NosocomialPathogens: Microbiological, Clinical, and Epidemiological Features. Clinical Microbiology Reviews. 9: 148-165.
- Gallego L, Towner K. 2001. Carriage of class I intergrons and antibiotic resistance in clinical isolates of Acinetobacter baumannii from Northern Spain. J. Med. Microbiol. 50: 71 – 77.
- Glew R, Moellering R, Kunz L. 1977. Infections with Acinetobacter calcoaceticus (Herellea vaginicola). Clinical and laboratory studies. Medicine 56: 79 – 87.
- Joly – Guillou M, Decre D, Bergogne – Berezin E. 1992. Infections nosocomiales a Acinetobacter : surveillance epidemiologique hospitaliere. Bull. Epidemiol. Hebd. vl: 211 – 212.
- Karlowsky JA, Draghi DC, Jones ME, Thornsberry C, Friedland IR, Sahm D. 2003. Surveillance for antimicrobial susceptibility among clinical isolates of Pseudomonas aeruginosa and Acinetobacter baumannii from hospitalized patients in the United States, 1998 – 2001. Antimicrob Agents Chemother: 47, 1681 – 1688.
- Koeleman J, Stoof J, Biesmans D, Savelkoul P, Vandenbroucke-Grauls. 1998. Comparison of Amplified Ribosomal DNA Restriction Analysis, Random Amplified Polymorphic DNA analysis, and Amplified Fragment Length Polymorphism Fingerprinting for Identification of Acinetobacter Genomic Species and Typing of Acinetobacter baumannii. Journal of Clinical Microbiology 36: 2522-2529.
- Kuo L, Teng L, Yu C, Ho S, Hsueh P. 2004. Dissemination of a Clone of unusual phenotype of pandrug – resistant Acinetobacter baumannii at a University Hospital in Taiwan. J. Clin. Microbial. 42: 1759 – 1763.
- Lyytikainen O, Koljalg S, Harma M, Vuopio-Varkila J. 1995. Outbreak cause by two multi-resistant Acinetobacter baumannii clones in a burn unit emergence of resistance to imipenem. J Hosp Infect 31: 41 – 54.
- Mandell GL, Bennett JE, Dolin RD. 2000. Principles and Practice of Infectious Diseases, Fifth Edition; pp 2339.
- Paton RH, Miles RS, Hood J, Amyes SGB. 1993. Β-lactamase-mediated imipenem resistance in Acinetobacter baumannii. Int J Antimicrob Agents 2: 81 – 88.
- Rossau R, Duhamel M, Jannes G, Decourt J, van Heuversyn H. 1991. The development of specific rRNA – derived oligonucleotide probes for Haemophilus ducreyi, the causative agent of chancroid. J. Gen. Microbiol. 137: 277 – 285.
- Seifert H, Baginski R, Schulze A, Pulverer G. 1993. The distribution of Acinetobacter species in clinical culture materials. Zentralbl Baketeriol 279: 544 – 552.
- Shehata, Afaf I., Al-Aidan, Alwaleed A. and Al-Shahrani, Buthainah. 2010. Molecular Typing of Clinically Isolated Acinetobacter Baumannii Strains by Randomly Amplified Polymorphic DNA (RAPD) Analysis in Riyadh,ksa(In press).
- Shehata, Afaf I., Al-Aidan, Alwaleed A. and Al-Shahrani, Buthainah. 2011. Molecular Epidemiology of Nosocomial Infection of Acinetobacter Baumannii by Pulsed-Field Gel Electrophoresis.(PFGE) in press.
- Trouillet J, Vuagnat A, Calvat S, Joly – Guillou M, Dombret M, Clavier H, Gilbert C, Chastre J. 1995. Ventillator – associated pneumonia due to Acinetobacter baumannii: prospective analysis of 22 episodes, abstr. A474. In abstracts of the American Thoracic Society International Conference.
- Van Looveren M, Goossens H and the ARPAC Steering Group. 2004. Antimicrobial resistance of Acinetobacter spp. in Europe. Clin Microbiol Infect 10: 684 – 704.

This work is licensed under a Creative Commons Attribution 4.0 International License.


