

Manuscript accepted on : 21 December 2011
Published online on: --
Keivan Saeb
Department of Environment, Tonekabon Branch, Islamic Azad University, Tonekabon Iran.
ABSTRACT: Redwood 2-year seedlings were planted in 1982 as a pure of 156 hectares in north of Iran. In order to assess the compatibility and the the growth of this plant was measured quantitative characteristics such as diameter, Height, Crown diameter in 2010 (30 age). Inventory was done in this area by systematic random method with the intensity 15%. sample plots were 500 m². the result indicate, There is quite a significant difference with 99% confidence level (P<0.01) between diameter at breast height of Redwood trees, But there is no significant difference between height and slenderness coefficient. The results of the factors examined include: slenderness coefficient (70.64), Diameter at breast height(20.87 cm), Height(14.7 m), Crown diameter(4.35 m), Volume at hectare (178.46 m³), Diameter increment (9.48 mm), Height increment (64.09 cm), Volume increment (8.06 m³).
KEYWORDS: Sequoia sempervirens, Height, Diameter, Slenderness coefficient.
Download this article as:| Copy the following to cite this article: Saeb K. Investigation on Adaptability and Quantitative Properties of Redwood (Sequoia sempervirens) in North of Iran Forest Plantation. Biosci Biotech Res Asia 2011;8(2) |
| Copy the following to cite this URL: Saeb K. Investigation on Adaptability and Quantitative Properties of Redwood (Sequoia sempervirens) in North of Iran Forest Plantation. Biosci Biotech Res Asia 2011;8(2). Available from: https://www.biotech-asia.org/?p=9434/ |
Introduction
With the use of reforestation, Man seeks to achieve new and relatively sustainable ecosystems. So, The selection of appropriate species and compatible with the viabilityand optimal growth and assessment of ecological effects of reforestation on species is of special importance. In a country like Iran, study of qualitative and quantitative characterization, compatibility and cultural operations in afforestetion by fast-growing trees are the most important measures of forestry and forest management for increased production and wood supply requirements (GorjiBahri and Hemati, 2004). Coniferous forests in northern Iran in 2000 is estimated at approximately 40,000 hectare(Asadollahi, 2000). From 1960 decade in order to rebuild the destroyed areas in north of Iran are annually done 30 to 40 thousand hectares of afforest operation and restoration of forest by the forest organization and other sectors (Tabari, M. and Pourmajidian, 2001) .
Sequoia sempervirens (D. Don) Endl. (Coast Redwood), is an important conifer species in wet temperate forests of northern California( Koch et al, 2004).Moreover, it grows very rapidly along the pacific coastal area of North America, beginning in southern Oregon and ending just south of Monterey, California (WhanSul et al., 2005). It commonly grows to 60 to 84 m in height and 2.4 to 3.6 m in diameter, with the current champion reaching 101 m in height. there is fairly solid evidence that before logging coast redwoods were the world’s largest trees, with specimens measured at over 55,000 cubic feet (1,600 m3) (Van Pelt 2001).The oldest known coast redwood is about 2,200 years old and the current tallest tree of this species is measured 115.61 m (Earle, 2011).The theoretical maximum potential height of coast redwoods is limited to between 122 to 130 metres (400 to 427 ft), due to gravity and the friction between water and the vessels through which it flows( Koch et al, 2004).
The mild climate of the redwood forest region can be classed broadly as super-humid or humid. Annual precipitation varies between 640 and 3100 mm (25 and 122 in) and is mostly winter rain, although snow sometimes covers the highest ridges (Major, 1977).The natural range of redwood is limited to areas where heavy summer fogs from the ocean provide a humid atmosphere, although its successful growth in plantations or amenity plantings is not as limited. Redwood is among the most successful trees in the Central Valley of California, and at low elevations in the Sierra Nevada. It grows well at considerable distance from the ocean in New Zealand, France, Spain, and elsewhere (Kuser, 1976., Libby, 1981).
This specieshas spread In the United States from sea level to an altitude of 900-1000 meters. In the gentle slopes, Less than 300 meters above sea level is a significant growth. with increasing altitude of the height growth is reduced. Drought and increased are two factors limiting the spread of this species (gholizade, 2000).
Provinces in northern of Iran due to the proximity to the Caspian Sea have a suitable habitat for planting of this species. With regard to commercial and ecological value of the Redwood, The planting of this species was doneas green beltwith the aim to prevent rape to national resources, Study species compatibility, Promenade and tourists attract.This study examines the quantitative growth of Redwood in Tile Kenarforestry projectes in north of Iran. In addition to evaluating the success or failure of plant this species in this habitatwill investigategrowth and development during the past yeares to measure characteristics such as diameter at breastheight , height, slenderness coefficient,Volume,crown diameter.
Materials and Method
The study area has a gentle slopewhich is known Tile Kenarforestry projects,it is located in watershed 38 in south of agricultural land in Abas Abad city, Mazandaran province, Iran,with latitude 36° 30¢ 00² , 36° 41¢ 30²and longitude 50° 07¢ 30² , 50° 25¢ 00² (figure 1). Based on information recorded in the meteorological station(the years 1976 to 2006), The average annual rainfall is 1174.9mm,The average annual relative humidity and the average annual temperature are 85% and 16°c.
Redwood 2-year seedlings were planted in 1982 as a pure. Afforestationarea are 156 hectares in this area. In order to evaluate the compatibility and performanceRedwoodIn 2010 (age 30) was selected 15 hectares of area has afforest. For this purpose, the planting area maps were prepared. Inventory networkplaced on it. 22 point as the center of the sample ploteswas determinedfor the field data collection within the afforest. Inventory was done in this area by systematic random method. networkes size were 50m×50m.Inventory was conducted with the Intensity 15%. So thatin the center of each gridwas consideredsample plots of 500 m² with form of circle. Quantitative properties of Redwoodwere measured in each sample profile, such as diameter at breast height, height and crown diameter.By dividing height to diameter (H/D)was calculated slenderness coefficient for eachtree.
Normality of quantitative data was evaluated by using of Kolmogorov-Smironov test. datawas analysis by using MINITAB 15 of statistical software and One-way Anova of variance test. Comparison of average was done by Tukey test in probability level of 0.05.
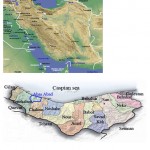 |
Figure 1: Map of the study area located in Abas Abad, Mazandaran, Iran.
|
Result
By measuring the diameter at breast height in 22 sample plots, Redwoodtrees were classifiedin diameter classes 5, 10, 15,.…,60 andthe frequency of trees in per diameter class was determined. As is noticeable in figure 2, Species studied in 20 cm diameter class after then 15 and 25 cm has the highest frequency. Distribution in diameter classesrepresents a even aged curve that crooked to the left.
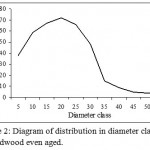 |
Figure 2: Diagram of distribution in diameter classes in Redwood even aged.
|
In this study,by using datawere studied the relationship between slenderness coefficient and heighit withdiameter at breast height. The curves were drawn for this species. Pay attention to figure 3 the height curve of Redwood stand is rising parabola in 22 sample plotes.correlation coefficient equation between diameter and height is Y= 6.4047ln(x)-5.536 and R²= 0.669 but the slenderness coefficient curve is descendingparabola.this index is reducedby increasing age and diameter of stand (figure 4).
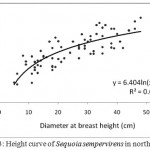 |
Figure 3: Height curve of Sequoia sempervirens in north of Iran.
|
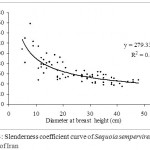 |
Figure 4: Slenderness coefficient curve of Sequoia sempervirens in north of Iran.
|
Pay attention to table 1,There is quite a significant difference with 99% confidence level (P<0.01) between diameter at breast height of Redwood trees in 22 smpeplotes. It means, this species has a distribution in diffrent diameter classes. But there is no significant difference between height and slenderness coefficient. Table 2 shows the meanescomparisonOf diameter (cm), height(m), and slenderness coefficient in 22 sample plots. Averages were compared by using Tukey test at a significant level of 0.05 percent. The average maximum of diameter was observed in a sample plot of 2 (31.55 cm) and the average minimum of diameter was observed in a sample plot of 14 (10cm). the average maximum and minimum of height belonged to sample plotes of 12(18.47) and 3(10.66). The average maximum and minimum of slenderness coefficient were observed in sample plotes of 14(127) and 2(43.87) (table 2). Average factors examined(Slenderness coefficient, Diameter at breast height, Height, Crown diameter, Volume at hectare, Diameter increment, Height increment, Volume increment)are shown in 22 sample plots in Table 3.
Table 1: Analysis of variance diameter at breast height , Height, Slenderness coefficientofSequoia sempervirensin 22 sample plots under study.
| Factores | Source Changes | Degrees of | sum of squares | Mean Square (MS) | F |
| freedom (DF) | (SS) | ||||
| Diameter at breast height | Sample plot | 21 | 10134 | 483 | 4.63** |
| Error | 379 | 39534 | 104 | ||
| Total | 400 | 49669 | |||
|
height |
Sample plot | 21 | 304.2 | 14.5 | 0.72ns |
| Error | 51 | 1026.9 | 20.1 | ||
| Total | 72 | 1331.1 | |||
| slenderness coefficient
|
Sample plot | 21 | 7648 | 364 | 0.54ns |
| Error | 51 | 34541 | 677 | ||
| Total | 72 | 42189 |
Table 2: mean Comparison of diameter at breast height , Height, Slenderness coefficient of Sequoia sempervirensin 22 sample plots under study.
| Sample plot | Diameter at breast height (cm) | Height (m) | Slendernesscoefficient
|
| 1 | 17.23±8.06 | 15.37±3.83 | 89.45±53.68 |
| 2 | 31.55±19.39 | 12.73±2.74 | 43.87±6.41 |
| 3 | 17.15±5.68 | 10.66±4.74 | 70.93±3.17 |
| 4 | 18.20±7.25 | 12.56±2.8 | 54.90±21.04 |
| 5 | 20.40±10.16 | 11.05±3.18 | 43.45±7.71 |
| 6 | 23.36±10.74 | 14.88±2.37 | 56.20±17.15 |
| 7 | 17.50±7.34 | 11.7±0.42 | 66.05±30.62 |
| 8 | 13.74±6.84 | 13.9±4.43 | 101.1±4.37 |
| 9 | 19.17±8.82 | 12.87±3.67 | 68.58±18.04 |
| 10 | 23.53±8.30 | 13.45±3.37 | 60.65±16.81 |
| 11 | 22.40±9.44 | 12.98±9.44 | 60.97±27.56 |
| 12 | 23.18±12.25 | 18.47±6.7 | 62.93±17.91 |
| 13 | 22.60±9.71 | 12.4±6.3 | 69.65±23.82 |
| 14 | 10.00±5.68 | 12.7±1.83 | 127.0±13.15 |
| 15 | 20.10±14.04 | 13.7±8.34 | 87.25±60.46 |
| 16 | 20.59±9.62 | 16.67±4.96 | 78.00±25.03 |
| 17 | 27.24±9.37 | 17.9±5.93 | 59.85±14.66 |
| 18 | 24.50±11.89 | 15.6±4.91 | 69.07±39.75 |
| 19 | 20.58±10.54 | 16.4±2.26 | 66.80±21.78 |
| 20 | 14.60±6.95 | 12.45±3.6 | 63.20±11.60 |
| 21 | 24.80±13.43 | 15.75±3.66 | 68.72±36.73 |
| 22 | 26.83±9.81 | 16.1±5.59 | 59.18±8.33 |
Table 3: meansof factorsexaminedfor Sequoia sempervirens in 22 sample plots.
| Total mean | Mean annual increment | ||||||
| slenderness coefficient | Diameter at breast height(cm) | Height(m) | Crown diameter(m) | Volume at hectare(m³) | Diameter increment (mm) | Height increment (cm) | Volume increment (m³) |
| 70.64 | 20.87 | 14.7 | 4.35 | 178.46 | 9.48 | 64.09 | 8.06 |
Discussion
In a pure and eaven aged stand distribution of trees in diameter classes is almost like a normal curve (Zobeiri, 2000). Pay attention to figure 2 crooked to the left of the diagram focuses on young and even aged in the stand under study. Habitat conditions and fertility cause the most trees are concentrated in the central part and smaller frequency get away from the central part with different reasons. Redwood 30-year has largest frequency in diameter classes 15, 20 and 25. The result is the highest in this classes (figure 2). Mostafanejad and Dastmalchi (2004) during a similar study in north of Iran (Chamestan city) stated, Rewood 19 years has the highest frequency in the middle diameter classes (30 to 35 cm). Due to the fast-growing in Rewood species and competition between each other, there is a noticeable growth during this period in diameter growth of some trees of this species. Bysilvicultural operations (thining),distribution graphs of plants will transform, Density of trees will less in the middle and two sides ofthe diagram are graphicto the right and left.
Height of trees is one of quantitative characteristics that show fertility status of the habitat and trees competitive position in stand.the average of height growth is 14.70(table 3). by assessingheight growth in all plotes can be stated, There is no noticeable difference in height growth in sample plots(table 2). This means that over 28 years afforest of the region has maintained its even eaged form. (Mostafanejad and Sadati,2008) with evaluation of compatibility and performance three species of Taxodiaceae family in north of Iran(chamestan city) said: Redwood to other species of this family has better conditionof the diameter and height growthbaut it has the lowest of quality of the trunk. They also stated, species of Taxodiaceae family are successful and adaptable species and with good growth of diameter and height have culture and development capability in the same conditions. Most of the factors studied in this study compared with results from other researchers in thae table 4. As is noticeable, Afforest project, with the Redwood in chamestan and behshar[1] is more successful this project in this study. So, we can say this forest plantation need to farm Interference for production of wood.Coast redwood is one of the most valuable timber species in California with 899,000 acres (3,640 km2) of redwood forest, all second growth, managed for timber production(IUCN. 2011).
Table4: mean comarison of mean annual increment and growth in diameter,height, and volume ofSequoia sempervirens in Abas Abad project with other different area.
Curve of slenderness coefficient shows, This ratio decreases with increasing diameter at breast(figure 4). slenderness coefficient is Important factor for to evaluate the stability in forest stand. It is suitable guide for the development of forest plantations. Classified based on slenderness coefficient(H/D), The value of this ratio over 100 is very unstable, Between 80 and 100 unstable for stand, Less than 100 is stable (Memarian et al, 2006). Mean of slenderness coefficient was 70.64 in studied stand (table3) that pay attention to classification was done, forest plantations is stable and its status is normal. But a review of Table 2, we can be stated, sample plotes of 8 with slenderness coefficient over 100 is very unstable.So, this plotes have crisis condition and it is necessary , Should be done farm operations as soon as is possible for achieving stability and sustainability in stand.
Conclusion
Recommended by farm operations with appropriate intervals to provide increase the diameter and height growth andmanaged for timber production. Redwood has the best habitat in the mountains where there is more precipitation from the incoming moisture off the sea and it has a significant growth less than 300 meters above level of sea. Its better should be selected regions with such characteristics for planting this species in north of Iran. Culture as one of fast growing species and industrial is recommended in Similar area in terms of soil properties and climate.
Reference
- Dudarev, A.D., Dusha,V.l., Kosarev, N.G.andUspenskii,V.V., 1975. Growth and yield of representatives of N.American tree species on the black sea coast of the caucasus. Lesnoi, Zhurnal, No. 2: 28-32.
- Douglass, F.R., 1972. Fascination in redwood.Madroño, 21(7): 462.
- Earle, C. J., 2011. “Sequoia sempervirens”.The Gymnosperm Database. Olympia, Washington: self-published. http://www.conifers.org/cu/se/index.htm. Retrieved 2011-08-13.
- GorjiBahri, Y., Hemati, A., 2004. Results of loblolly pine ( Pinustaeda L. ) and Caucasian alder ( AlnussubcordataC.A.Mey.) silvicultural operations in the Caspian low land regions of Iran. Pajouhesh&Sazandegi No 63: pp: 2-9.
- IUCN, 2011. Red List of Threatened Species”.Species Survival Commission.http://www.iucnredlist.org/search/details.php/34051/all. Retrieved 2011-08-14.
- Ill-WhanSul& Schuyler S. Korban, 2005, Direct shoot organogenesis from needles of three genotypes of Sequoia sempervirens. Plant Cell, Tissue and Organ Culture. 80: 353–358.
- Koch, G.W., Sillett, S.C., Jennings, G.M., and Davis, S.D. 2004.The limits to tree height. Nature 428: 851–854.
- Kuser, J. E., 1976. Potential site index of redwood as a function of climate.Thesis (M.S.), Rutgers University, New Brunswick, NJ.98 p.
- Libby, W. J., 1981. Personal communication.University of California, Department of Forestry and Conservation, Berkeley.25 p.
- Major, J., 1977.California climate in relation to vegetation.In Terrestrial vegetation of California. P., 11-74. Michael G. Barbour and Jack Major, eds. John Wiley, New York.
- Mostafanejad, S.R. and Sadati, S.E. 2008. Results of adaptation trial with three Taxodiaceae species at Chamestan plain, Mazandaran province. Iranian Journal of Forest and Poplar Research 16 ( 2): 230-240.
- MostafanejadS.R. and Dastmalchi, M. 2003. Investigation on Adaptability and Quantitative Properties of Redwood (Sequoia sempervirens) in north of Iran, Mazandaran province.Iranian Journal of Forest and Poplar Research. 12(1): 13-30.
- Memarian, F., Tabari, M., Hosseini, S. M., Shafiei, A. B. 2006. Comparison of growth in man-made pure and mixed Norway spruce stands of Kelardasht (north of Iran). Pajouhesh&Sazandegi No:73pp: 171-176.
- Olson, D. F., Douglass, J.R., Douglass, F. and Walters, G.A., 1990.Sequoia Sempervirens (D. Don) Endl.redwood. In: Burns, R. M. and Honkala B. H. (eds.) Technical Coordinators Silvics of North America, Volume 1.Conifers.Agric. Handb.654.Washington, DC: USDA, Forest Service: 541- 551.
- Tabari, M. and Pourmajidian, M. R., 2001; Influence of thinning on Atlas Cedar (CedrusatlanticaManetti) in the north of Iran, International Meeting on Silviculture of Cork Oak (QuercussuberL.) and Cedar (CedrusatlanticaEndl.) M. Rabat. Morocco. 22-25 October, 2001, p.19-24.
- Van Pelt R., 2001. Forest giants of the Pacific Coast. Vancouver, BC: Global Forest Society: 16B29.
- Zobeiri, M. 2000. Forest Inventory (Measurement of Tree and Stand). Tehran University Publications. No: 2238, 401pp.
- [1]They are two city in north of Iran

This work is licensed under a Creative Commons Attribution 4.0 International License.


