

Manuscript accepted on : 22 October 2011
Published online on: --
C. S. Chidan Kumar¹, R. Mythily and S. Chandraju*
1Department of Studies in Sugar Technology, Sir M. Vishweshwaraya Post-Graduate Centre,University of Mysore, Tubinakere, Mandya - 571 402 India.
2Department of Chemistry, G. Madegowda Institute of Technology, Bharathi Nagar - 571 422 India.
Corresponding Author: Email- chandraju1@yahoo.com
ABSTRACT: A rapid, sensitive extraction method was developed using the mixture Methanol –Dichloromethane - Water (MDW) (0.3:4:1, v) and MeOH-H2O phase was assayed for sugar analysis. Photodiode-array detection (DAD) has been used to prove the extracted compound is UV inactive, High-performance liquid chromatography (HPLC) with Evaporative Light Scattering Detector (ELSD) coupled to electrospray ionization mass spectrometric (ESI-MS) detection in the positive ion mode gave MS and MSn fragmentation data which were employed for their structural characterization. The various standard sugars were spotted using the solvent system n-butanol-acetone-pyridine-water (10:10:5:5, v) in the cellulose layer for TLC analysis which indicated the presence of fructose, galactose, glucose, arabinose and Xylose. This is the first assay of the sugar profile of the orange peels, which can be further developed for characterization and evaluation of their quality with regards to their sugar composition.
KEYWORDS: Sugar extraction; Orange peels; UV inactive; Separation; LC/MS; TLC
Download this article as:| Copy the following to cite this article: Kumar C. S. C, Mythily R, Chandraju S. Extraction of Carbohydrate from Sweet Orange Peels (Citrus sinensis L.) and their Identification via LC /MS and Thin Layer Chromatographic Analysis. Biosci Biotech Res Asia 2011;8(2) |
| Copy the following to cite this URL: Kumar C. S. C, Mythily R, Chandraju S. Extraction of Carbohydrate from Sweet Orange Peels (Citrus sinensis L.) and their Identification via LC /MS and Thin Layer Chromatographic Analysis. Biosci Biotech Res Asia 2011;8(2). Available from: https://www.biotech-asia.org/?p=9523/ |
Introduction
Citrus Sinensis.L (sweet orange) has always remained part of human diet for many years. In recent times, however, they have assumed greater importance in diets of both urban and rural dwellers. The increased interest in their consumption is not only due to their sweet refreshing properties but also as a result of increased knowledge of their nutritional and medicinal values. Orange fruit and its juice have several beneficial, nutritive and health properties1. They are rich in vitamins especially ascorbic and folic acids. Over the last decades, many other virtues and medicinal benefits of orange fruits have been discovered besides their anti-scurvy property2. There is convincing epidemiological evidence that the consumption of orange fruits is beneficial to health and contributes to the prevention of degenerative process, particularly lowering incidence and mortality rate of cancer, cardio- and cerebro-vascular diseases2. The protection that orange fruits provide against these diseases has been attributed to the various antioxidant phytonutrients contained in citrus species1-2. In current citrus industry, emphasis are laid only on orange fruits harnessed and marketed fresh or as processed (and canned) juice, while fruit peels produced in great quantities during the process are mainly discarded as waste. For this reason, researchers have focused on the utilization of citrus products and by-products 3-4. Thus, the peels of sweet orange are not only left out as waste but also considered as one of the major factors that hamper the development of citrus industry. Orange fruits have been part of human diet for ages due to its nutritional and medicinal values. But consumption of orange fruits generates orange peel wastes that could bring about environmental pollution if not properly handled. Towards recycling of wastes and avoiding littering and waste- related environmental degradation, this study was carried out to explore the carbohydrate components of orange peels with a view to establishing their raw material potentials. Orange peels cut into small bits were subjected to sequential solvent system and extracted component passed through some chemical characterization procedures for purposes of identifying its sugar components. Processing of citrus peels into sugars is a sure way of transforming these wastes with great potential for environmental pollution into a resource with great potential for economic prosperity, and also for securing the public health impacts of safer and healthier environment, likely to be obtained from the indirect waste management option so offered. Mainly orange peel consists of cellulose, essential oils, proteins and some simple carbohydrates5. Carbohydrates are among the most abundant compounds in the plant world, and the analysis of sugars and sugar mixtures is of considerable importance to the food and beverage industries. Therefore production of various sugars evaluated from the non edible portion of orange has considerable promise in the future to achieve economical profit and moreover utilization of the agro-industrial wastes for sugar production will be of immense benefit at preventing the pollutional hazards associated with these wastes.
Materials and Methods
Extraction
Selected samples are sliced, dried under vacuum at 600C for 48 h and powdered. 100.0 g of raw material was extracted with triply distilled water 75mL, 15mL of 0.1N sulphuric acid and kept on hot plate for about 5 h at 60°C. Contents are cooled and stirred well with magnetic stirrer for 30’. Neutralized using barium hydroxide (AR) and precipitated barium sulphate is filtered off. The resulting syrup was stored at 4°C in the dark. The syrup was treated with charcoal (coir pith) and agitated for 30’ followed by Silica gel (230-400 mesh) packed in a sintered glass crucible for about 2cm thickness connected to suction pump, where rota vapour removed the solvent of the filtrate. The residue was placed in an air tight glass container covered with 200 ml of boiling 80% ethanol. After simmering for several hours in a steam bath, the container was sealed and stored at room temperature. For the analysis, sample was homogenized in a blender for 3-5’at high speed and then filtered through a Buchner funnel using a vacuum source replicated extraction with 80% EtOH (2x50mL) each time and the whole syrup was concentrated. Methanol – Dichloromethane – water (0.3:4:1, v), Sample tubes fed with the mixture were loosely capped, placed in a water bath for 5S, and left at room temperature for 10’and placed in separating funnel, agitated vigorously by occasional release of pressure, results two phases. The organic phase was discarded which removes the organic impurities and the methanol: water phase was assayed for sugar. The residues were oven-dried at 50°C overnight to remove the residual solvent, and stored in refrigerator for analysis 6-14.
Instrumentation
The mixture was separated in 26’by reversed phase HPLC on an Adsorbosphere column-NH2, (250 x 4.6 mm column) using both isocratic and gradient elution with acetonitrile/water and detected using Waters ELSD 2420. In ELSD, the mobile phase is first evaporated. Solid particles remaining from the sample are then carried in the form of a mist into a cell where they are detected by a laser. The separated fractions were subjected to UV analysis using Agilent 8453 coupled with Diode array detector. HPLC–MS analysis was performed with LCMSD/ Trap System (Agilent Technologies, 1200 Series) equipped with an electrospray interface. The MS spectra were acquired in positive ion mode. The mobile phase consisted of 0.10% formic acid in hplc grade deionized water (A) (milli-q-water (subjected to IR radiation under 3.5 micron filters) and Methanol (B) taken in the stationary phase of Atlantis dc 18 column (50 x 4.6mm – 5µm). The gradient program was as follows: 10% B to 95% B in 4’, 95% B to 95% B in 1’, 95% B to 10% B in 0.5’followed by 10% B in 1.5’at a flow rate of 1.2 mL min-1. The column oven temperature was kept at 40°C and the injection volume was 2.0 µL. Product mass spectra were recorded in the range of m/z 150-1000. The instrumental parameters were optimized before the run 6-14.
Preparation of chromatoplates
Thin layer chromatography was performed for the concentrated separated fraction using Cellulose MN 300 G. The fractions obtained were subjected to one dimensional chromatogram on a cellulose layer plate. Each plate was activated at 110°C prior to use for 10’.
Standard samples
Pure samples of D (-) Arabinose, D (-) Ribose, D (+) Xylose, D (+) Galactose, D (+) Glucose, D (+) Mannose, L (-) Sorbose, D (-) Fructose, L (+) Rhamnose, D (+) Sucrose and D (+) Maltose, D (+) Lactose were used as standard.
One – dimensional chromatography
10 mg of each sugar and the separated fractions were dissolved in 1ml of deionised water. 1µL of each sugar solution was applied to the chromatoplate with the micropipette in the usual manner. The chromatoplate was placed in the chamber containing the developing solvent. The solvent system used was n-butanol – acetone – diethylamine – water (10:10:2:6 v/v/v/v). The plates were developed in an almost vertical position at room temperature, covered with lid 15-18. After the elution, plate was dried under warm air. The plate was sprayed with 5% diphenylamine in ethanol, 4% aniline in ethanol and 85% phosphoric acid (5:5:1v/v/v). The plate was heated for 10’at 105°C. While drying coloured spots appear 19. The Rf values relative to the solvent are reported below.
Results and Discussion
Analysis report showed that the extracted separated components are UV inactive shown in Fig. 1, and their respective retention time falls as follows 0.641, 0.662, 0.671, 0.675 and 0.681.
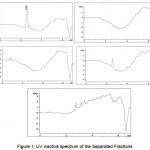 |
Figure 1: UV inactive spectrum of the Separated Fractions.
|
The Mass Spectrum detector gave the following spectrum of fraction1 at 0.606 and 2.637min, fraction2 at 0.578 min, fraction3 at 0.593min, fraction4 at 0.595 and 2.576min, fraction5 at 0.584min. The MS report recorded at the appropriate time as per MSD for Fraction1 scanned between the time period 0.507: 0.798min gave m/z values 112.9, 145.1, 163.0, 180.1, 198.0, 360.0 and 2.495: 2.760min gave m/z value 112.1. Fraction 2 scanned between the time periods 0.493:0.772min gave m/z values 112.9, 145.1, 163.0, 164.1, 180.1, 202.9. Fraction 3 scanned between the time periods 0.507: 0.745min gave m/z values 111.2, 115.1, 140.9, 145.1, 180.1, 198.0, 202.9. Fraction4 scanned between the time periods 0.520: 0.745 and 2.508: 2.667 gave m/z values 111.2, 145.1, 150.1, 272.9, 305.1, 326.1, 327.1, 331.0 and 112.2, 145.1, 278.9, 312.1 respectively. Fraction 5 scanned between 0.520:0.745’ gave m/z values 145.1, 150.1 which gives a conclusion that these masses corresponds to Hexose, pentose and disaccharides whose masses are 180.1, 150.1 and 360.0 respectively depicted in Figures. 3-7.
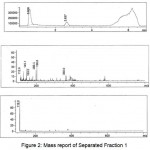 |
Figure 2: Mass report of Separated Fraction 1
|
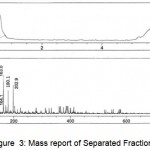 |
Figure 3: Mass report of Separated Fraction 2
|
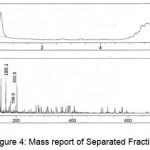 |
Figure 4: Mass report of Separated Fraction 3
|
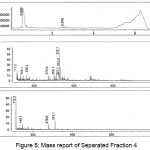 |
Figure 5: Mass report of Separated Fraction 4
|
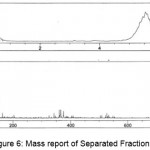 |
Figure 6: Mass report of Separated Fraction 5
|
Thin layer chromatographic analysis report
Five separated and purified sample fractions are spotted in the cellulose layer and the eluted species were mentioned as F 1, F 2, F 3, F 4 and F 5 in the chromatogram shown in Fig. 8.
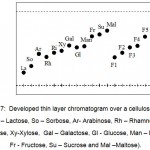 |
Figure 7: Developed thin layer chromatogram over a cellulose layer,(La – Lactose, So – Sorbose, Ar- Arabinose, Rh – Rhamnose, Ri – Ribose, Xy-Xylose, Gal – Galactose, Gl – Glucose, Man – Mannose, Fr – Fructose, Su – Sucrose and Mal –Maltose). |
The fractions obtained were found to be matching with the standard sugars identified as galactose, glucose, fructose and arabinose and xylose. Rf value for the analytical grade samples which also shows the matching fractions Table 1.
Table 1: Rf values matching of the analytical standard samples and the separated samples.
| Sugars | Rf ( Scale of Rf =1) | Fraction matching |
| Lactose | 0.17 | – |
| Maltose | 0.26 | – |
| Sucrose | 0.42 | – |
| Galactose | 0.38 | F1 |
| Glucose | 0.44 | F2 |
| Mannose | 0.47 | – |
| Sorbose | 0.54 | – |
| Fructose | 0.51 | F3 |
| Arabinose | 0.53 | F4 |
| Xylose | 0.66 | F5 |
| Ribose | 0.69 | – |
| Rhamnose | 0.74 | – |
Conclusion
The quantity of the discarded portion is very high; therefore, because of disposal problems the household solid wastes are of greater importance. A fruitful and economic industrial application was applied in this current work. Based on the above studies, a rapid method for the extraction of water soluble sugar has been developed. The mixture MDW gives better results as compared with MCW, i.e dichloromethane was replaced instead of chloroform20. HPLC has proven to be more selective than conventional wet methods; Mass and TLC analysis gives accurate confirmation for the presence of fructose, galactose, glucose, arabinose and Xylose.
References
- Okwu, D.E. Emenike I.N., Evaluation of the phyto-nutrients and vitamins content of citrus fruits, Int. J. Mol. Med. Adv. Sci, 2: 1-6 (2006).
- Rapisararda, G.H., Antioxidant effectiveness as influenced by phenolic content of fresh orange juice. J. Food Chem. 47: 4718-4723 (1999).
- Kubo, K. Kiyose, C. Ogino, S. Saito, M. Suppressive effect of Citrus aurantium against body fat accumulation and its safety. J. Clin. Biochem. Nutr. 36: 11-17 (2005).
- Wu, T. Guan, Y.O, Ye, J.N., Determination of flavonoids and ascorbic acid in grapefruit peel and juice by capillary electrophoresis with electrochemical detection. J. Food Chem. 100: 1573-1579 (2007).
- Peris-Tortajada, M. Nollet., LML Handbook of Food Analysis, Marcel Dekker, New York, 533–550 (1996).
- Hô Pham-Hoang., An Illustrated Flora of Vietnam1 (2): 718 – 727(1991).
- Jansen, G.J, Gildemacher, B.H, Phuphathanaphong, L. Luffa, P. Miller., Plant Resources of South-East Asia, Vegetables. Pudoc Scientific Publishers, Wageningen, 194 – 197(1993).
- Xie Zongwa, Yu Youqin., Materia Medica, Chinese Terminology, Renminweisheng Publishing House Beijing, China(1996).
- Bois, D., Encyclopédie Biologique, Les Plantes Alimentaires, Ed.Paul Lechevalier, (1927).
- Chandraju, S. Mythily, R. Chidan Kumar, C.S., Chem. Pharm. Res 3(3): 312-321(2011).
- Chandraju,S. Mythily, R. Chidan Kumar, C.S., Chem. Pharm. Res 3(4): 422-429 (2011).
- Chandraju, S. Mythily, R. Chidan Kumar, C.S., Int J Cur Sci Res, 1: 125-128 (2011).
- Chandraju,S. Mythily, R. Chidan Kumar C.S., (2011). Asian journal of chemistry (In press).
- Chandraju, S. Mythily, R. Chidan Kumar, C.S., Recent Research in Science and Technology, 3: 58-62 (2011).
- Sharaf,A. Ola Sharaf, A. Hegazi, S.M. Sedky, K., Chemical and biological studies on banana fruit, Cairo University, 18: 8-15(1979).
- Baldwin, E. Bell, D.J., Cole’s Practical Physiological Chemistry, Cambridge, 189(1955).
- Schweiger, A., Journal of Chromatography, 9: 374(1962).
- Vomhot, D.W. Tucher, T.C., Journal of Chromatography 17:300(1963).
- Lato, M. Brunelli, B. Ciuffins, G., Journal of Chromatography, 34:26(1968).
- Pak,S.Chow, Simon, M., Landhäusser Tree Physiology 24:1129 –1136(2004).
(Visited 1,636 times, 1 visits today)

This work is licensed under a Creative Commons Attribution 4.0 International License.


