

Manuscript accepted on : April 18, 2011
Published online on: 28-06-2011
Ayyappan Thiyagarajan1*, Vetrichelvan Thangarasu1 and Darlinquine Sabarimuthu2
1Department of Pharmaceutics, Adhiparasakthi College of Pharmacy, Melmaruvathur - 603 319 India.
2SASTRA University, Thanjavur - 613 401 India.
ABSTRACT: Aceclofenac, a widely prescribed non- steroidal anti inflammatory drug is practically insoluble in water and aqueous fluids, because it exhibits poor and variable dissolution rate and oral bioavailability. The objective of the study is to investigate feasibility of enhancing the dissolution rate of aceclofenac. Solid dispersions prepared by solvent evaporation method with crosspovidine as a new class of dissolution enhancing carrier. The prepared solid dispersions characterized in terms of UV-Visible spectroscopy, IR spectra, thermal behaviour (differential scanning calorimetry, DSC), X-ray diffraction (XRD), morphology (scanning electron microscopy, SEM).The DSC showed a decrease in the melting enthalpy indicating disorder in the crystalline content. The DSC showed, decreased drug crystallinity, altered surface morphology and micronization.The XRD also revealed a characteristic decrease in crystallinity. The drug content in all the formulation was found to be within the official limit. The dissolution rate of aceclofenac solid dispersion could be enhanced markedly higher than pure drug.
KEYWORDS: Aceclofenac; Dissolution rate; Solid dispersion Crosspovidone
Download this article as:| Copy the following to cite this article: Thiyagarajan A, Thangarasu V, Sabarimuthu D. Preparation and Physicochemical Characterization of Solid Dispersion of Aceclofenac Formulated by Solvent Evaporation Method. Biosci Biotech Res Asia 2011;8(1) |
| Copy the following to cite this URL: Thiyagarajan A, Thangarasu V, Sabarimuthu D. Preparation and Physicochemical Characterization of Solid Dispersion of Aceclofenac Formulated by Solvent Evaporation Method. Biosci Biotech Res Asia 2011;8(1). Available from: https://www.biotech-asia.org/?p=9327 |
Introduction
Aceclofenac is an orally administered non- steroidal anti inflammatory drug for the treatment associated with a variety of pain and rheumatoid arthritis conditions (1, 2). These are most frequently prescribed drug worldwide and have been have been categories as ‘over the counter’ drug as well as consumed on non – prescription basis. But the major drawback associated is NSAID toxicity mainly targeted to gastro intestinal tract which can be fatal due to drug –induced toxicity. Though several cases have been reported yet management of this fatal problem has under gone little changes over past 50 years. In Indian context NSAIDs are among the most common drugs responsible for adverse drug reactions seen in clinical practice (3). These side effects of NSAIDs limit their use for a wide population. The major problem is; it causes GI irritation, peptic ulceration with bleeding when present in long time in GI tract and it’s practically insoluble in water and aqueous fluid. Aceclofenac aqueous solubility was found to be 0.53 mg/ml. as such it’s oral is rate limited. The poor aqueous solubility of the drug gives rise to difficulties in the formulation of solid dosage forms and leads poor and variable dissolution rate and oral bioavailability. Among the various methods of enhancement of the dissolution rate and oral bioavailability, solid dispersion technologies were found to be very successful with a number of drugs (4-6). Studies were carried out on solid dispersion of aceclofenac in crosspovidone used as dissolution enhancing carrier with an objective of enhancing the dissolution rate of aceclofenac.
Materials and Methods
Aceclofenac was a gift from Caplin Point Laboratories (Pondicherry, India). Crospovidone, were purchased from Loba Chemie (Mumbai, India). All the other chemicals used were of analytical grade.
Preparation of solid dispersion by solvent evaporation method
Solid dispersions containing aceclofenac and carrier in the proportion of 1:1(F1), 1:2(F2), 1:3(F3), of crosspovidone, were prepared by solvent evaporation method. In this method the solvents employed to dissolve polymers for preparing solid dispersions were methanol to get the clear polymer solution. To this solution of polymers, weighed amounts of aceclofenac were added into boiling test tubes individually. The solvent was allowed to evaporate with at room temperature for 1 h, and then dried at 65° for 6 h in hot air oven. The mass obtained in each case was crushed, pulverized and shifted through mesh No.80. The physical mixtures of aceclofenac were prepared by mixing accurately weighed quantities of drug: carrier in above stated proportions in a glass mortar and shifted through mesh No. 80.
Physicochemical Characterization of solid dispersion
UV spectroscopic study
Ultraviolet spectra were recorded on Shimadzu – 1700 double beam UV – Vis spectrophotometer. The spectra were recorded using methanol as solvent and scanned over the range or 200 – 400 nm at 1nm increments.
Differential scanning calorimeter (DSC Analysis)
DSC was performed using differential scanning calorimeter to study the thermal behaviour of drug alone, physical mixture and solid dispersions. About 10 mg of the samples were heated in sealed aluminium fans pans under nitrogen flow (30 ml/min) at a scanning rate of 5°C/min from 24±1°C to 250°C. Empty aluminium pan was used as a reference.
FTIR Study
Infra red (IR) spectroscopy was conducted using Perkin Elmer spectrophotometer and the spectrum was recorded in the wavelength regions of 4000 to 400 cm-1. The procedure consisted of dispersing a sample (drug alone or mixture of drug and carriers) in KBr and compressed into discs by applying pressure of 5 tons for 5 min in a hydraulic press. The pellet was placed in the light path and the spectrum was recorded.
X ray diffraction study
The X- ray Diffraction pattern of pure drug and optimized solid dispersion were recorded using Philips X ray diffractometer (model: PW 1710) with copper target. The conditions were: voltage -30kV; current -30 mA; scanning speed -1º/min; temperature of acquisition: room temperature; detector: scintallisation counter detector; sample holder: non-rotating holder.
Scanning electron microscopy (SEM)
The surface morphology of pure drug, and optimized solid dispersion were studied by scanning electron microscope (JOEL, JSM-50A, Tokyo, Japan) AT 1600X.The samples were mounded on double sided adhesive tape that has previously been secured on copper stubs and then analyzed. The accelerating voltage was 20 kV.
Drug Content
An accurately weighed amount of powdered aceclofenac solid dispersion (100 mg) was extracted with methanol and the solution was filtered through 0.45 mmembranes (Nune, New Delhi, India). The absorbance was measured at 275 nm after suitable dilution.
Dissolution Study
In vitro dissolution study were conducted using USP apparatus type II (model TDT- 067, Electrolab, Mumbai, India) at 50 rpm using 2% w/v sodium lauryl sulphate in water as a dissolution media maintained at 37° ±0.5°C. Samples were withdrawn at various time intervals, filtered through a 0.45 micron membrane filter, diluted, assayed at 275 nm, using a UV/Visible double beam spectrophotometer. The release studies were conducted in triplicate.
Results and Discussion
UV spectroscopic study
The results of UV spectra of the pure drug and solid dispersion were shown in Figure 1 and 2.respectively. The spectrum of aceclofenac (λ max = 275 nm) and its solid dispersions with carriers (λ max = 276.5 nm) were found to be essentially identical. Small changes in the UV spectra of solid dispersions observed may be due to presence of dissolution enhancing carrier.
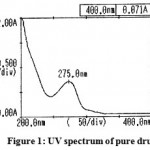 |
Figure 1: UV spectrum of pure drug.
|
Differential scanning calorimeter (DSC Analysis)
The results of DSC studies are given in following figure 3. Pure aceclofenac showed sharp endotherm at 154.49°C corresponding to its melting point. There was no appreciable change in the melting endotherms of the physical mixture (aceclofenac + crosspovidone) as compared to pure drug. However there was slight decrease in the melting point of drug when prepared in the form of solid dispersion. Optimized solid dispersion showed a lowest enthalpy of -97.07 J/g along with a lowest melting point (152.66 ° C). This reduction in melting point and enthalpy accounts for increased solubility and reduced crystallinity of optimized solid dispersion.
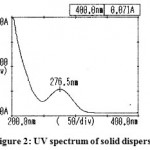 |
Figure 2: UV spectrum of solid dispersion
|
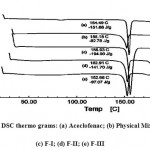 |
Figure 3: DSC thermo grams: (a) Aceclofenac; (b) Physical Mixture; (c) F-I; (d) F-II; (e) F-III
|
FTIR Study
The IR spectra of pure aceclofenac and its solid dispersions are shown in figure 4 to 8. The pure aceclofenac showed major peaks 3319.3, 2970.2, 2935.5, 1716-5, 1589.2, 1506.3, 1479.3, 1344.3, 1280.6, 1255.6, and 665.4 cm-1. The results revealed no considerable changes in the IR peaks of aceclofenac in the physical mixture or in prepared solid dispersions when compared to pure drug thereby indicating the absence of any interaction.
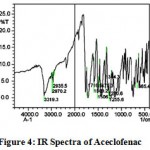 |
Figure 4: IR Spectra of Aceclofenac.
|
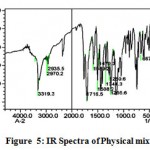 |
Figure 5: IR Spectra of Physical mixture.
|
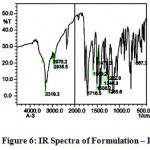 |
Figure 6: IR Spectra of Formulation – I
|
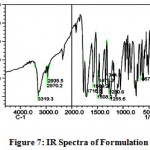 |
Figure 7: IR Spectra of Formulation – II
|
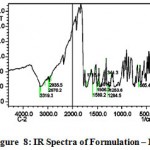 |
Figure 8: IR Spectra of Formulation – III
|
X ray diffraction study
The XRD pattern for drug alone and optimized solid dispersion are shown in figure 9. The XRD scan of plain aceclofenac showed intense peaks of crystallinity; whereas the XRD pattern of optimized formulation exhibited reduction in both number and intensity of peaks compared to plain aceclofenac indicating the decrease in crystallinity or partial amorphization of drug in optimized formulation. The XRD data supports the DSC studies which indicated the decreased crystallinity of drug in the optimized formulations by exhibiting lower values of enthalpy and melting points.
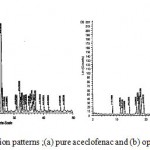 |
Figure 9: X- ray diffraction patterns ;(a) pure aceclofenac and (b) optimized formulation.
|
Scanning electron microscopy (SEM)
The SEM photomicrographs of pure aceclofenac and the optimized formulation are shown
in figure10. The pure aceclofenac was characterized by crystals of bigger size and regular shape with the apparently smooth surface. In contrast, optimized formulation was in the form of fine powder. Additionally, the optimized solid dispersion was fluffy and possess porous and rough surface which might have resulted in the enhanced dissolution rate as compared to pure drug.
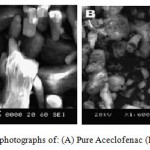 |
Figure 10: SEM photographs of: (A) Pure Aceclofenac (B) Solid Dispersion.
|
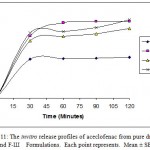 |
Figure 11: The invitro release profiles of aceclofenac from pure drug, F-I, F-II and F-Ш Formulations. Each point represents. Mean ± SE; n=3.
|
Drug Content
The drug content in weighed amount of powder of all the formulations ranged from 95.48 ± 0.02 to 97.68 ± 0.02%. The results were obtained from assay was found to be uniform and are within the official limit as given in Indian Pharmacopeia 2007.
Dissolution Study
The results of the dissolution studies of formulations with pure drug, F-I, F-II and F-III composed of crosspovidone varying drug to carrier ratio, are shown in figure 11. Pure drug, solid dispersions like F-I, F-II and F-III released 47.38%, 89.06%, 80.82% and 91.40% of aceclofenac at the end of 2 hours respectively. It is clear that the dissolution of aceclofenac has improved considerably from crosspovidone solid dispersion as compared to pure drug. The reason for the poor dissolution of pure drug could be poor wettability, and/or agglomeration of particles.
The dissolution rate of aceclofenac solid dispersion (formulation III) could be enhanced markedly higher than pure drug.
Acknowledgements
The authors are very much thankful to his holiness Arulthiru Bangaru Adigalar, President, with respect to Thirumathi V.Lakshmi Bangaru Adigalar, Vice President for providing entire facilities for the research work. The authors are grateful to Dr.Thiyagarajan, Dean Research and Dr.R.Chandramouli, Associate Dean Research, SASTRA University, Thanjavur for his valuable suggestions. We are also thankful to all those who helped us in direct or indirect way to carry out this study successfully.
References
- Brogden R.N. and Wiseman L.R., Drugs, 52,113 (1996).
- Sammour O.A, Hammad M.A, Mefrabc N.A. and Zidan A.S., AAPS Pharm. Sci. Tech., ,7,35 (2006).
- Doomra R. and Gupta SK., Int. J Med Toxicol., 4(1):1-4 (2001).
- Kumar S.G.V. and Mishra D.N., Chem. Pharm. Bull., 54,1102 (2006).
- Barzegar M.J. and Dastmalchi S., Drug Dev. Ind. Pharm., 33,630 (2007).
- Hirasawa N, Ishise S, Miyata H. and Danjo K., Drug Dev.Ind.Pharm., 29,339 (2003)

This work is licensed under a Creative Commons Attribution 4.0 International License.


