

Manuscript accepted on : February 18,
Published online on: 28-06-2011
M. Shekarchi1, F. Khalili2, Y. Mostofi2and H. Hajimehdipoor3*
1Food and Drug Laboratory Research Center and Food and Drug Control Laboratories, MOH & ME, Tehran Iran.
2Department of Horticultural Sciences, College of Agriculture and Natural Resources, Tehran University, Karaj Iran.
3Traditional Medicne & Materia Medica Research Centre, Department of Traditional Pharmacy, Faculty of Traditional Medicine, Shahid Beheshti University of Medical Sciences, Tehran Iran.
Corresponding Author E-mail:hajimehd@tums.ac.ir
ABSTRACT: Numerous epidemiological studies indicate that broccoli protects human being against cancer. It is rich source of antioxidant materials specially flavonoids and vitamin C. In the present investigation, a reversed-phase high-performance liquid chromatographic procedure with UV detection at 245 nm has been developed and validated for the determination of vitamin C in broccoli. The freeze-dried tissues were extracted with mixture of acetic acid, meta-phosphoric acid, sulfuric acid and EDTA. Samples were centrifuged at 12000 rpm for 20 min at 4°C and 20 μl of this extract injected directly into the HPLC system. The HPLC system consisted of Lichrocart column C8 (250ª4.6 mm, 5 μm) and a gradient mode of potassium dihydrogen phosphate 50 mM : methanol which was kept at a flow rate of 0.5 ml/min. The method was validated for selectivity, linearity (r2>0.999), intra-day precision (£ 2.7), inter-day precision (£ 3.0) and accuracy measured by determination of recovery (96-106%). The LOD and LOQ were found 3.0 and 10.1 μg/ml, respectively. Because of speed and accuracy, it may be the UV-HPLC choice for analysis of vitamin C in Brassica oleracea L. var. italica Plenck
KEYWORDS: broccoli; HPLC; validation; vitamin C
Download this article as:| Copy the following to cite this article: Shekarchi, Khalili F, Mostofi Y, Hajimehdipoor H. High Performance Liquid Chromatographic Determination of Ascorbic Acid in Brassica Oleracea L. Var. Italica Plenck. Biosci Biotech Res Asia 2011;8(1) |
| Copy the following to cite this URL: Shekarchi, Khalili F, Mostofi Y, Hajimehdipoor H. High Performance Liquid Chromatographic Determination of Ascorbic Acid in Brassica Oleracea L. Var. Italica Plenck. Biosci Biotech Res Asia 2011;8(1). Available from: https://www.biotech-asia.org/?p=9247 |
Introduction
Vitamin C is a generic term for all compounds exhibiting biological activity of L-ascorbic acid (AA)1,2 It is widely distributed in plants which are used as human diet. It is also known to have many biological functions in collagen synthesis, amino acid metabolism, synthesis of adrenalin, reduction of plasma cholesterol level, enhancement of immune system power, and reduction of singlet oxygen and other free radicals. In according to importance of vitamin C, an accurate and specific determination of the vitamin contents of fruits and vegetables is becoming extremely important to find more about the relationship between human health and this vitamin3. Broccoli inflorescences are widely recognized for their contribution to human nutrition and health benefits. The plant heads are rich of antioxidants specially vitamin C which has been associated with a reduced risk of cardiovascular diseases and several types of cancers4. Significant variations in plant components suggest differences in health-promoting properties of the plant5. Therefore, considering a validated method for quantification of effective compounds is important. Several analytical methods have been developed in the last decades to determine the vitamin C content in fruits and vegetables. One of the most frequently used methods is based on the reduction of the blue dye 2,6-dichlorophenol indophenol by ascorbic acid. This is a simple and fast method, but its use is difficult in colored solutions, due to interference of other oxidizing agents6. Determination of ascorbic acid by means of electrochemical, spectrophotometric, spectrofluorimetric, voltametric and enzymatic methods are also well represented in the literatures1,7,8. Most of these methods, other than HPLC, are time consuming and give overestimates due to the presence of oxidizing species other than AA3. High-performance liquid chromatographic methods that have been developed for the determination of ascorbic acid have some advantages regarding specificity, sensitivity and easy operation9. Reversed phase, bonded-phase-NH2, ion–exchange or ion-pair reversed columns have been the most commonly columns for vitamin C analysis10-16. Ascorbic acid can be easily detected by UV at wave lengths between 245 nm and 254 nm1. Although, UV detectors are usually used in HPLC systems and are simpler and faster than others, but few UV-HPLC methods have been validated to be used for vitamin C quantization in fruits. Most of these methods have been validated in beer, wine and fruit beverages. However, fruits and vegetables are different from the fermented products and have more complex matrices than beverages and so natural compounds could affect on detection or interfere in identification and quantization of AA1. Vitamin C concentration varies greatly among fruits and vegetables so considerable caution should be taken using methods that have been developed for the analysis of the specific plant tissue. AA is easily oxidized by the presence of certain reagents like halogens, hydrogen peroxide, heavy metal ions especially Cu+2, Fe+3 and alkaline pH and unstable in tap water and high temperature. It is known that high temperature and light exposure during extraction, significantly affect on AA recovery in food samples17. Thus it is important to find the effective dissolving agent to ensure that extraction procedure is suitable. Some preserving chemicals such as acetic acid, sulfuric acid and ethylenediaminetetraacetic acid (EDTA) were used in order to prevent AA degradation. Moreover, meta-phosphoric acid (MPA) has been proven to be a useful dissolving agent for the determination of AA for pre-analysis sample stabilization1.
An important factor in HPLC analysis is mobile phase, because it interacts with sample and has a significant influence on separation. Inorganic salts like potassium phosphate containing EDTA at acidic pH, are often used in mobile phase for determination of ascorbic acid in foods and biological fluids1. In the case of ionizable compounds such as vitamin C with acidic structure, pH controlling is very important. So it is possible to use mobile phases like a buffer phosphate solution.
In this investigation, a reliable, reproducible, and sensitive method for detecting ascorbic acid in broccoli inflorescences has been developed and validated.
Materials and Methods
Chemicals
Methanol (HPLC grade), Potassium dihydrogen phosphate, sulfuric acid, EDTA, MPA and acetic acid were obtained from Merck (Darmstadt, Germany). Water used in all experiments was de-ionized. Vitamin C standard material (reference standard) was obtained from Dr Ehrenstorfer Company.
Plant Material
Broccoli (Brassica oleracea L. var. italica Plenck) heads were obtained from a local producer in Tehran, Iran, after commercial harvest and cooled. Broccoli heads were separated from bunches, and similar heads of uniform size and floret color were selected.
Sample and Standard Solutions Preparation
0.5 gram of fresh tissue was ground to a fine powder under liquid N2 and homogenized with 3×10 ml of an ice-cold solution containing 10% acetic acid, 5% MPA, 0.3 N sulfuric acid, and 1 mM EDTA. Then mixture was centrifuged at 12000 rpm for 20 min at 4º C, filtered through PTFE syringe membrane and 20 µL of the final solution were injected into the HPLC system. The standard solutions of ascorbic acid (10-100 µg/ml) diluted with the mobile phase were freshly prepared in brown volumetric flasks.
Chromatographic Conditions
HPLC experiment was performed using a Waters Alliance system equipped with a vacuum degasser, quaternary solvent mixing, auto-sampler and a waters 2996 diode array detector. UV spectra were collected across the range of 200-900 nm, extracting 245 nm for chromatograms. Empower software was utilized for instrument control, data collection and data processing. The analytical column Lichrocart C8 (5 µm particle size, 250 × 4.6 mm) provided excellent separations when 20 µL of the extract were injected with a mobile phase consisting of a mixture of aqueous solution of 50 mM KH2PO4 (pH 2.5): methanol using a linear gradient, starting with a composition of 100% KH2PO4 for 3 min, 55:45% v/v for 16 min, 20:80% v/v for 19 min at a flow rate of 0.5 ml/min.
Validation
The reliability of HPLC method was validated through its linearity, sensitivity, precision and recovery.
Selectivity
For chromatographic method, developing a separation technique involves to demonstrate specificity which is the ability of the method to accurately measure the analyte response in the presence of all interferences18,19. So the extracts obtained from sample preparation were analyzed and the analyte peak (AA) was evaluated for peak purity and resolution from the nearest eluting peak.
Linearity
Due to verification of the normal distribution of the results, linearity was evaluated through the relationship between the concentration of ascorbic acid and the absorbance obtained from UV-HPLC detector. The determination coefficient (r2) was calculated by means of the least- squares analysis. The calibration line was done through two replicates of each concentration of ascorbic acid (10-100 µg/ml) to know the extent of the total variability of the response that could be explained by the linear regression model.
Limit of detection and Limit of quantization
LOD and LOQ were calculated using 3.3σ/s and 10σ/s expressions respectively, which in that σ is the intercept standard deviation and s is the slope of calibration curve18,19.
Precision
The precision of the method indicates the degree of dispersion within a series of determinations of the same sample18,19. Six samples were analyzed in the same day (intra-day) and three consecutive days (inter-day) and the relative standard deviations (RSD%) were calculated. Each sample was injected to HPLC three times.
Recovery
This parameter shows the proximity between the experimental values and the real ones. It ensures that no loss or uptake occurs during the process18,19. The determination of this parameter was performed for the method by studying the recovery after a standard addition procedure with two addition levels. The concentrations of AA added to the samples were 25 and 50 µg/ml. In each additional level, four determinations were carried out and the recovery percentage was calculated in every case. The homogeneity of variances between levels of addition was verified and the mean recoveries of each level were compared using a t-student’s test, the experimental value (texp) was compared to the tabulated value (ttab) for (n-1) degrees of freedom. An average value of both levels could not be considered when texp was upper than ttab.
Results and Discussion
Vitamin C is used as an index for health-related quality of fruits. As compared to other beneficial compounds, it is more sensitive to degradation during processing and storage4. Due to sensitive nature of vitamin C, preparation procedures are designed to avoid loss of the vitamin. In accordance with recovery experiments, lyophilization under liquid N2 prior to extraction was found to be the appropriate procedure for prevention of ascorbic acid decomposition in this experiment. MPA, the most common solvent used in analysis of vitamin C, inhibits L-ascorbic oxidase and metal catalysis and precipitates proteins1. Vitamin C degradation during extraction from broccoli inflorescences was avoided by homogenization of fine powder in the presence of the extraction solvent containing acetic acid, MPA, sulfuric acid and EDTA as preservative. This combination of chemicals showed the less degradation of the vitamin. To improve yields, the ratio of dry material to extraction solvent volume was reduced from 1:20 to 1:100 and the extraction solution was kept on ice during the extraction. Besides the extraction solvent, pH of mobile phase plays an important role in stability and retention time on reverse phase separation. Therefore a mobile phase with pH less than the pKa of ascorbic acid is necessary for reducing of vitamin ionization, which is called ionic suppression. This was obtained by using a 50 mM phosphate buffer pH 2.5. This mobile phase presents the advantage of being cheap, easy and rapid to be prepared. The preparation of aqueous solutions of both MPA and mobile phase with need for adjustment at acidic pH has following problems such as slow dissolution of MPA in water, in accurate weight of MPA because of its hygroscopic effect and time consuming of pH adjustment. Because of that, MPA which has been used in many studies has not been used in mobile phase in this work. Most of techniques have used C18 column for quantization of vitamin C3,4,20-22 but in this research C8 column was chosen for assay of the vitamin. By using above-mentioned condition, the retention time of ascorbic acid peak which was completely separated from unknown peaks was about 6.0 min. The chromatograms of vitamin C standard solution and broccoli sample using UV detection have been shown in figure 1. Identification of ascorbic acid in the samples was made by comparison of the spectra and retention times with those obtained for the standard solutions. Comparison between purity threshold and purity angle reported in EM-power software showed that the method is specific for ascorbic acid and reported peak is completely separated from other interfering compounds. By using this method, vitamin C content of broccoli was found 110 mg/100 g of fresh heads of the plant. The described method has been validated with respect to linearity, accuracy, intra-day and inter-day precision, detection and quantization limits.
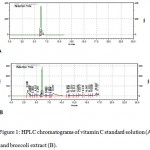 |
Figure 1: HPLC chromatograms of vitamin C standard solution (A) and broccoli extract (B).
|
| RSD%
(inter-day) |
RSD%
(intra-day) |
Mean±SD (intra-day) | Ascorbic acid content (µg/ml) | ||||||
| A6 | A5 | A4 | A3 | A2 | A1 | ||||
| 3.0 | 2.7 | 18.1±0.5 | 17.4 | 18.1 | 18.7 | 18.6 | 17.8 | 18.1 | Day 1 |
| 2.4 | 18.9±0.5 | 18.2 | 19.2 | 18.7 | 19.5 | 18.9 | 19.1 | Day 2 | |
| 2.3 | 17.9±0.4 | 17.6 | 17.3 | 17.8 | 18.1 | 17.9 | 18.5 | Day 3 | |
The standard curves constructed daily from peak areas versus vitamin C concentrations (10-100 µg/ml) were linear (y=3091.4x+18507, r2=0.9995). To ascertain the suitability of the linear calibration model, the residuals plotted versus concentrations which showed reasonable scatter of data (Figure 2). Furthermore, the intercept corresponded to acceptance limits (±2% of <Y> target value) hence the linearity of calibration model confirmed. The overall LOD and LOQ were found 3.0 and 10.1 µg/ml respectively. To verify the precision and repeatability of the method, the results obtained from six repeated experiments on real sample at target concentration in one day (intra-day) and three consecutive days (inter-day) were analyzed (table 1). The results of intermediate precision using different analysts, different instruments and on different days showed that these parameters have no significant effect on the results variation (data didn’t show). After validation studies, the ability of the method to provide good quantization in our laboratory was confirmed. Accuracy which was evaluated as recovery after spiking the plant samples with standards at two concentration levels ranged between 96-106% (Table 2). As the texp (4.8) obtained from statistical analysis was upper than ttab (1.9), the recovery has been reported as a range.
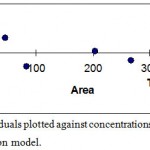 |
Figure 2: Residuals plotted against concentrations of vitamin C in calibration model.
|
| Mean Recovery ± SD | Recovery% | Found (µg/ml) | Added (µg/ml) |
| – | – | 18.1 | 0 |
| – | 17.8 | ||
| – | 18.6 | ||
| – | 18.7 | ||
| 104.0±1.7 | 104.8 | 45.4 | 25 |
| 102.1 | 44.2 | ||
| 106.0 | 45.9 | ||
| 103.2 | 44.7 | ||
| 98.3±1.6 | 97.1 | 66.3 | 50 |
| 99.7 | 68.1 | ||
| 99.7 | 68.1 | ||
| 96.8 | 66.1 |
This methodology has proven to be satisfactory with respect to selectivity, speed and accuracy. It is simple, convenient and applicable to the routine determination of ascorbic acid in different broccoli samples. Unlike many methods which have been reported, this method has the advantages of requiring minimal sample preparation and no solute derivatization. It takes approximately 20 min for elution of ascorbic acid.
References
- Odriozola-Serrano I., Hernández-Jover T. and Martín-Belloso B., Food Chem., 105, 1151 (2007).
- Albuquerque B., Lidon F. C. and Leitão A. E., Gen. Appl. Plant Physiol., 31, 247 (2005).
- Gökmen V., Kahraman N., Demir N. and Acar J., J. Chromatogr. A., 881, 309 (2000).
- Singh J., Upadhyay A. K., Prasad K., Bahadur A. and Rai M., J. Food Comp. Anal., 20, 106 (2007).
- Kurilich A. C., Tsau G. J., Brown A., Howard L., Klein B. P., Jeffery E. H., Kushad M. M., Wallig M. A. and Juvik J. A., J. Agr. Food Chem., 47, 1576 (1999).
- Official Methods of Analysis, Association of Official Analytical Chemists, 13th Ed.,Washington DC, (1980).
- Liu T. Z., Chin N., Kiser M. D. and Bigler W. N. Clin. Chem., 28, 2225 (1982).
- Sánchez-Mata M. C., Cámara-Hurtado M., Díez-Marqués C. and Torija-Isasa M. E., Eur. Food Res. Technol., 210, 220 (2000).
- Gökmen V. and Acar J., Fruit Process., 5, 198 (1996).
- Wimalasiri P. and Wills R., J. Chromatogr., 256, 368 (1983).
- Veltman R. H., Kho R. M., van Schaik A. C. R., Sanders M. G. and Oosterhaven J., Postharvest Biol. Tec., 19, 129 (2000).
- Rizzolo A., Brambilla A., Valsecchi S. and Eccher-Zerbini P., Food Chem., 77, 257 (2002).
- Furusawa N., Food Control., 12, 27 (2001).
- Arakawa N., Otsuka M., Kurata T. and Inaka C., J. Nutr. Sci. Vitaminol., 27, 9 (1981).
- Nelis H. J., De Leenheer A. P., Merchie G., Lavens P. and Sorgeloos P., J. Chromatogr. Sci., 35, 337 (1997).
- Madigan D., McMurrough I. and Smyth M. R., Anal. Commun., 33, 9 (1996).
- Gregory J. F., Vitamins, Marcel Dekker, New York, (1996).
- Shekarchi M., Hajimehdipoor H., Khanavi M., Adib N., Bozorgi M. and Akbari-adergani B., Phcog. Mag., 6, 13 (2010).
- Hajimehdipoor H., Shekarchi M., Khanavi M., Adib N. and Amri M., Phcog. Mag., 6, 154 (2010).
- Ismail A. and Fun ChS., Mal. J. Nutr., 9, 31 (2003).
- Moreno D. A., López-Berenguer C. and García-Viguera C., J. Food Sci., 72, S64 (2007).
- Rodríguez-Comesaña M., García-Falcón M. S. and Simal-Gándara J., Food Chem., 79, 141 (2002).

This work is licensed under a Creative Commons Attribution 4.0 International License.


