

Manuscript accepted on : December 08, 2010
Published online on: 28-12-2010
Phytochemical and Biological Studies of the Aerial Parts of Carissa Edulis Growing In Saudi Arabia
Hanan Al-youssef1 and Wafaa H. B. Hassan1,2*
1Department of Pharmacognosy, Faculty of Pharmacy, King Saud University, Riyadh Saudi Arabia. 2Department of Pharmacognosy, Faculty of Pharmacy, Zagazig University, Zagazig Egypt. Corresponding Author E-mail:wafhassan2004@yahoo.com
ABSTRACT: In this study we aimed to isolate and characterize the different chemical constituents of the aerial parts of Carissa edulis in addition to investigate the biological activities including anti-inflammatory, diuretics and the effect on cardiovascular system. Chemical investigation of the aerial parts of Carissa edulis afforded eleven compounds, chlorogenic acid -1- ethyl ether-1-methyl ester (1), caffeic acid methyl ester (2), kaempferol (3), quercetin- 3-O-glucoside-7, 3‘, 4‘ trimethyl ether (4), rutin (5), pinitol (6), b-amyrin (7), lupeol (8), stigmasterol glucoside (9), b –sitosterol (10) and b –sitosterol glucoside (11). The structures of compounds 1-6 were unambiguously established by using UV, 1D and 2D NMR spectroscopy and MS spectrometry. This is the first report of isolation of compound 1 from nature. The biological study of the different extracts showed that the butanol extract exerted higher anti-inflammatory effect than ethyl acetate and aqueous extracts. Also the chloroform extract showed the highest diuretic effect. On the other hand, the aqueous extract exerted a significant decrease in the arterial blood pressure at a dose of 200 mg/kg while the petroleum ether extract produced the highest decrease in heart rate at the same dose.
KEYWORDS: Carissa edulis; chlorogenic acid derivative; flavonoids; phenolic compounds
Download this article as:| Copy the following to cite this article: Al-Youssef H, Hassan W. H. B. Phytochemical and Biological Studies of the Aerial Parts of Carissa Edulis Growing In Saudi Arabia. Biosci Biotech Res Asia 2010;7(2) |
| Copy the following to cite this URL: Al-Youssef H, Hassan W. H. B. Phytochemical and Biological Studies of the Aerial Parts of Carissa Edulis Growing In Saudi Arabia. Biosci Biotech Res Asia 2010;7(2). Available from: https://www.biotech-asia.org/?p=8987 |
Introduction
Family Apocyanaceae is represented in Saudi Arabia by seven genera among them genus Carissa including Carissa edulis (Atiqur Rahman et. al., 2003 and 2004). Several classes of chemical constituents have been isolated from genus Carissa such as, sesquiterpenes, cardiac glycosides, phenolic compounds and lignans (Kirara et al., 2006, Pal et al., 1975, and Wangteeraprasert et al., 2009). Carissa edulis (Forssk) Vahl belongs to family Apocyanaceae, the plant parts are used in ethno medicine for wide variety of illnesses such as headache, chest complaints, gonorrhoea, rheumatism, rabies, oedema and as a diuretic (Nedi et al., 2004). Carissa edulis is used also as remedy for fever, sickle cell anemia, oedema, cough, ulcer, toothache and worm infestation (Ibrahim 1997, Ibrahim et al., 2005, and 2007). In addition, Carissa edulis showed anticonvulsant, hypoglycemic and antiviral activities (Ya`u et al 2008, El Fiky et al, 1996 and Tolo et al, 2006). Chemical constituents isolated from Carissa edulis include 2-hydroxyacetophenone (Bently et al, 1983) phenolic compounds, insoluble proanthocyanidins, lignans; sesquiterpenes of the eudesmane and germacrane derivatives, sterols, tannins, cardiac glycosides and flavonoids have been isolated (Ya`u et al, 2008, Nedi et al., 2004, Achenbach et al., 1983, 1985). This paper aims to identify the chemical constituents as well as to investigate the biological activities of the different extracts of the aerial parts of Carissa edulis growing in Saudi Arabia and this led to isolation of eleven compounds (1-11) with phenolic, triterpenoid and steroid structures. This is the first report of compound 1 in nature and the first report of compounds 2, 4 and 6 in Carissa edulis. The study led to confirmation of folk use of the plant parts in ethno medicine as diuretic and in treatment of oedema as the chloroform and aqueous extracts produced a significant increase in urine output by 54.5% and 45.4% at a dose of 1g/kg respectively. The anti-inflammatory effect of the extracts justified the use of the plant in treatment of toothache.
Materials and methods
General experimental procedures
Evaporation of solvents was done under reduced pressure using a Buchi rotatory evaporation, model 011. Ultraviolet absorption spectra were obtained in methanol on a Unicam Heyios α UV-Visible spectrophotometer. The ultraviolet lamp, Mineralight® device, multiband UV-254/366 nm, was used for visualization of spots and zones on TLC plates. Optical rotations were measured on a Perkin-Elmer 241 Mc polarimeter, using a one-decimeter tube. 1H and 13C NMR spectra of the isolated compounds were recorded in deuterated solvents as MeOD or DMSO-d6 on a Bruker DRX-500 and JEOL spectrometer, operating at 500 MHz for proton and 75 MHz for carbon. Standard Bruker and JEOL programs were used for generating 1D-NMR (1H-NMR, 13C-NMR, DEPT) and 2D-NMR (COSY, HSQC, and HMBC) experiments. EI-MS were measured using an EI Finnigan model 4600 quadrupole system spectrometer. Melting points were determined with a digital melting point apparatus electro-thermal , LTD, England and were uncorrected.
Plant material
The aerial parts of Carissa edulis forssk vahl (Apocynaceae) were collected in 2008 from Aqubat Tanouma Baljorashi, southern region of Saudi Arabia. The plant was kindly identified by Dr. M. Atiqur Rahman, Professor of taxonomy, college of pharmacy, King Saud University. A voucher specimen (#14151) was deposited in the herbarium of the Research Center for Medicinal, Aromatic and Poisonous Plants of the same college.
Extraction and isolation
Air-dried powdered aerial parts of the Carissa edulis forssk vahl (1.2 kg) was extracted exhaustively with 95% ethyl alcohol. The total crude extract (150 g) was suspended in a mixture of water: methanol (1:1) and then fractionated sequentially with petroleum ether (3x1L), chloroform (3x1L), ethyl acetate (3x1L), and n-butanol (3x1L). All the extracts were pooled, concentrated and dried in vacuum to yield 2.0 g of petroleum ether extract, 1.8 g chloroform extract, 16.0 g of ethyl acetate extract, 15.7 g of n-butanol extract and the aqueous extract left was lyophilized to yield 114.0 g. All the extracts were monitored by TLC.
The ethyl acetate extract (16.0 g) was chromatographed on a normal silica gel column elution was started with hexane and ethyl acetate mixture (8:2), the polarity was increased until 100% ethyl acetate, followed by methanol in a gradient elution technique. A total of 150 fractions of 200 ml each were collected and the similar fractions were pooled. Two main fractions, with three major spots, were further purified by re- chromatography on normal silica gel column, using hexane and ethyl acetate mixture (6:4) as eluent, the polarity was increased until 100% ethyl acetate, followed by methanol in a gradient elution technique to give by crystallization from methanol, 20 mg of (1) Rf 0.69 [CHCl3 : MeOH (8.5 :1.5)], 80 mg of (2) Rf 0.56 [CHCl3 : MeOH (8 : 2)] and 40 mg of (3) Rf 0.9 [EtOAc : MeOH: H2O (30 : 5 : 4)].
The butanol extract was chromatographed over a Sephadex LH-20 column and eluting with methanol. A total of 45 fractions, 20 ml each, were collected and similar fractions were pooled together. Two main fractions, with three major spots, were repeatedly chromatographed on silica gel column yielded 15 mg of (4) Rf 0.43 [EtOAC: MeOH : H2O (30:5:4)], 30 mg of (5) Rf 0.38 [(EtOAc:MeOH : H2O (30:5:4)] and 20 mg of (6) Rf 0.36 [Butanol : Acetic acid : H2O (2.4:1:1)].
According to TLC behavior, the chloroform extract showed similar chromatographic pattern as petroleum ether extract. Both extracts were combined and evaporated to yield dark a green residue (3.8 g). The combined extracts were applied on top of silica gel column eluting with hexane only, gradually increasing the percentage of ethyl acetate up to 100%. A total of 60 fractions of 150 ml each were collected and were pooled on the basis of similar TLC pattern. The important fractions were subjected to chromatographic separation to yield five compounds (7-11).
Compound 1
A Yellow powder, Rf 0.69 [CHCl3 : MeOH (8.5 : 1.5)], UV λmax (MeOH) 339 and 301 nm; [α]25D is -29.3 (c= .004g/L, MeOH); 1H NMR and 13C NMR (MeOD) Table 1; EIMS m/z 234 [M-caffeoyl moiety]+ and 164 [M-quinic acid derivative]+; HMBC correlations Figure 3.
Compound 2
Yellow crystals, Rf 0.56 [CHCl3 : MeOH (8:2)], EIMS m/z (rel. int %) 194 (25); UV λmax (MeOH) 323 and 311 nm; 1H NMR and 13C NMR (MeOD) Table 1; HMBC correlations Figure 3.
Compound 3
Yellow needle crystals, Rf 0.9 [EtOAc : MeOH: H2O (30:5:4)]. UV λmax (MeOH) 251, 264, 320, 367 + NaOMe 276, 315, 413 + AlCl3 260sh, 265, 301, 345, 422 + AlCl3/HCl 255, 267, 303, 347, 422 + NaOAc 272, 301, 385 + NaOAc/H3BO3 265, 297 sh, 317sh, 370; EIMS m/z (rel. int %) 286 (34), 153 (45) and 121 (65); 1H NMR and 13C NMR (MeOD) Table 2.
Compound 4
yellow crystals, Rf 0.43 [EtOAC: MeOH : H2O (30:5:4)]; UV λmax (MeOH) 254, 304sh , 363 + NaOMe 260, 286, 323, 383 + AlCl3 275, 278sh, 296, 374, 400sh + AlCl3/HCl 276, 280, 360, 403sh + NaOAc 252, 365, 414sh + NaOAc/H3BO3 250, 304, 361, 420sh; EIMS m/z (rel. int %) 344 (22) [M-glucose]+; 1H NMR and 13C NMR (MeOD) Table 2; HMBC correlations Figure 3.
Compound 5
yellow crystals, Rf 0.38 [(EtOAC:MeOH : H2O (30:5:4)]; EIMS m/z (rel. int %) 302 (35) [M-(glucose+ rhamnose)]+; UV λmax (MeOH) 258, 267sh, 299, 361 + NaOMe 273, 322, 411 + AlCl3 275, 303sh, 353, 431 + AlCl3/HCl 272, 300sh, 364, 403 + NaOAc 272, 297, 350sh, 407 + NaOAc/H3BO3 265, 297sh, 389; 1H NMR and 13C NMR (MeOD) Table 2; HMBC correlations Figure 3.
Compound 6
A yellow powder, Rf 0.36 [Butanol : Acetic acid : H2O (2.4:1:1)]. EIMS m/z (rel. int %) 194 (30); 1H NMR (MeOD): δ 4.20 (1H, m, H-4), 4.10 (1H, m, H-1), 4.10 (1H, m, H-6), 4.00 (1H, m, H-5), 3.80 (1H, m, H-2), 3.50 (1H, m, H-7), 3.40 (1H, m, H-3).
13C NMR (MeOD): δ 83.4 (C-3), 71.9 (C-1, C-4), 71.2 (C-5, C-6), 69.5 (C-2), 58.3 (C-7); HMBC correlations Figure 3.
Compounds 7-11
20 mg of (7), m.p.196-197oC (methanol), Rf = 0.95 [(Chloroform :methanol (9:1)]; 20 mg of (8), m.p. 215-216˚C (methanol), Rf = 0.94 [(Chloroform :methanol (9:1)]; 10 mg of (9), m.p. 169-170˚C (methanol), Rf = 0.60 [(Chloroform :methanol (9:1)]; 40 mg of (10), m.p. 140–142˚C (methanol), Rf = 0.88 [(Chloroform :methanol (9:1)] and 10 mg of (11), m.p. 286-287˚C (methanol), Rf = 0.62 [(Chloroform :methanol (9:1)], These compounds were identified directly by comparison of mp and Rf with authentic samples using thin layer chromatography and Co- thin layer chromatography.
Biological studies
Animals
Wistar rats were maintained in a standard environmental condition and fed with standard laboratory rat diet and water ad libitum. The rats were acclimatized to our laboratory conditions for a week before the experiments.
Anti-inflammatory effect
Inflammation was induced in the paws of rats by injection of 0.2 ml carragenan (2% in water) into the rat’s paw. The paw was marked at the ankle and its volume was measured using a plythesmometer before injection of carragenan and thereafter hourly. Maximum inflammation was seen after 2 hours.
Study of the anti-inflammatory activity
Rats were divided into 2 groups, one group served as a control and one group for each of the five extracts, petroleum ether, chloroform, ethyl acetate, butanol and aqueous. The organic extracts were suspended in 0.25% sodium carboxymethyl cellulose. Each extract was injected in a dose of 500 mg/kg intra-peritoneal. Carragenan was injected 60 minutes later. Paw volumes were then measured at one hour intervals. The % inhibitions were calculated. Data are expressed as the difference between the final and the initial right hind paw volume (Vi-Vf) or as the percentage increase in the volume of the right hind paw (Winter et al, 1962).
Vi – Vf / Vi x 100
Effects on cardiovascular system
A- Blood pressure and Heart rate
A rat weighing 250-270 gm of either sex is anesthetized by urethane 1.75 gm/kg (25% conc.). Carotid artery is cannulated with 21 G cannula which is attached to a strain G age coupler type 7179 through a transducer 4/8 DUL. The device is connected to NARCO Physiograph (NARCO TRACE 40) where both the blood pressure and heart rate is recorded. The vein is also cannulated with a 21 G cannula through which the drug and substances under test is injected.
B- Electrocardiogram ECG
A rat weighing 250-270 gm is anesthetized by Urethane. ECG is recorded by PROGETTI medical equipment. ECG machine is recorded by five electrodes displayed as follows: LF1, RF2, RA3, LA4, chest5. The extract is injected intrapretonial, the record is taken at 5 minutes intervals.
Diuretic activity
A rat weight 200-250 g is placed in a metabolic cage (TECHNI PLAST – ITALY, 170022) for 24 hours where urine is collected for both controls which is given saline only and test which is given the extract under test. Both volumes of urine are recorded, (Nedi, T., et al, 2004).
Statistical analysis
Results were expressed as % decrease and Mean + SEM where applicable. Statistical significance was tested using Student`s t-test. The difference was taken to be statistically significant at p<0.05.
Results and discussion
Phytochemical study
The biologically active extracts (petroleum ether, chloroform, ethyl acetate, butanol and aqueous) of Carissa edulis were subjected to series of chromatographic separation steps which yielded eleven compounds (1-11).
Compound 1
It has UV absorbance at λmax (MeOH) 339 and 301 nm; [α]25D – 29.3 (C = 0.04, MeOH) and gave positive reaction with FeCl3 indicating the phenolic nature. The EIMS showed peaks at m/z 234 [M-caffeoyl moiety]+ corresponding to C10H17O6 and 164 [M-quinic acid derivative]+ for C9H7O3. Its 13C NMR and DEPT data (Table 1) displayed the presence of nineteen carbon signals. Nine carbon signals (four singlet and five doublets) were typical for caffeoyl moiety and ten signals for quinic acid derivative. The 1H NMR spectrum exhibited three signals for ABX spin system as doublet at δH 7.12 , doublet at 6.82 and double of doublet at δH 6.93 for H-5`, H-8` and H-9` respectively, together with two doublet signals for trans olefinic protons at δH 6.25 and 7.60 for H-2` and H-3` respectively J = 16.0 Hz. Furthermore the 13C NMR singlet signals at δC 169.2, 128.3, 147.6 and 147.2 for C-1`, C-4`, C-6` and C- 7` respectively and doublet signals at δC 116.2, 147.2, 115.7, 115.7 and 123.5 for C-2`, C-3`, C-5`, C-8` and C-9`. In addition to the mass fragment at m/z 164 confirmed the presence of caffeoyl moiety. The above data with H-H-COSY experiment were in a good agreement with the presence of 6`, 7`-dihydroxy-trans-caffeoyl moiety (Fomum et al., 1986, Berregi et al., 2003 and Hoeneisen et al., 2003). The other NMR data (Table 1) were typical for quinic acid-1- methyl ester as it showed eight carbon signals at δC 74.4, 76.8, 70.1, 38.4, 67.3, 38.2, 176.1 and 53.5 for C-1, C-2, C-3, C-4, C-5, C-6, C-7 and C-8 respectively and proton signals at δH 4.20, 3.70, 1.90/2.02 (2H, m), 5.35, 2.29/ 2.04 (2H, m) and 3.80 (3H, s) for H-2, H-3, H-4, H-5, H-6 and H-8 respectively. The NMR data showed extra signals at δ H 4.10 (2 H, q, J= 7.2 Hz) and 1.12 (3H, t, J= 7.2 Hz) attached to carbons at δC 63.5 t and 14.5 q for ethyl group. The NMR assignment supported by selected HMBC correlations shown in figure 3 plus those reported in Table 1. Caffeoyl moiety was verified from H-C correlations of H-3` with C-1`, H-2` with C-1` and C-4`, likewise quinic acid methyl ester fragment was based on H-C correlations from H-8 to C-7, H-6 to C-7, H-4 to C-6, H-3 to C-5, H-5 to C-3. The interconnection of the two moieties was estimated from HMBC correlation from H-5 to C-1` and the position of the ethyl group at C-1 of quinic acid was deduced from correlations of H-9 to C-1 and H-10 to C-9. Based on the above data compound 1 was identified as chlorogenic acid 1- ethyl ether-1-methyl ester, It is the first report of this compound in nature. The chlorogenic acid derivatives have been previously shown antioxidant and hepato-protective activities (Basnet et al., 1996, Chuda et al., 1996, Azuma et al., 1999, Xiang et al., 2001 and Tran et al., 2006).
Compound 2
It gave blue color with FeCl3. The EIMS showed a molecular ion peak at m/z 194 [M+] which is comparable with a molecular formula C10H10O4. The 1H NMR spectrum of compound 2 revealed an ABX spin system (Table 1) at δH 6.80 (d, J= 2.0 Hz), 7.06 (dd, J= 2.0, 8.0 Hz) and 6.96 (d, J= 8.0 Hz ) assignment for H-2, H-6 and H-5 respectively. Furthermore, 1H NMR spectrum showed a relatively downfield trans-doublet protons at δH 7.50 (1H, d, J=16.0 Hz) and δ 6.25 (1H, d, J= 16.0 Hz ) for H-7 and H-8, was ascribed to be olefinic protons which indicated the presence of a dihydroxyl-trans cinnamoyl moiety. All the above spin systems were confirmed by H-H-COSY spectrum. Another signal at δH 3.78 (3H) for methoxy group was determined. The 13C NMR spectrum showed resonances for ten carbons, five methines, four quaternary and one methyl. The assignment of all carbons was determined from HMQC, HMBC and DEPT. The position of the methoxy group was estimated to be at C-10 from H-C long range correlation of -OCH3 with C-9 (carbonyl group). By searching in the literature for different caffeic acid derivatives, it was identified as caffeic acid methyl ester (Hoensein et al., 2003). This is the first report for isolation and identification of this compound from Carrisa edulis.
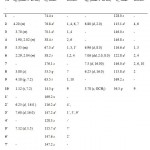 |
Table 1: NMR data of compounds 1 and 2.
|
| *Compound 2 | *Compound 1 | |||||||
| HMBC | δC , mult. | δH, (mult. J in Hz) | HMBC | δC, mult. | δH, (mult. J in Hz) | No. | ||
| – | 128.0 s | – | – | 74.4 s | – | 1 | ||
| 4, 6 | 115.1 d | 6.80 (d, 2.0) | 1, 4, 6, 7 | 76.8 d | 4.20 (m) | 2 | ||
| – | 146.0 s | – | 1, 4 | 70.1 d | 3.70 (m) | 3 | ||
| – | 146.8 s | – | 2, 6 | 38.4 t | 1.90, 2.02 (m) | 4 | ||
| 1, 3 | 116.6 d | 6.96 (d, 8.0) | 1, 3, 1′ | 67.3 d | 5.35 (m) | 5 | ||
| 2, 4 | 122.8 d | 7.06 (dd, 2.0, 8.0) | 1,2, 4 | 38.2 t | 2.29, 2.04 (m) | 6 | ||
| 2, 6, 10 | 146.0 d | 7.5 (d, 16.00) | – | 176.1 s | – | 7 | ||
| 2 | 115.8 d | 6.25 (d, 16.0) | 7 | 53.5 q | 3.80 (s) | 8 | ||
| – | 169.2 s | – | 1, 10 | 63.5 t | 4.10 (q, 7.2) | 9 | ||
| 9 | 56.5 q | 3.78 (s, OCH3) | 9 | 14.5 q | 1.12 (t, 7.2) | 10 | ||
| – | 169.2 s | – | 1` | |||||
| 4`, | 116.2 d | 6.25 (d, 16.0 ) | 2` | |||||
| 1`, 5`, 9` | 147.2 d | 7.60 (d, 16.0) | 3` | |||||
| -` | 128.3 s | – | 4` | |||||
| 7` | 115.7 d | 7.12 (d, 1.5) | 5` | |||||
| 2` | 147.6 s | 6` | ||||||
| – | 147.2 s | – | 7` | |||||
| 4`, 6` | 115.7 d | 6.82 (d, 8.0) | 8` | |||||
| 5`, 7` | 123.5 d | 6.93 (dd, 8.0, 1.5) | ||||||
Compound 3
It is a flavonol in nature as indicated by its physical and chemical properties as well as from UV spectra. The UV spectral data with shift reagents (Mabry et al., 1970) suggested the presence of 3, 5, 7, 4` tetrahydroxyflavonol. The EIMS exhibited a parent ion peak at m/z 286 in accordance with the molecular formula C15H10O6 suggesting a tetrahydroxyflavonol. Other Mass fragments at m/z 153 and 121 indicated the presence of two hydroxyl groups at ring A and one hydroxyl at ring B, respectively. Comparing the physical and spectral data of compound 3 (Table 2) with those reported in the literature for kaempferol (Abdel-Ghani et al., 2001, Mabry et al., 1970 and Al-youssef et al, 2008), indicating that they are similar. Kaempferol is a common flavonol in many plants and it has been reported to have an antitumor and antifungal activities (Abdel-Ghani et al., 2001).
Table 2: 1H and 13C NMR data of compounds 3-5.
| No. | *Compound 3 | *Compound 4 | *Compound 5 | |||
| δH (mult. J in Hz) | δ C mult. | δH (mult. J in Hz) | δ C mult. | δH (mult. J in Hz) | δ C mult. | |
| 2 | 147.8 s | 156.2 s | 158.6 s | |||
| 3 | 136.0 s | 133.5 s | 135.6 s | |||
| 4 | 176.2 s | 176.2 s | 179.5 s | |||
| 5 | 161.0 s | 162.0 s | 163.0 s | |||
| 6 | 6.19 (d, 1.8 ) | 98.5 d | 6.60 (d, 1.8 ) | 101.0 d | 6.08 (br.s) | 98.9 d |
| 7 | 164.2 s | –
OCH3 3.92 (s) |
164.0 s
56.9 q |
166.1 s | ||
| 8 | 6.44 (d, 1.8 ) | 93.8 d | 6.30 (d, 1.8 ) | 93.7 d | 6.26 (br.s) | 95.0 d |
| 9 | 156.5 s | – | 156.0 s | 159.4 s | ||
| 10 | 103.4 s | – | 103.9 s | 106.7 s | ||
| 1` | 122.0 s | – | 121.5 s | 123.1 s | ||
| 2` | 8.04 (d, 8.8 ) | 129.8 d | 6.72 (d, 2.0 ) | 118.0 d | 7.62 (br.s) | 116.1 d |
| 3` | 6.92 (d, 8.8 ) | 115.8 d | –
OCH3 3.82 (s) |
149.0 d
56.5 q |
– | 149.8 s |
| 4` | – | 159.5 s | –
OCH3 3.84 (s) |
147.0 s
56.6 q |
– | 148.7 s |
| 5` | 6.92 (d, 8.8 ) | 115.8 d | 6.48 (d, 9.0 ) | 116.7 d | 6.76 (d, 8.5 ) | 117.7 d |
| 6` | 8.04 (d, 8.8 ) | 129.8 d | 7.40 (dd, 2.0, 9.0 ) | 118.8 d | 7.48 (d, 8.5 ) | 123.6 d |
| OH | 12.5 (br. s) | – | – | – | ||
| 1“ | – | – | 4.50 (d, 6.5 ) | 101.8 d | 5.12 (d, 7.5 ) | 103.3 d |
| 2“ | – | – | 3.26 (m) | 74.5 d | 3.10 (m) | 76.9 d |
| 3“ | – | – | 3.20 (m) | 75.1 d | 3.40 (m) | 78.0 d |
| 4“ | – | – | 3.15 (m) | 71.6 d | 3.04 (m) | 72.3 d |
| 5“ | – | – | 3.22 (m) | 78.2 d | 3.70 (m) | 77.9 d |
| 6“ | – | – | 3.40, 3.60 (m) | 62.5 d | 3.40, 3.60 (m) | 68.7 d |
| 1“` | – | – | – | – | 4.16 (d, 8.0 ) | 102.4 d |
| 2“` | – | – | – | – | 3.70 (m) | 71.8 d |
| 3“` | – | – | – | – | 3.30 (m) | 72.1 d |
| 4“` | – | – | – | – | 3.30 (m) | 74.1 d |
| 5“` | – | – | – | – | 4.00 (m) | 69.7 d |
| 6“` | – | – | – | – | 1.11 (3H, d, 7.0 ) | 18.1 q |
Compound 3 in DMSO-d6, Compounds 4 and 5 in MeOD
Compound 4
was obtained as yellow crystals that analyzed for C24 H30O12. On acid hydrolysis gave aglycone and sugar moiety. The EIMS showed fragment at m/z 344 for [M+-glucose], UV spectral data with shift reagent indicated the presence of 3, 7, 3`, 4` tetra-substituted flavonol (Mabry et al, 1970). The 1H NMR data (Table 2) exhibited a characteristic resonance for ABX spin system for ring B at δH 6.72 (d, J= 2.0 Hz), 6.48 (d, J= 9.0 Hz) and 7.40 (dd, J= 2.0, 9.0 Hz) for H-2`, H-5` and H-6` respectively as well as resonance for two meta coupled protons at δH 6.60 (d, J= 1.8 Hz) and 6.30 (d, J= 1.8 Hz) for H-6 and H-8 respectively. The sugar was identified as D-glucose from acid hydrolysis and from 1H NMR spectrum which showed signal at δH 4.50 (d, J= 6.5 Hz) for anomeric proton and CH2OH signal at δH 3.40 and 3.60 (m), as well as, the 13C NMR signals at δC 101.8 (d) and 62.5 (d) for H-1“ and CH2-6“ respectively. The position of glucose moiety was estimated from HMBC correlation of H-1“ with C-3 (δC 133.5). The presence of the methoxy groups at C-7, C-3` and C-4` was confirmed from the HMBC correlations of the CH3-7 with C-7 at δC 164.0, CH3-3` with C-3` at δC 149.0 and CH3-4` with C-4` at δC 147.0. The above data were in full agreement with those reported for quercetin- 3-O-glucoside-7, 3`, 4` trimethyl ether (Abdel-Ghani et al., 2001, Harborne et al., 1975 and Gohar 2002). This is the first report for isolation of this compound from Carrisa edulis.
Compound 5
was obtained as yellow granules that analyzed for C27 H30O15. On acid hydrolysis it gave an aglycone and two sugars. Glucose and rhamnose were detected in aqueous hydrolysate by paper chromatography and co-chromatography with reference samples. The EIMS showed a molecular ion peak at m/z 302 [M-(glucose + rhamnose)]+. UV spectral data with shift reagents (Mabry et al., 1970) suggested the likely presence of flavonol with free hydroxyl groups at 5, 7, 3` and 4` positions. The 1H NMR spectra showed signals at δH 6.08 (br.s), 6.26 (br.s), 7.62 (br.s), 6.76 (d, J= 8.5 Hz) and 7.48 (d, J= 8.5 Hz) indicating the presence of quercetin skeleton. The 1H NMR signals at δH 5.12 (d, J= 7.5 Hz) and 4.16 (d, J= 8.0 Hz) in addition to 13C NMR signals at δC 103.3 (d) and 102.4 (d) indicating the presence of two sugar moieties. The two sugar moieties were deduced to be glucose and rhamnose from the presence of one signal at δH 1.11 (3H, d, J= 7.0 Hz) on carbon signal at δC 18.1 for the methyl group of rhamnose and other signal at δH 3.40, 3.60 (each 1H, m) on carbon signal at δC 68.7 for CH2OH group of glucose, in addition to the other 13C NMR and 1H NMR signals (Table 2) and by acid hydrolysis. Glycosidation at position C-3 was proved from HMBC correlations of the anomeric proton H-1“ with signals at δC 135.6 (C-3) and δC 77.9 (C-5“). The position of α-rhamnose was confirmed to be attached to C-6“at β-glucose from the downfield shift of C-6“ at δC 68.7 and from HMBC correlation of the anomeric proton H-1“` at δH 4.16 with C-6“. That fact confirmed the presence of 3-O-rutinoside. The above spectral data of compound 5, in conjugation with comparison of UV and NMR data with literatures were in a good agreement with those reported for rutin (Abdel-Ghani et al., 2001, Markham et al., 1978 and Mabry et al., 1970).
Compound 6
Compound 6 has molecular formula C7H14O6 as deduced from EIMS [M+] at m/z 194. By comparison of NMR data, mp. and optical rotation of this compound with literatures (Singelton and Hoberg, 2009 and Abdoulaye et al, 2004) compound 6 was deduced to be pinitol. This is the first report from genus Carissa.
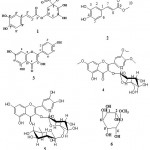 |
Table 1: Results of diuretic effect of carissa edulis extracts.
|
Compounds 7-11
Identification of compounds 7-11 was done by TLC and Co-TLC with authentic (Fig. 2).
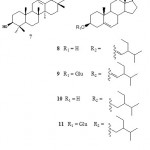 |
Table 2: Results of diuretic effect of carissa edulis extracts.
|
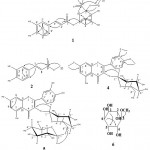 |
Figure 3: Important HMBC correlations of compounds 1, 2 and 4-6.
|
Biological study
Anti-inflammatory effect
The net volume of oedema was measured in both control and treated animals 2 hours following injection. Percentage of oedema inhibition produced by extracts was calculated in (Table 3). The anti-inflammatory effects were exerted only by ethyl acetate, butanol and aqueous extracts. The butanol extract exerted the highest anti-inflammatory effect.
Table 3: Results of anti-inflammatory assay.
| Treatment group (500mg/kg, i.p) | Net volume of oedema two hours after carragenan | % inhibition of inflammation |
| Control | 3.6 ± 0.3 cc | ——— |
| Pet. ether | 3.7 ± 0.4 cc | ——— |
| Chloroform | 3.8 ± 0.5 cc | ——— |
| Ethyl acetate | 1.8 ± 0.05* cc | 50 ± 1.3 |
| Butanol | 1.2 ± 0.1* cc | 66.6 ± 0.9 |
| Aqueous | 1.56 ± 0.08* cc | 56.6 ± 1.7 |
| p< 0.05, compare with control | ||
Effects on cardiovascular system
Effect on blood pressure and heart rate
Most of the cardiovascular depressant activity is found in petroleum ether, ethyl acetate and aqueous extracts only. These extracts, at a dose of 0.05g/kg, produced a perceptible fall in arterial pressure by 27.2, 27 and 9.1 mmHg respectively. Increasing the dose to 0.1g/kg produced more depression of blood pressure by 36.3, 34.5 and 32.7 mm Hg respectively. At a higher dose, 0.2g/kg, there was a severe and profound fall of blood pressure by 52.7 and 63.7 mmHg in case of petroleum ether and aqueous extracts respectively. The butanol extract, at doses 0.1 and 0.2 g/kg caused a decrease in arterial pressure by 27.2 mmHg (Table 4). Also, the percentage decrease in heart rate was more pronounced in petroleum ether than aqueous extract at a dose-dependent manner (Table 4). On the other hand, the ethyl acetate and butanol extracts have not shown any change in heart rate. Most of the cardio-depressant activity seemed to be contained in the petroleum ether, ethyl acetate and aqueous extracts at a dose dependent manner while butanol extract has not shown any significant decrease in arterial pressure at higher dose. It would be evident from above that the petroleum ether, ethyl acetate and aqueous extracts of Carissa edulis possess a marked potency for lowering the blood pressure in rats at a dose-dependent manner.
Table 4: A- Effects of Carissa edulis on the cardiovascular system (Mean and % of decrease in arterial pressure).
| Extract | Decrease in Arterial pressure mmHg | % Decrease in heart rate | ||||
| Dose mg/kg | 50 | 100 | 200 | 50 | 100 | 200 |
| Pet. ether | 27.2 | 36.3 | 52.7 | 18.5 | 22.2 | 45.8 |
| Ethy lacetate | 27 | 34.5 | — | — | — | — |
| Butanol | — | 27.2 | 27.2 | — | — | 3.4 |
| Aqueous | 9.1 | 32.7 | 63.7 | 6.4 | 12.9 | 20.8 |
Electrocardiogram (ECG)
ECG is a record of the electric currents (voltages, potentials) produced by the heart obtained by means of metal electrodes placed on the surface of the body. The percentage decrease in conduction velocity of heart was shown by petroleum ether, chloroform and ethyl acetate which was more pronounced in petroleum ether by 33% at 1.0 g/kg where as 25% for chloroform and 14.3% for ethyl acetate at a dose of 0.4 and 1.0 g/kg respectively after 20 minutes. Also, the force of conduction is decreased by 50% and 66% after 10 and 20 minutes respectively in petroleum. ether extract. However, the butanol and aqueous extracts did not show any change in force of conduction (Table 5), however may possess effects of direct cardiac depressant drugs like anti-fibrillation drugs, general anesthetics drugs, etc., which causes slow conduction in the myocardium, reduce the arterial pressure as well as decrease in heart rate.
Table 5: B- Effects of Carissa edulis extracts on the cardiovascular system.
| Extracts and Doses (gm/kg, i.p) | Percentage decrease in conduction velocity of heart | |
| After 10 minutes | After 20 minutes | |
| Pet. ether 1g/kg * | 20% | 33% |
| Chloroform 0.4g/kg** | 22.8% | 25% |
| Ethyl acetate 1g/kg** | 9.5% | 14.3% |
| Butanol 1g/kg** | 5.2% | 0 |
| Aqueous 1g/kg** | 15% | 20 |
* with decrease in force of conduction by 50 and 66 respectively.
** no effect on force of conduction.
Diuretic activity
The diuretic activity of different extracts of C. edulis in a dose of 1g/kg i.p. was studied in comparison with a control group using normal saline in rats. The petroleum ether and ethyl acetate extracts showed slightly effect on the urine output by 9.1% and 12.7% respectively. While chloroform and aqueous extracts produced a significant increase in urine output by 54.5% and 45.4% at a dose of 1g/kg respectively, Table 6. The results of this study indicated that C. edulis extracts contain compound (s) that mediate effect by increasing in blood flow in the kidneys and increasing in the glomerular filtration rate resulting in increase urine output and act as a diuretic action. The present results support the ethno medical and traditional use of Carissa edulis as a diuretic agent. Also a previous study has been proved that this plant has a significant effect on urine output. However, this study also showed a decreased in urine output in butanol extract at a dose of 1g/kg i.p. by 45.4% when comparison to control group. Further experimentation is needed in order to understand the precise mechanism of action from the diuretic effect of the different extracts.
Table 6: Results of diuretic effect of carissa edulis extracts.
| Extracts & dose (1g/kg, i.p) | Urine volume after 24 hrs /ml | Percentage change | |
| Control | 5.5 | ——- | |
| Pet. ether | 6 | ↑9.1% | |
| Chloroform | 8.5 | ↑54.5% | |
| Ethyl acetate | 6.2 | ↑12.7% | |
| Butanol | 3 | ↓45.4% | |
| Aqueous | 8 | ↑45.4% | |
Acknowledgments
We would like to express our deep feeling of gratitude to Prof. Dr. Azza El- Shafae for her helps and also for Dr. Adnan Al- Rehaily for supplying us with plant material. Our special thanks to the stuff members of the Central laboratory at the College of Pharmacy, KSU.
References
- Abdel-Ghani A.E., Hafez S.S., Abdel Aziz E.M. and El-Shazely A.M., Alex. J. Pharm. Sci., 15, 103-8 (2001).
- Abdoulaye A., Moussa I., Keita D.A. and Ikhiri, K., C. R. Chimie., 7, 989-91 (2004).
- Achenbach H., Waible R. and Addae-Mensah I., Phytochemistry, 22, 2325-8 (1983).
- Achenbach H., Waible R. and Addae-Mensah I., Phytochemistry, 24(10), 749-53 (1985).
- Al-youssef, H.M., Murphy B.T., Amer, M.E., Abdel-kader M.S. and Kingston D. J., S. P. J., 16: 122-34 (2008).
- Anderson D., Basaran N., Dobrzynka M.M., Basaran A.A. and Tian W.Y., Teratog. Carcinog. Mutagen., 17, 45- 58. Through C.A., 127, 201-283 (1997).
- Atiqur Rahman M., Mossa J. S., Al-Said M.S. and Al-yahya M.A., Saudi J. Biol. Sci., 10 (2), 158-67 (2003).
- Atiqur Rahman M., Mossa J.S., Al-Said M.S. and Al-Yahya M.A., Fitoterapia, 75, 149-161 (2004).
- Azuma K., Nakayama M., Koshioka M., Ippoushi K., Yamaguchi Y. , Kohata K., Yamauchi Y., Ito H. and Higashio, H., J. Agricul. and Food Chem., 47, 3963–6 (1999).
- Basnet P., Matsushige K., Hase K., Kadota S., Namba T., Biol. Pharm. Bull. 19, 1479–84 (1996).
- Bentley M.D., Brackett S.R., Chapya A., J. Nat. Prod. 47, 1056–7 (1984).
- Berregi I., Santos J.I., Campo G., Miranda J.I. and Aizpurua J.M., Analytica Chimica Acta, 486, 269–274 (2003).
- Chuda Y., Ono H., Ohnishi K.M., Nagata T. and Tsushida T., J. Agricul. and Food Chem., 44, 2037–9 (1996).
- El-Fiky F.K., Abo-Karam M.A. and Afify E.A., J. Ethnopharmacol., 50, 43-47 (1996).
- Fomum Z.T., Ayafor J.F., Wandji J., Fomban W.G. and Nkengfack A.E., Phytochemistry, 25, 757-759 (1986).
- Gohar A.M., Z. Naturforsch. 57c, 216- 20 (2002).
- Harborne J.B., Mabry T.J. and Mabry H., “The flavonoids”, Academic press, New York San Francisco, A subsidiary of Harcourt Brace Jovanovich, Publishers, 46-77 (1975).
- Hoeneisen M.J., Alarcon P., Aqueveque M., Bittner J., Becerra M. S. and Jakupovic J., Z. Naturforsch., 58, 39-41 (2003).
- Ibrahim H., Pharmacognostical and Biological (Analgesic Activity) Studies of Carissa edulis Vahl. Ph.D. Thesis. Ahmadu Bello University, Zaria, Nigeria., p. 232 (1997).
- Ibrahim H., Bolaji R.O., Abdurahman E.M., Shok M., Ilyas N. and Habib A.G., Chem. Class. J., 2, 15-8 (2005).
- Ibrahim H., Abdulrahman E.M., Shok M., Ilyas N., Musa K.Y. and Ukandu I., Afr. J. Biotech., 6, 1233-5 (2007).
- Kirira P.G., Rukungo G.M., Wanyonyi A.W., Gathinwa J.W., Muthaura C.N., Omar S.A., Tolo F., Mungai G.M. and Ndiege I.O., J. Ethnopharmacol., 106 , 403-407 (2006).
- Mabry T.J., Markham K.R. and Thomas M.B., The systematic identification of flavonoids; Springer-Verlag, NewYork, Hedelberg-berlin. (1970).
- Markham K.R., Tetrahedron, 34, 1389-1397 (1978).
- Nedi T., Mekaconnen N. and Urga K., J. Ethnopharmacol., 95, 57-61 (2004).
- Pal R., Kulshreshtha D. and Rastoqi R.P., Phytochemistry, 14, 2302-3 (1975).
- Singleton J. and Hoberg J. O., Chiro-inositols in organic chemistry. Mini-Reviews in Organic Chemistry, 6, 1-8 (2009).
- Tolo F.M., Rukungo G.M., Muli F.W., Njagi E.N., Njue W., Kumon K., Mungai G.M., Muthaura C.N., Muli G.M., Keter L.K., Oishi E. and Kofi-Tsekpo M.W., J. Ethnopharmacol., 104 , 92-9 (2006).
- Tran M.H., Minkyun N., Phuongthien T., Nguyen D., Dau E., Kyung S., Yeon H. S. and Kihwan B., J. Ethnopharmacol., 108, 188-192 (2006).
- Wangteeraprasert R. and Likhitwita Y.K., Helvetica Chemica Acta, 92,1217-23 (2009).
- Winter C.A., Risley E.A. and Nuss G.W., Proc. Soc. Expt. Biol. Med., 111, 544-7 (1962).
- Xiang T., Xiong Q.B., Ketut A.I., TezukaY., Nagaoka T., Wu L.J. and Kadota S., Planta Medica, 67, 322–5 (2001).
- Ya`u J., Yaro A.H., Abubakar M.S. and Hussaini I.M., J. Ethnopharmacol., 120, 255- 8 (2008).

This work is licensed under a Creative Commons Attribution 4.0 International License.


