

Manuscript accepted on : September 17, 2010
Published online on: 28-12-2010
N. Adib1, M. Shekarchi1*, A. Dabirsiaghi2, H. Hajimehdipoor1, H. Rastegar1 and B. Akbari- Adergani1
1Food and Drug Lab Research Center, Ministry of Health, Tehran Iran. 2Department of Pharmaceutics, School of Pharmacy, Azad University of Medicinal Sciences, Tehran Iran.
ABSTRACT: A simple, rapid and sensitive isocratic reversed-phase high performance liquid chromatography method for the determination of repaglinide in human plasma has been developed. After protein precipitation with acetonitrile chromatographic analysis of repaglinide in plasma was achieved on a μ-bondapack C18 column using acetonitrile- methanol- potassium dihydrogen phosphate 0.01 M (51: 11: 38) mixture, pH 2.5, as mobile phase. The flow rate was set at 1.5 ml/min and the emission and excitation were 348 and 244 respectively. The lower limit of detection was 1 ng/ml and lower limit of quantization was 5ng/ml. The intra and inter-day precisions (CV %) of the quality control samples were 1.43- 3.29 and 1.14- 4.11% respectively. The recovery of method was %98.3 ± 1.08. The method was applied to a bioequivalence study in human.
KEYWORDS: Repaglinide; Human plasma; HPLC; Bioequivalence
Download this article as:| Copy the following to cite this article: Adib N, Shekarchi M, Dabirsiaghi A, Hajimehdipoor H, Rastegar H, Adergani B. A. A New HPLC Method for Determination of Repaglinide in Human Plasma and Its Application in Bioequivalence Studies. Biosci Biotechnol Res Asia 2010;7(2) |
| Copy the following to cite this URL: Adib N, Shekarchi M, Dabirsiaghi A, Hajimehdipoor H, Rastegar H, Adergani B. A. A New HPLC Method for Determination of Repaglinide in Human Plasma and Its Application in Bioequivalence Studies. Biosci Biotechnol Res Asia 2010;7(2). Available from: https://www.biotech-asia.org/?p=8881 |
Introduction
Ropinirole is a non-ergoline dopamine agonist which indicated for the treatment of the signs of idiopathic Parkinson’s disease and restless legs syndrome (RLS), the other being pramipexole (Mirapex). It acts as a D2, D3, and D4 dopamine receptor agonist with highest affinity for D3. It is weakly active at the 5-HT2, α2 receptors and is said to have virtually no affinity for the 5-HT1, benzodiazepine, GABA, muscarinic, α1, and β-adreno receptors. Ropinirole binds to opiate receptors with low affinity; however, studies show that this weak opiate activity has no consequences at pharmacological doses in vivo.
The antiparkinson activity of this drug is believed to be due to its stimulatory effects on central postsynaptic dopamine D2 receptors within the caudate-putamen. In particular, attenuates the motor deficits induced by lesioning the ascending nigrostriatal dopaminergic pathway with the neurotoxin 1-methyl-4-phenyl-1,2,3,6-tetrahydropyridine (MPTP) in primates. The relevance of D3 receptor binding in Parkinson’s disease is unknown. 1-4.
Ropinirole is rapidly absorbed with median peak concentrations occurring within 1.5 hours after oral dosing. Despite complete absorption, absolute bioavailability of ropinirole is reduced to approximately 50% as a result of first-pass metabolism. Relative bioavailability from a tablet compared to an oral solution is 85%. Over the therapeutic dose range, Cmax and AUC values increase in proportion to the increase in dose. Ropinirole is extensively metabolized by the liver with cytochrome P450 CYP1A2, and at doses higher than clinical, is also metabolized by CYP3A4. At doses greater than 24 mg, CYP2D6 may be inhibited, although this has only been tested in vitro. The major metabolic pathways are N-des propylation and hydroxylation to form the inactive N-despropyl metabolite and hydroxy metabolites. The N-despropyl metabolite is converted to carbamyl glucuronide, carboxylic acid and N-despropyl hydroxy metabolites. The hydroxy metabolite of ropinirole is rapidly glucuronidated. Plasma protein binding is up to approximately 40%. The mean blood-to-plasma ratio of the drug is 1:1 (range, 1.0 to 1.2). Ropinirole is widely distributed throughout the body, with an apparent volume of distribution of 7.5 L/kg (cv = 32%). The average oral clearance is approximately 47 L/h (range 17 to 113 L/h) and is constant over the entire dosage range. The terminal elimination half-life is approximately 6 h (range 2 to 27 h) and the volume of distribution at steady-state is approximately 480 L (range 216 to 891 L) or 7 L/kg (range 3.1 to 12.9 L/kg). Less than 10% of the administered dose is excreted as unchanged drug in urine. N-despropyl is the predominant metabolite found in urine (40%), followed by the carboxylic acid metabolite (10%), and the glucuronide of the hydroxy metabolite (10%). The mean elimination half-life of ropinirole is approximately 6 hours (range, 2 to 10 hours). 5,6 Several spectrophotometric, spectrofluorometric, HPLC, HPTLC, LC-MS, LC/MS/MS and LC-ESI-MS/MS methods have been reported for the analysis of ropinirole in pharmaceutical dosage forms, 7-13 and in human plasma. 14,15 The aim of this study was to develop a simple, rapid, sensitive and reliable HPLC method with UV detection for quantization of ropinirole in human plasma samples. The method was validated according to procedures and acceptance criteria based on FDA guideline and recommendations of ICH, to provide enough selectivity, sensitivity and reliability in pharmacokinetic and bioequivalence studies.
Materials and Methods
Acetonitrile, methanol (HPLC grade), potassium dihydrogen phosphate, tri-fluro acetic acid (analytical grade), were purchased from Merck. Ropinirole and quinidine were USP reference standard.
Sample and standard solutions preparation
To a 100 µl aliquot of plasma, 50 µl methanol-water (50:50v/v), 50 µl quinidine (10ng/ml) as internal standard and 200 µl phosphate buffer (0.5 M pH=12) were added and vortexed to mix. The mixture was centrifuged at 3500 rpm for 5 min and transferred organic layer to another tube. Solvent evaporated under air with 40 oC and the residuals were dissolved in 150 µl mobile phase and 50µl of it was injected to the instrument. Stock solutions of ropinirole and internal standard were prepared as 1 mg/ml for both. Working solutions were prepared by diluting the stock solution with mobile phase. The final concentration of internal standard in plasma was 300 ng/ml and the spiked plasma samples were subjected to the sample preparation procedure and injected to HPLC.
Instrument and chromatographic conditions
Analyses were performed on a Younglin model ACME-900 pump equipped with a Lab science USA UV detector. Chromatography was performed at room temperature on a µ-bondapack C18 column (5 µm particle size, 150 × 4.6 mm I.D.). The mobile phase consisted of methanol- trifluoroacetic acid 0.1% (78:22 v/v) mixture. The flow rate was set at 1 ml/min. The eluent was detected at 245 nm.
Method validation
Validation was accomplished through determination of specificity, recovery, linearity, quantization limit, precision and accuracy.16,17 Specificity was investigated by analyzing six drug-free plasma samples for interference of endogenous compounds. For calibration curve five different concentrations of ropinirole (0.5-50 ng/ml) in plasma were prepared by adding required volume of working solutions to blank plasma. Plasma calibration curve was prepared by taking area ratio of analyte to internal standard as Y-axis and concentration of analyte (ng/ml) as X-axis. Linearity of the standard curve was evaluated using least-squares linear regression analysis. Quantization limit was defined as the lowest ropinirole concentration that could be determined with mean value deviation and coefficient of variation less than 20%, using five plasma samples. The intra and inter-day precisions (CV %) were determined by trice analysis of quality control plasma samples (1, 5 and 20 ng/ml) at the same day and three different days. Recovery was determined by comparing the response of three pre-treated quality control plasma samples in three levels (0.5, 2.5, 10 ng/ml) with the absolute peak area of un-extracted samples containing the same concentration of the drug as 100%.
Application
The validated method was used in bioequivalence study of ropinirole. It was an open, randomized crossover study to asses relative bioavailability of drug in twelve healthy volunteers following single dose administration of ropinirole as 5 mg tablet (All subjects gave informed consent to the work). Test preparation was ropinirole 5 mg tablet manufactured by an Iranian pharmaceutics Co. The tablet (Requip) containing 5 mg of ropinirole, manufactured by GlaxosmithKlin was used as reference preparation. The blood collecting times were 0, 0.5, 0.75, 1, 1.5, 2, 2.5, 3, 4, 6, 8, 12 and 24 h after oral administration of 5 mg ropinirole reference and test. The plasma samples were analyzed by the described method. The pharmacokinetic parameters like area under the plasma-concentration-time curve from time zero to the last measurable ropinirole sample time and to infinity (AUC0-t and AUC0-inf), maximum concentration (Cmax) and time to maximum concentration (Tmax) were determined for the period of 0 to 24 h.
Statistical analysis
The analysis of variance was performed on data for differences between and within the subspecies using the ANOVA (SPSS ver. 10). Mean separations were determined by least significant difference (LSD) at P ≤0.05%.
Results and Discussion
Some spectrophotometric, spectrofluorometric, HPLC, HPTLC, methods have been developed for determination of ropinirole in pharmaceutical dosage form, but few methods have been developed for quantization of ropinirole in plasma (LC-MS ,LC/MS/MS ,LC-ESI-MS/MS HPLC, voltammetry and LC-MS-MS).7-15 One of the challenging aspects of method development in quantitative analysis is the complexity of the analysis methods. The simpler the method the better it could be conducted by different operators and in different labs. However other parameters of a quantitative method such as accuracy and precision demand more complex processes. The proposed method is suitable for ropinirole quantization in plasma samples. It showed specificity, since no interfering peaks from endogenous components of plasma were observed. Representative chromatogram of blank plasma, spiked plasma with ropinirole and internal standard are shown in figure 1. Retention time for the internal standard and ropinirole were 7.1 and 9.7 min, respectively. Three dimensional and contour plot views of the chromatograms also confirmed the complete separation. The method was linear over the range of 0.5 to 50 ng/ml, (y=0.0275x-0.0033, r2=0.998).
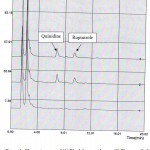 |
Figure 1: Chromatograms of (1) Blank human plasma; (2) Plasma spiked with quinidine (rt=7.1 min) and ropinirole (rt=9.7 min); (3) Human plasma after administration of ropinirole tablet.
|
The limit of detection (LOD) and quantization (LOQ) were 0.2, 0.5 ng/ml respectively. The intra and inter-day precisions (CV %) of the quality control samples were 1.11-3.58 and 2.42-3.89% respectively (table 1). The accuracy of this bio-analytical method was %97.05±0.68. (Table2). It can be concluded that the accuracy and precision of ropinirole satisfied the acceptance criteria, and the proposed analytical method gave reproducible intra- and inter-day precision. The above mentioned method was used in the plasma analysis of a bioequivalence study of ropinirole as described earlier. The mean plasma level of ropinirole for test and reference preparation after the oral administration of a 5 mg single dose of ropinirole in 12 health human volunteers are given in Fig 2. Maximum plasma concentration (Cmax) ranged from 9.29 to 13.21 ng/ml at 2.5 to 3 h (Tmax). Also the mean value of area under the concentration time curve (AUC0-t) obtained was 63.00 ng h/ml. AUC o-inf was found to be 64.89 ng h/ml. Statistical comparison of the AUC0-inf, Cmax and Tmax clearly indicated no significant difference between test and reference, 5 mg tablets, in any of the calculated pharmacokinetic parameters and these values are entirely within the bioequivalence acceptance range of 80-125%. Therefore, this analytical method is applicable to pharmacokinetic studies.
Table 1. Precision of method
| Spiked Ropinirole hydrochloride(ng/ml) | Observed Concentration* | |||
| Intra day | %RSD | Inter day | %RSD | |
| 1
5 20 |
0.947±0.03
4.96±0.05 19.78±0.23 |
3.58
1.11 1.19 |
0.99±0.03
4.88±0.19 20.07±0.48 |
3.23
3.89 2.42 |
* Mean of five values
Table 2: Recovery of method
| Drug Labled claim (5mg) | Added (mg) | Found (mg)* | Mean% Recovery |
| Ropinirole hydrochloride | 0.5
2.5 10 |
0.47±0.03
2.47±0.05 9.75±0.23 |
94.91±1.02
98.78±0.23 97.46±0.81 |
* Mean of five values
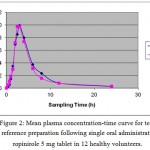 |
Figure 2: Mean plasma concentration-time curve for test and reference preparation following single oral administration of ropinirole 5 mg tablet in 12 healthy volunteers. |
The main advantage of this method is the use of precipitation for purification, which is easily and fast in comparison with other purification and extraction methods. This HPLC method is reliable, reproducible and sensitive with respect to validation parameters. It can be used as an assay method in the study of ropinirole pharmacokinetics as well as bioavailability/ bioequivalence studies.
References
- Nashatizadeh M.M., Lyons K.E. and Pahwa R., Clin. Interv. Aging, 4: 179-186 (2009).
- Stocchi F., Hersh B., Scott B., Nausieda P. and Investigators L., Curr. Med. Res. Opin., 24(10):2883-95(2008).
- Chitnis Sh., Expert Opin. Drug Metabol. Toxicol., 4:655-664(2008).
- Bogan R., Expert Opin. Pharmacother., 9: 611-23(2008).
- Tompson D. and Oliver-Willwong R., Clin. Neuropharmacol., 32(3):140-8(2009).
- Tompson D. and Vearer D., Clin. Ther., 29(12):2654-66(2007).
- Onal A., Caglar S., Chem. Pharm. Bull.,5:629-631(2007).
- Onal A., Chromatographia, 64 (7-8): 459-461(2006).
- Susheel J. V., Malathi S., Ravi T.K.,. Ind. J. Pharm. Sci., 69:589-590(2007).
- Azeem A., Igbal Z., Ahmad F.J., Khar R.K., Talegaokar S., Acta Chromatographica 20: 95-107(2008).
- Aydogmus Z, Spectrochim Acta A Mol Biomol, 70(1):69-78 (2008).
- Sreekanth N., Ch.Babu R. and Mukkanti K., Int. J of pharmacy and pharmaceutical sciences, 1: 186-192(2009).
- Aydogmus Z.,AAPS J, 2206; 8 (4); E709-717.
- Bhatt J., Jangid A. Shetty R., Shah B., Kambli S., Subbaiah G. and Singh S., J. Pharm. and Biomed Anal., 40(5):1202-1208 (2006).
- Bharathi D.V., Jagadeesh B., Kumar S.S., Lakshmi R.N., Hotha K.K., Naidu A., Mullangi R. Biomed. Chromatog., Biomed Chromatogr. 23(5):557-62(2009).
- Adib N., Shekarchi M., Dabirsiaghi A., Hajimehdipoor H., Rastegar H. and Akbari-Adergani B., Bioscience, Biotechnology Research Asia., 7/2 : 603-606 (2010).
- Adib, N., Shekarchi M., Kobarfard F., Piralih Hamedani M., Bioscience,Biotechnology Research Asia.; 5/2: 583-586 (2008).

This work is licensed under a Creative Commons Attribution 4.0 International License.


