

Manuscript accepted on : March 09, 2010
Published online on: 28-06-2010
Detection of Acute Toxicity of Mercury Chloride in Yellowfin Sea Bream (Acanthopagrus Latus)
Aliakbar Hedayati1*, Alireza Safahieh1, Ahmad Savari1 and Jasem Ghofle Marammazi2
1Department of Marine Biology, Faculty of Marine Science, University of Marine science and Technology, Khorramshahr Iran.
2South Iranian Aquaculture Research Center, Ahwaz Iran.
ABSTRACT: Toxicity tests allow the determination of pollution effects, providing direct evidence of the biological responses of marine organisms to contaminants. The 96-h LC50 tests are conducted to measure the susceptibility and survival potential of organisms to particular toxic substances such as heavy metals. Hg2+ tested concentrations were 20, 50, 100, 200, 500, 1000, 2000, 5000 and10000 μg/l, Groups of six male yellow fine sea bream (120 g) were exposed for 96 h to each of the Range Finding Test for LC50, in fiberglass tank equipped with aeration with 100 l of test medium. According to Range Finding Test (fifty percent of mortality between 500 and 1000) another tested concentration 550, 650, 750, 850 and 950 μg/l, Groups of six male yellow fine sea bream were exposed for 96 h to each of the LC50 96h for test solutions. 24 h, 48 h, 72 h and 96 h LC50 were 962.75 886.48, 886.48 and 648.86 respectively. The 96 h NOEC, LOEC and LC50 were 500, 550 and 648.86 μg/l respectively. LC50 values indicated that mercury is more toxic to A. latus. LC50 obtained in the present study compare with corresponding values that have been published in the literature for other species of fish, show different LC50 of mercury in different species and even different time, but what is important, lower value of LC50 for A. latus compare with most species and confirm sensitively of A. latus to low mercury doses.
KEYWORDS: NOEC, LOEC; LC50; Mercury Chloride; Acanthopagrus latus
Download this article as:| Copy the following to cite this article: Hedayati A, Safahieh A, Savari A, Marammazi J. G. Detection of Acute Toxicity of Mercury Chloride in Yellowfin Sea Bream (Acanthopagrus Latus).Biosci Biotechnol Res Asia 2010;7(1) |
| Copy the following to cite this URL: Hedayati A,Safahieh A, Savari A, Marammazi J. G. Detection of Acute Toxicity of Mercury Chloride in Yellowfin Sea Bream (Acanthopagrus Latus).Biosci Biotechnol Res Asia 2010;7(1).Available from: https://www.biotech-asia.org/?p=8871 |
Introduction
Aquatic ecosystems are typically monitored for pollution of heavy metals using biological assays. Aquatic organisms have been reported to accumulate heavy metals in their tissues several times above ambient levels. Fishes have been used for many years to determine the pollution status of water, and are thus regarded as excellent biological markers of metals in aquatic ecosystems.
Heavy metals have long been recognized as serious pollutants of the aquatic environment. They cause serious impairment in metabolic, physiological and structural systems when present in high concentrations in the milieu (Tort, 1987).
Mercury (Hg) is a liquid metal at ambient temperatures and pressures. It forms salts in two ionic states mercury (I) and mercury (II). Mercury (II), or mercuric salts, are much more common in the environment than mercury (I) or mercurous salts. These salts, if soluble in water, are bioavailable and considered toxic. Mercury also forms organometallic compounds, many of whichhave industrial and agricultural uses (Boening, 2000).
Mercury in fish was already recognized as a public health and ecological problem in the 1960’s. It was commonly assumed that local point sources (industrial effluent, utility emissions, fungicide applications) were the main sources, and many studies focused on waters with nearby point source contamination.
Although mercury chloride is not the most toxic mercury compound in the marine environment (Boudou and Ribeyre, 1997), it is the key form between the gaseous metal form transported through atmosphere and the methylmercury form that bioaccumulates in organism. Once it enters into the organism, mercury can draw various immunotoxic effects.
Toxicity tests allow the determination of these effects, providing direct evidence of the biological responses of marine organisms to contaminants. Due to the fact that organisms from different species vary in their sensitivity towards chemical substances, it is difficult to set standards for protection of species with regard to pollutants in the environment. Extrapolation from one species to another is, therefore, difficult if their relative sensitivities are not known (Van Straalen et al., 1994).
The 96-h LC50 tests are conducted to measure the susceptibility and survival potential of organisms to particular toxic substances such as heavy metals. Higher LC50 values are less toxic because greater concentrations are required to produce 50% mortality in organisms (Eaton et al. 1995). The heavy metals that are toxic to many organisms at very low concentrations and are never beneficial to living beings are mercury, cadmium and lead (Hilmy et al. 1985).
The present study was conducted to determine the acute toxicity of the heavy metal compound HgCl2 in a statistic system to the marine fish Acanthopagrus latus. This species was selected for bioassays because it can easily be raised under laboratory conditions. It fulfills most of the requirements of a model species and is available throughout the year.
Material and Method
Ninety six yellow fine sea bream all immature male in same size (120 g final body weight average) were obtained from Mahshahr creeks with hooks in a Upon capture, (only healthy fish, as indicated by their activity and external appearance, were used in the experiments) the fish were maintained alive on board in a fiberglass tank and on return to shore transferred to a 300-L aerated vat filled with sea water for transport back to the nearby laboratory. In laboratory Fish maintained in a seawater re-circulatory system (300-L tanks) equipped with physical/biological filters and with aeration to the Mariculture Research Station of the South Iranian Aquaculture Research Center, Mahshahr, Iran from October to November.
All samples were acclimated for one weeks in a 15 aerated fiberglass tank containing 46 ppt saltwater maintained at 25 C under a constant 12:12 L:D photoperiod. Acclimatized Fish were fed daily with a live feed (fresh shrimp) and daily we check water quality and water parameters. Dead fish were immediately removed with special plastic forceps to avoid possible deterioration of the water quality.
LC50 is the ambient aqueous chemical activity causes 50% mortality in an exposed population. These calculations are based on two important assumptions. The first assumption is that the exposure time associated with the specified LC50 is sufficient to allow almost complete chemical equilibration between the fish and the water. The second assumption is that the specified LC50 is the minimum LC50 that kills the fish during the associated exposure interval. Fortunately, most reliable LC50 ‘ satisfy these two assumptions (Neely, 1984).
Hg2+ tested concentrations were 20, 50, 100, 200, 500, 1000, 2000, 5000 and10000 µg/l, Groups of six male yellow fine sea bream (120 g) were exposed for 96 h to each of the Range Finding Test for LC50, in fiberglass tank equipped with aeration with 100 l of test medium. The control group was exposed to filtered sea water in similar conditions.
The bioassay was performed in a temperature (25 ± 1 _C) and under a natural photoperiod (12hL: 12hD) controlled room. Test medium was not renewed during the assay and no food was provided to the animals. Values of pH, Temperature, and salinity were measured at time 0, 24, 48, 72 and 96 h.
At the end of the bioassay (Boyd and Tucker 1992), Range values were determined and according to that (fifty percent of mortality between 500 and 1000) another tested concentration 550, 650, 750, 850 and 950 µg/l, Groups of six male yellow fine sea bream (100 g) were exposed for 96 h to each of the LC50 96h for test solutions in same condition with Range Finding Test. At the end of the bioassay, LC50 96h values were determined (de Aguiar et al., 2004).
LC value and standard error SE of LC were calculated following the probit procedure method as described by Wardlaw 1985. The LC10,30,50,70,90 values are derived using simple substitution probit of 10,30,50,70 and 90 respectively for probit of mortality in the regression equations of probit of mortality vs. mercury. The 95% confidence limits for LC50 are estimated by using the formula LC50 (95% CL) = LC50 ± 1.96 [SE (LC50)]. The SE of LC50 is calculated from the formula: ![]() Where: b=the slope of the mercury/probit response (regression) line; p=the number of mercury used, n = the number of animals in each group, w = the average weight of the observations (Hotos and Vlahos. 1998) (table 1).
Where: b=the slope of the mercury/probit response (regression) line; p=the number of mercury used, n = the number of animals in each group, w = the average weight of the observations (Hotos and Vlahos. 1998) (table 1).
Table 1: The 95% confidence limits for LC50 of yellowfin sea bream.
| Concentration (µg/l) | 24h | 48h | 72h | 96h |
| b | 0.012 | 0.002 | 0.002 | 0.009 |
| p | 5 | 5 | 5 | 5 |
| n | 6 | 6 | 6 | 6 |
| W | 120 | 120 | 120 | 120 |
| SE | 1.38 | 8.33 | 8.33 | 1.85 |
| 95% CL | 3.5868 | 16.3268 | 16.3268 | 3.626 |
Acute toxicity tests were carried out in order to calculate the 96h-LC50 for mercury in yellow fin sea bream, based on OECD Guidelines (1998). Mortality was recorded after 24,48,72 and 96h, and LC50 values and its confidence limits(95%)were calculated by the Litchfield and Wilcox on Method (1949).The test was carried out in triplicate. Percentages of fish mortality were calculated for each mercury concentration at 24, 48, 72 and 96 h of exposure.
Result
There was 100% mortality at 10000 µg/l concentration within the first 4h after dosing, and 100% mortality at 5000 µg/l within the 14h whereas 100% mortality for 2000 µg/l was 42h and for 1000 µg/l was 54h.
The mortality of yellowfin sea bream for mercury chloride doses 20, 50, 100, 200, 500, 1000, 2000, 5000 and 10000 µg/l were examined during the exposure times at 24, 48, 72 and 96 h for Range Finding Test (table 2). Fish exposed during the period 24-96h had significantly increased number of dead yellowfin sea bream with increasing concentration. There were significant differences in number of dead fish between the duration 24-96 in each.
Table 2: Cumulative mortality of yellowfin sea bream (n=6, each concentration) at Range Finding Test.
| Concentration (µg/l) | No. of dead yellowfin sea bream | |||
| 24h | 48h | 72h | 96h | |
| Control | – | – | – | – |
| 20 | – | – | – | – |
| 50 | – | – | – | – |
| 100 | – | – | – | – |
| 200 | – | – | – | – |
| 500 | – | – | – | – |
| 1000 | 1 | 3 | 6 | 6 |
| 2000 | 2 | 6 | 6 | 6 |
| 5000 | 6 | 6 | 6 | 6 |
| 10000 | 6 | 6 | 6 | 6 |
After finding this fact that main range is between 500-1000 (because of no mortality at 500 µg/l and 100% mortality at 1000 µg/l), the mortality of yellowfin sea bream for mercury chloride doses 550, 650, 750, 850 and 950 µg/l were examined during the exposure times at 24, 48, 72 and 96 h for LC50 Test (table 3).
Table 3: Cumulative mortality of yellowfin sea bream (n=6, each concentration) at LC50 test.
| Concentration (µg/l) | No. of dead yellowfin sea bream | |||
| 24h | 48h | 72h | 96h | |
| Control | – | – | – | – |
| 550 | – | – | 1 | 1 |
| 650 | – | 1 | 2 | 3 |
| 750 | 1 | 3 | 5 | 5 |
| 850 | 1 | 3 | 6 | 6 |
| 950 | 1 | 3 | 6 | 6 |
Median lethal concentrations of 10%, 30%, 50%, 70% and 90% test are in table 4. Physicochemical parameters of test water are in table 5.
Table 4:P Lethal concentrations (LC1-99) of mercuric chloride depending on time (24-96h) for A. latus.
| Concentration (µg/l) (95 % of confidence limits) | ||||
| Point | 24h | 48h | 72h | 96h |
| LC30 | 919.4132 | 705.6551 | 705.6551 | 594.8041 |
| LC40 | 941.8181 | 799.1379 | 799.1379 | 622.7525 |
| LC50 | 962.7520 | 886.4827 | 886.4827 | 648.8659 |
| LC60 | 983.6859 | 973.8275 | 973.8275 | 674.9793 |
| LC70 | 1026.0909 | 1007.3103 | 1007.3103 | 702.9278 |
Table 5: Physicochemical parameters of test water.
| Parameters | |
| Temperature (°C) | 25 ± 1 |
| pH | 7.8 ± 0.1 |
| Salinity | 46±1 |
Mortality percentage of Range Finding Test and LC50 experiment are in figures 1 and 2 respectively, however sigmoid probit analyses and regression lines of probit are in figures 3 and 4 respectively.
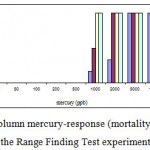 |
Figure 1: The column mercury-response (mortality) for A. Latus in the Range Finding Test experiment.
|
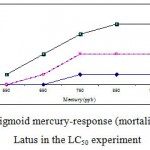 |
Figure 2: The sigmoid mercury-response (mortality) curve for A. Latus in the LC50 experiment.
|
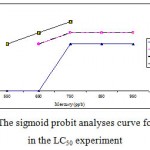 |
Figure 3: The sigmoid probit analyses curve for A. Latus in the LC50 experiment.
|
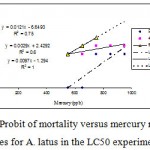 |
Figure 4: Probit of mortality versus mercury regression lines for A. latus in the LC50 experiment. Also depicted are the regression equations and R2 values. Probit values used are derived from Fig 3. |
Toxicity Testing Statistical Endpoints are in tow part: 1- Hypothesis Testing: is there a statistically significant difference between the mean response in the treatments and mean response in control or reference sample? LOEC: Lowest Observed Effect Concentration; NOEC: No Observed Effect Concentration. 2- Point Estimates: what toxicant concentration will cause a specific effect on the test population? LC50: the median Lethal Concentration. Our result for Toxicity Testing Statistical Endpoints is in Fig 5.
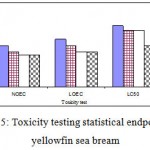 |
Figure 5: Toxicity testing statistical endpoints in yellowfin sea bream.
|
Discussion
Toxic effects of mercury and its compounds depend on the chemical form of mercury. Organic forms of mercury are generally more toxic to aquatic organisms than are inorganic forms. HgCl2 can be converted into highly toxic methyl mercury by methylation through chemical or biological processes.
Factors influencing mercury levels can be divided into exogenous (characteristics of the water body) and endogenous (characteristic of the individuals or species). Exogenous factors include pH, sulfur and organic matter (e.g., dissolved organic carbon). Endogenous factors include species, habitat and food preferences, metabolic rate, age, growth rate, size, mass, and diet.
According to the Gooley et al (2006), mercury is one of the concern metals in aquaculture and has 10-40 µg/l of LC50 with only 1µg/l for safe levels, whereas LC50 value for other heavy metals is higher than mercury (cadmium 80-420, cooper 20-100, zinc1000-10000, lead 1000-40000 µg/l). Chowdhury et al (2006) show the 96h LC50 for the juvenile trout as11 µg/l (95% CI = 9.2 – 11.9 µg/l).
The 96-h LC50 value for catfish exposed to Hg2+ under static test was determined to be 570 µg/l (Elia et al., 2000). The 96-h LC50 value of mercury chloride for chub was found as 205 µg/l and 96-h LC50 for trout 814 µg/l (Verep et al. 2007). On the estuarine fish Pomatoschistus microps, LC50 of copper and mercury at 96 h were 568 μg/l and 62 μg/l, respectively (Vieira et al. 2009).
The concentrations of trace metals that resulted in mortality of H.rubra were investigated by exposing juveniles to acute concentrations of Cu, Zn, Hg and Cd for 96hr. Hg resulted in more sudden mortality rate after 24hr exposure compared to Cu yet produced a 96hr LC50 of 173μg Hg/L (Gorski. 2007).
EPA studies (1997) on many aquatic species show vast range of LC50 for mercury chloride, which for saltwater fish was 36 μg/l (juvenile spot) to 1678 μg/l (flounder), that was higher than saltwater invertebrate 3.5 μg/l (mysid shrimp) to 400 μg/l (soft clam). This result emphases that yellowfin sea bream is sensitive to mercury chloride and have low LC50 value.
According to FAO/UNEP (1991), the 96-h LC50 values of mercury chloride are for cat fish 350 μg/l, rainbow trout 220 μg/l, striped bass 90 μg/l and brook trout 75 μg/l.
the 96-h LC50 values of mercury chloride 37 μg/l for fathead minnow, 160 μg/l for bluegill sunfish, 903 μg/l for rainbow trout, 200 μg/l for rainbow trout and lower in invertebrate, 2 μg/l for crayfish, 5 μg/l for cladocera, 10 μg/l for Gammarus, 5 μg/l for blue mussel, 15 μg/l for prawn, and 3 μg/l for limpet (Eisler, 1987).
For mercury, 96 h LC50 values of 75 μg/l for the catfish (Sarothrodon mossambicus), 33 μg/l for the rainbow trout (Salmo gairdneri), 110 μg/l for the banded killifish (Fundulus diaphanous) and 90 μg/l for the striped bass (Roccus saxatilis) were found (Rehwoldt et al., 1972; Hale, 1977; Das et al., 1980).
The susceptibility of fish to a particular heavy metal is a very important factor for LC50 values. The fish that is highly susceptible to the toxicity of one metal may be less or non-susceptible to the toxicity of another metal at the same concentration of that metal in the milieu. Similarly, the metal which is highly toxic to one organism at low concentration may be less or non-toxic to other organism at the same or even higher concentration, so the LC50 values reported in the present study for HgCl2 were lower than the values reported by Agarwal (1991) for the Channa punctatus (Bloch) at 48, 72, and 96 h. He reported LC50 values of 2.512, 2.291, and 2.113 mg/L, respectively, at 48, 72, and 96 h. however, the present values, are higher than those of Khangarot (1981): 0.432 and 0.314
mg/L, respectively, at 72 and 96h in Channa marulius.
Rathore and Khangarot (2002) reported that the acute toxicity of HgCl2 increases with increase in temperature. Cairns et al. (1981) reported similar trends for other metals. Khangarot and Ray (1987) also observed that the toxicity of copper abruptly decreased with an increase in pH of the Cu-containing medium. Acute toxicity studies are the very first step in determining the water quality requirements of fish. These studies obviously reveal the toxicant concentrations (LC50) that cause fish mortality even at short exposure. Therefore, studies demonstrating the sensitivity of genotoxic effects of heavy metals in aquatic organisms, particularly in fish are needed. Thus, it can be concluded from the present study that fish are highly sensitive to HgCl2 and their mortality rate is dose dependent.
Comparison of values reported earlier with those obtained in the present study may not be meaningful because various factors may influence bioassay techniques like differences in fish(e.g., species, weight, size) and other environmental factors (temperature, variations in pH of the water, total hardness of water, dissolved oxygen). Sprague (1969) observed variability in acute toxicity even in a single species and single toxicant depending on the size, age, and condition of the test species along with experimental factors. Gupta et al. (1981) reported that the differences in acute toxicity may be due to changes in water quality and test species.
Chronic toxicity values are much lower than acute values and highlight the adverse effects of relatively low concentrations of mercury in water (i.e., < 1 μg/L).
In aquatic toxicology, if LC50 concentration is smaller than 1000 μg/l , the chemical is highly toxic, and if between 1000-10000 μg/l, then it is considered to be moderately toxic (Louis et al. 1996), therefore we report mercury chloride to be highly toxic to yellowfin sea bream and my cause many damage in this Fish.
The fish exposed to metal can compensate for the stressors. If it cannot successfully compensate for stressor effects, an altered physiological stage may be reached in which the organism continues to function and, in extreme cases, the acclimation response may be exhausted with a subsequent effect on fitness (Mayer et al. 1992). In the present study,
LC50 values indicated that mercury is more toxic to A. latus. LC50 obtained in the present study (650 μg/l) compare with corresponding values that have been published in the literature for other species of fish, show different LC50 of mercury in different species and even different time, but what is important, lower value of LC50 for A. latus compare with most species and confirm sensitively of A. latus to low mercury doses.
Acknowledgments
The authors are thankful to the Director and Staff at the Mariculture Research Station, Mahshahr, Iran for providing necessary facilities for the experiment and the University of Marine Science and Technology, Khoramshahr, Iran, for support during the tenure of this project. We would like to express our special thanks to Dr. Movahedinia for assistance during the trials.
References
- Agarwal, S.K., 1991. Bioassy evaluation of acute toxicity levels of mercuric chloride to an air-breathing fish Channa punctatus (Bloch): mortality and behavior study. J. Environ. Biol. 12, 99–106.
- Boudou, A., Ribeyre, F., 1997. Aquatic ecotoxicology: from the ecosystem to the cellular and molecular levels. Environ. Health Perspect. 105 (Suppl. 1), 21-35
- Boening, D. 2000. Ecological effects, transport, and fate of mercury: a general review. Chemosphere. 40:1335– 51.
- Cairns Jr., J., Buikema Jr., A.L., Heath, A.G., Parker, B.C., 1981. Effects of temperature on aquatic organism sensitive to selected chemicals. Va. Water Resources Res. Center Bull. 106, 1–88.
- Das, K.K., Dastidar, S.G., Chakrabarty, S., Banerjee, S.K., 1980. Toxicity of mercury: a comparative study in air-breathing fish and non air-breathing fish. Hydrobiologia 68, 225–229.
- Eaton, A.D., Clesceri, L.S., Greenberg, A.E., Franson, M.A.H. 1995 .Standard Methods for the Examination of Water and Waste Water. 19th ed. American Public Health Association. Washigton (DC 20005).
- Eisler, R., 1987. Mercury hazards to fish, wildlife and invertebrates. U.S. fish and wildlife research center. No 10, (1 .10) 85.
- Elia, A.C., Do¨ rr, A.J.M., Mantilacci, L., Taticchi, M.I., Galarini, R., 2000. Effects of mercury on glutathione and glutathione-dependent enzymes in catfish (Ictalurus melas R.). In: Markert, B., Friese, K.
- (Eds.), Trace Elements—Their Distribution and Effects in the Environment: Trace Metals in the Environment, Vol. 4. Elsevier Science, Amsterdam, pp. 411–421.
- FAO/UNEP, 1991. Operation of the prior informed consent procedure for banned or severely restricted chemicals in international trade. Joint FAO/UNEP program, Rome, Geneva, Arnended 1996.
- Gooley, G.J., Gavine, F.M. and Olsen, L. 2006. Biological Systems to Improve Quality and Productivity of Recycled Urban Wastewater. A Joint Project of: Department of Primary Industries, Victoria.
- Gupta, P.K., Khangarot, B.S., Durve, V.S., 1981. The temperature dependence of the acute toxicity of copper to a freshwater pond snail, Viviparus bengalensis L. Hydrobiologia 83, 461–464.
- Gorski. 2007.The effects of trace metals on the Australian abalone, Haliotis rubra Jacquelle. PhD thesis. RMIT University.
- Hale, J.G., 1977. Toxicity of metal mining wastes. Bull. Environ. Contam. Toxicol. 17, 66–73.
- Hilmy, A.M., Shabana, M.B., Dabees, A.Y. 1985. Bioaccumulation of cadmium: Toxicity in Mugil cephalus. Comp. Biochem. Physiol. 81: 139-143.
- Hotos , G.N. Vlahos, N. 1998. Salinity tolerance of Mugil cephalus and Chelon labrosus_Pisces: Mugilidae/fry in experimental conditions. Aquaculture 167_1998.329–338.
- Khangarot, B.S., Ray, P.K., 1987. Response of a freshwater Ostracod (Cypris subglobosa Sowerby) exposed to copper at different pH levels. Acta Hydrochim. Hydrobiol. 15, 553–558.
- Vieira, L.R. Gravato, C. Soares A., Morgado F., Guilhermino. L. 2009. Acute effects of copper and mercury on the estuarine fish Pomatoschistus microps: Linking biomarkers to behavior. Chemosphere 76. 1416–1427.
- Louis, A.H, Diana, L.W. Patricia, H. and Elizabeth, R.S. 1996. Pesticides and Aquatic Animals, Virginia Cooperative Extension, Virginia State University, Virginia, pp: 24.
- Mayer, F.L., Versteeg, D.J., McKee, M.J., Folmar, L.C. 1992. Physiological and non-specific biomarkers. In: Biomarkers: Biochemical, physiological and histological markers of anthropogenic stress. Huggett, R.J., Kimerle, R.A, Mehrle, P.M. Jr., Bergman, H.L. (eds), Lewis Publishers, Boca Raton, PL. 5-85.
- Rathore, R.S., Khangarot, B.S., 2002. Effect of temperature on the sensitivity of sludge worm Tubifex tubifex (Muller) to selected heavy metals. Ecotoxicol. Environ. Saf. 53, 27–36.
- Rehwoldt, R., Menapace, L.W., Nerrie, B., Alessandrello, D., 1972. The effect of increased temperature upon the acute toxicity of some heavy metal ions. Bull. Environ. Contam. Toxicol. 8, 91–96.
- Sprague, J.B., 1969. Measurement of pollutant toxicity to fish: I. Bioassay methods for acute toxicity. Water Res. 3, 793–821.
- Tort, L., Torres, P., Flos, R. 1987. Effects on dogfish haematology and liver composition after acute copper exposure. Comp. Biochem. Physiol., 87: 349-353.
- Van Straalen, N.M., Leeuwangh, P. and Stortelder, P.B.M. 1994. In Ecotoxicology of soil organisms. Ed. Donker M.H., Eijsackers H and Heimbach F. CRC. Press: USA, chapter 29.
- Verep, B., Sibel Besli, E., Altionk, I., and Mutlu, C. 2007. Assessment of Mercuric chloride toxicity on Rainbow trouts and cubs. 2007. Pakistan Journal of Biological Sciences. 10 (7): 1098-1102.
- Wardlaw, A.C., 1985. Practical Statistics for Experimental Biologists. Wiley, pp. 104–110.

This work is licensed under a Creative Commons Attribution 4.0 International License.


