

Manuscript accepted on : July 04, 2009
Published online on: 28-12-2009
Novel Spectrophotometric Methods for Estimation of Naratriptan in Pharmaceutical Dosage Forms
A. Sreelakshmi1*, G. Devala rao2 and G. Sudhakara Sai Babu2
1Department Of Biotechnology, Montessori Mahila Kalasala, Vijayawada - 520 010 India.
2K.V.S. R. Siddhartha College of Pharmaceutical Sciences, Vijayawada - 520 010 India.
Corresponding Author E-mail: sree_adusu@rediffmail.com
ABSTRACT: Naratriptan is a triptan drug. Two simple, sensitive and accurate spectrophotometric methods have been developed for the determination of Naratriptan in pure state and in its pharmaceutical dosage forms. The developed Method A, involves the formation of drug-picric acid complex in chloroform solution and it shows maximum absorption at l max 400 nm; linearity in the range of 2.5-12.5 μg/mL. Method B is based on the formation of charge transfer complex formation of chloranilic acid with drug. The developed chromogen in Method B exhibits maximum absorption at l max 525 nm and linearity in the range of 100-500 μg/mL. The results obtained were statistically evaluated and were found to be accurate and reproducible.
KEYWORDS: Naratriptan; spectrophotometric; pharmaceutical dosage forms
Download this article as:| Copy the following to cite this article: Sreelakshmi. A, rao. G. D, Babu. G. S. S. Novel Spectrophotometric Methods for Estimation of Naratriptan in Pharmaceutical Dosage Forms. Biosci Biotechnol Res Asia 2009;6(2) |
| Copy the following to cite this URL: Sreelakshmi. A, rao. G. D, Babu. G. S. S. Novel Spectrophotometric Methods for Estimation of Naratriptan in Pharmaceutical Dosage Forms. Biosci Biotechnol Res Asia 2009;6(2). Available from: https://www.biotech-asia.org/?p=9020. |
Introduction
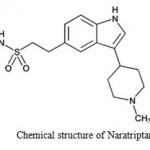
Naratriptan1 is an antimigraine drug. Chemically it is N-methyl-2-[3-(1-methyl piperidin-4-yl)-1H-indol-5-yl] ethane sulfonamide. It is an indole derivative and is official in U.S.P2, 2007. Naratriptan binds with high affinity to 5-HT1D and 5-HT1B receptors and has no significant affinity or pharmacological activity at 5-HT2-4 receptor subtypes or at adrenergic α1, α2 or β; dopaminergic D1 or D2; muscarinic; or benzodiazepine receptors. The therapeutic activity of Naratriptan in migraine3 is generally attributed to its agonist activity at 5-H1D/1B receptors. The U.S. Food and drug Administration (FDA) approved Naratriptan on February 11, 19984.
Literature reveals no colorimetry and HPLC methods reported for Naratriptan in dosage forms. Only a few analytical methods are reported in the literature for estimation of Naratriptan in pharmaceutical dosage forms and in biological fluids such as LC-MS5, 6
In the present investigation, two simple, sensitive and accurate visible spectrophotometric methods have been developed for the estimation of Naratriptan in tablet dosage forms and in bulk drug. Method A shows λ max at 400 nm and linearity in the range of 2.5-12.5 μg/mL. Method B exhibits λ max at 525 nm and linearity in the range of 100-500 μg/mL.
 |
Scheme 1
|
Experimental
Spectral and absorbance measurements were made on Systronics Double beam UV-Visible spectrophotometer model 2201 with 1cm matched quartz cells. Naratriptan was procured from a local pharmaceutical industry. All other reagents used were of analytical grade.
Reagents Preparation
For Method A, 400 mg of picric acid was dissolved in 100 mL of chloroform.
For Method B, 100 mg of chloranilic acid was dissolved in 20 mL of isopropyl alcohol, filtered and made up to 100 mL with chloroform.
Standard Preparation
For Method A, 10 mL of 100 μg/mL of pure Naratriptan.Hcl standard solution prepared in water was transferred into a 150 mL separating funnel. To this 10 mL of 0.1% sodium hydroxide was added and kept aside to separate free base with continuous shaking. The free base was extracted with 20 mL chloroform thus the obtained chloroform layer is used for the development of chromogen.
For Method B, 100 mg of pure Naratriptan.Hcl was dissolved in 10 mL of water and transferred to 150 mL separating funnel. To this 10 mL of 0.1% sodium hydroxide was added drop wise with shaking. The free base was extracted with 20 mL of chloroform for three times and then made up to 100 mL with chloroform. This chloroform solution containing drug is used for color development.
Sample Preparation
Twenty tablets were taken and made into fine powder. The powder equivalent to average weight was taken and dissolved in 10 mL of water and transferred into a separating funnel, to this 10 mL of 0.1% sodium hydroxide was added and kept aside with continuous shaking. Then 20 mL of chloroform was added to extract the drug into chloroform. This was further diluted in respective concentrations required for Methods A and B so that linearity range can be obtained and further analysis was carried out as described under standard curve.
Procedure for estimation
Method A
Aliquots of standard solution containing 0.5-2.5 ml (2.5-12.5 µg/mL) were transferred to a series of 10 mL volumetric flasks. To this 1 mL of picric acid reagent was added and made up to volume with chloroform. The absorbance of the yellow colored chromogen species was measured at λmax 400 nm against reagent blank. The amount of Naratriptan.Hcl in the sample solution was computed from the standard calibration curve.
Method B
Aliquots of standard solution containing 0.1-0.5 ml (100-500 µg/mL)
were transferred to a series of 10 mL volumetric flasks. Now the volume in all the flasks is made up to 1 mL with chloroform, followed by addition of 1 mL of chloranilic acid reagent and made up to volume with acetonitrile. The absorbance of the purple colored species was measured at λmax 525 nm against reagent blank. The amount of Naratriptan.Hcl in the sample solution was computed from the standard calibration curve.
Results and Discussion
The developed Method A is based on the quantitative yellow colored complex formation of drug with picric acid reagent. Picric acid in chloroform solution will have very little or no color. When chloroform solution of drug is added to this picric acid reagent it develops intense yellow color due to the presence of cyclic tertiary nitrogen in Naratriptan. It was found that 2 mL of reagent is sufficient for producing maximum color intensity.
The proposed Method B is based on the drug which possesses cyclic tertiary nitrogen of aliphatic nature and function as electron donor and participates in charge transfer interaction with substituted quinines (chloranilic acid). The colored species formed due to the formation of radical cation.
The interference studies revealed that the common excipients usually present in the dosage forms do not interfere in the proposed method.
The optical characteristics and validation parameters were given in Table 1. To evaluate the accuracy and reproducibility of the method, known amounts of the pure drug was added to the previously analyzed pharmaceutical formulations and the mixture were
reanalyzed by the proposed methods and the recoveries (average of six determinations) were given in Table 2.
Table 1: Optical characteristics, regression data, Precision and accuracy of the proposed methods for Naratriptan.
| Parameter | Method A | Method B |
| λ max (nm) | 400 | 525 |
| Beer’s law limits ( μg/mL) | 2.5-12.5 | 100-500 |
| Molar absorptivity (Lit.mole-1.cm-1) | 3.421 x 10⁴ | 2.426 x 10⁴ |
| Detection limits ( µg/mL) | 0.2905 | 2.667 |
| Sandell’s Sensitivity ( μg/cm2/0.001 abs. unit) | 0.0242 | 0.813 |
| Optimum photometric range | 1.5-15.5 | 75-150 |
| Regression equation (Y=a+bc) :
Slope (b) |
0.0408 |
0.00123 |
| Standard deviation of slope (Sb) | 4.33 x 10⁻³ | 3.0 x 10⁻⁶ |
| Intercept (a) | 0.0016 | 0.0009 |
| Standard deviation of intercept (Sa) | 0.0036 | 0.00099 |
| Standard error of estimation (Se) | 0.2906 | 2.667 |
| Correlation coefficient (r) | 0.9996 | 0.99998 |
| % Relative standard deviation* | 0.5029 | 0.5984 |
| % Range of Error*
(confidence limits) 0.05 level 0.01 level |
0.788
0.5029 |
0.9851
0.5984 |
| % Error in bulk samples** | 0.34 | 0.11 |
* Average of six determinations
** Average of three determinations
The values obtained for the determination of Naratriptan in several pharmaceutical formulations (tablets) and bulk drug by the proposed and reference methods were compared (Table 2). The results indicate that the proposed methods are simple, sensitive, accurate and reproducible and can be used for the routine determination of Naratriptan in bulk and pharmaceutical dosage forms.
Table 2: Assay and recovery of Naratriptan in dosage forms
| Method | Pharmaceutical
Formulation |
Labelled Amount
(mg) |
Proposed Method | % recovery by
Proposed methods** ± S.D |
||
| Amount found*
(mg) ± S.D |
t (value) | F (value) | ||||
| A | Brand-1 | 2.5
1.0 |
2.46 ± 0.082
1.04 ± 0.009 |
0.165
0.183 |
2.534
2.474 |
100.8 ± 0.50
100.9 ± 0.61 |
| B | Brand-11 | 2.5
1.0 |
2.52 ± 0.008
1.06 ± 0.011 |
0.075
0.984 |
1.104
1.985 |
99.61 ± 1.01
99.38 ± 0.64 |
* Average ± Standard deviation of six determinations, the t and F-values refer to comparison of the proposed method with reference method.
Theoretical values at 95 % confidence limits t = 2.571 and F = 5.05.
** Average of five determinations.
Acknowledgements
The authors are grateful to Montessori Mahila kalasala, Vijayawada for their continuous support and encouragement and for providing the necessary facilities.
References
- Bandari Suresh, Gannu Ramesh, and Naidu, K.V.S., Journal of liquid Chromatography and related technologies, 2008; vol.30, 13-16, 2101-2112.
- United States Pharmacopoeia, 24, national formulary 19, section <1225> “Validation of compendial methods”. US Pharmacopoeial convention, Rockville, 2000.
- Beata Duszynka, stanisla, misztal, wiadomo sci chemiczne, 2001; 55, 45.
- Douglas A. Skoog, F. James Holler Principles of Instrumental analysis 5th edition.
- Karthick Viswanathan, Michael G. Bartlett, James T. Stewart, Rapid Communication in Mass Spectrometry, 1999; 14(3), 168-172.
- Dulery, B.D., Petty, M.A., Schoun, J., David, M., and Huebert, N.D., Journal of Pharmaceutical and biomedical analysis, 1997; 15(7), 1009-1020.

This work is licensed under a Creative Commons Attribution 4.0 International License.


