

Manuscript accepted on : March 10, 2009
Published online on: 22-06-2009
R. Chakraborty1, S. Chakraborty2*, B. K. Dutta2 and S. B. Paul3
1Department of Biotechnology, Assam University, Silchar - 788 011 India.
2Department of Ecology & Environmental science, Assam University, Silchar - 788 011 India.
3Department of Chemistry, Assam University, Silchar - 788 011 India.
Corresponding Author E-mail: ausupriyoch_2008@rediffmail.com
ABSTRACT: In Barak Valley Zone of Assam the physically hard working people prefer bold grained rice with good taste because of slow digestion and longer retention in the stomach. But most of the modern high yielding rice varieties is medium and fine grained. Keeping the need of rural people in mind, the present experiment was conducted on 47 bold grained rice genotypes with two recommended high yielding check varieties namely Ranjit and Monohar Sali of Barak Valley, Assam. The mean performance of eight biochemical traits of these 49 genotypes was evaluated. Crude protein content (%) and total soluble protein content (g/100g of oven dry sample) varied from 7.09 to 13.10 and 4.10 to 6.69 respectively. The starch content (g/100g of oven dry sample), amylose content (% of starch) and amylopectin content (% of starch) varied from 79.78 to 65.63, 25.56 to 15.25 and 84.75 to 74.44 respectively. Total soluble sugar content, total reducing sugar content and total non-reducing sugar content (g/100g of oven dry sample) ranged from 1.14 to 0.35, 0.363 to 0.103 and 0.935 to 0.279 respectively in the bold grained rice genotypes. Rank correlation study revealed that total soluble protein content had highly significant positive correlation with crude protein content, starch content, amylose content, amylopectin content, total soluble sugar content, total reducing sugar content and total non-reducing sugar content. Nine bold grained rice genotypes were selected out of 47 bold grained rice genotypes on the basis of lower total cumulative rank obtained from the performance of eight biochemical traits. The selected genotypes were Chandmoni (G20), Bar Madhava (G28), Matonga (G11), Soularpona (G7), Mala (G38), Soulpona (G1), Lati Sali (G2), Dudh Mula (G24) and Hathi Sali (G42). These genotypes hold potential for use as parents in future hybridization program for transferring the desirable gene (s) for biochemical traits into other varieties.
KEYWORDS: Biochemical traits; mean performance; rank correlation; bold grained rice
Download this article as:| Copy the following to cite this article: Chakraborty R, Chakraborty S, Dutta B. K, Paul S. B. Screening Bold Grained Rice (Oryza Sativa L.) Genotypes Based on the Ranking of Their Performance for Biochemical Traits. Biosci Biotechnol Res Asia 2009;6(1) |
| Copy the following to cite this URL: Chakraborty R, Chakraborty S, Dutta B. K, Paul S. B. Screening Bold Grained Rice (Oryza Sativa L.) Genotypes Based on the Ranking of Their Performance for Biochemical Traits. Biosci Biotechnol Res Asia 2009;6(1). Available from: https://www.biotech-asia.org/?p=7894 |
Introduction
The Barak Valley Zone comes under one of the six agro-climatic zones of Assam and lies between 24°15´ and 25°9´ N latitude and between 92°16´ and 93°15´ E longitude. The zone is characterized by an undulating topography with wide plain area and low lying waterlogged area. Physically hard working rural people of Barak Valley Zone of Assam consume bold grained rice because of slow digestion and longer retention in the stomach. These rice genotypes release energy slowly and the consumers do not feel hungry for a long time while doing strenuous jobs like tillage, harvesting, carpentry, black smithy, road construction etc. So the bold grained rice genotypes have been traditionally and widely grown in this zone since time immemorial. No literature is available on the genetic variation of nutritional parameters in bold grained rice. The present investigation was, therefore, undertaken to assess the biochemical traits of 49 rice genotypes including two checks and to rank them on the performance of biochemical traits. Based on the total ranks of biochemical traits the genotypes were selected for further genetic improvement. Rice is the prime source of carbohydrate and a major source of protein to the rural people of Barak Valley despite the fact that protein content in rice is very low (7 to 14%).
Material and Methods
The experimental material consisted of 47 bold grained rice genotypes collected from different parts of Barak valley zone, Assam, along with two recommended high yielding check varieties namely Ranjit and Monohar Sali. The experiment was conducted in randomized block design (RBD) with three replications during kharif season 2006. Freshly harvested seed samples from 49 rice genotypes were collected. The grains of each replicate were dehusked carefully before drying at 40°C, powdered and stored in a plastic bag sealed thoroughly before analysis of different biochemical traits. The different biochemical traits were estimated as follows.
i) Crude protein content
It was determined by Micro-Kjeldahl’s method AOAC.2 The nitrogen in protein of the sample was converted to ammonium sulphate (NH4)2SO4 by sulphuric acid (H2SO4) during digestion. This salt on steam distillation liberated ammonia and was collected in boric acid solution and titrated against standard acid (0.1N HCl). Since 1 ml of 0.1N acid was equivalent to 1.401 mg nitrogen (N); calculation was made to arrive at the nitrogen content of the sample.
The nitrogen content of the sample was calculated based on the formula:
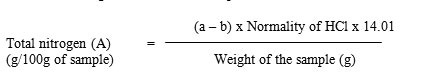
Where, a = volume of standard acid required for sample
b = volume of standard acid required for the blank
The crude protein content in 100 g of sample was calculated by multiplying total nitrogen (A) with conversion factor 5.95.
i.e., Crude protein content (g/100g of sample) = A x 5.95
ii) Total soluble protein content: Total soluble protein content from the grain sample was extracted by the following method. About 0.5 g of dried powder sample was taken in a centrifuge tube and to it, 5 ml of 0.1N NaOH was added and stirred in cold condition for 15 minutes followed by centrifugation at 3000G for 10 minutes. The supernatant was decanted to a test tube and the residue was again treated with 5 ml of 0.1N NaOH and stirred for 15 minutes followed by centrifugation as before. The supernatant was decanted in the previous test tube. The procedure was repeated four times. 2 ml of the above supernatant was mixed with 2 ml of 20% tri-chloro acetic acid (TCA), kept in cold for one hour for precipitation, and again centrifuged at 3000G for 10 minutes. The residue was dissolved in 10 ml of 0.1N NaOH. This solution was used for protein determination following Lowry’s method.7
iii) Determination of starch content
The starch from sugar free pellets was extracted in 52% perchloric acid at room temperature (Clegg 14). The residue that remained after extraction of sugar was kept in an oven at 70°C until constant weight of the sample residue was attained and then transferred to a test tube. 5 ml of distilled water was added and kept in cool condition. 6.5 ml of 52% perchloric acid was added to it and stirred for 15 minutes in cool condition. Another 20 ml of distilled water was added and filtered in a 50 ml volumetric flask. To the residue again, 6.5 ml of 52% perchloric acid was added and stirred in cool condition for 15 minutes and filtered into the earlier 50 ml volumetric flask. The volume was adjusted to 50 ml by distilled water.
A suitable aliquot of the extract was taken and the volume was made to 2 ml with distilled water followed by 4 ml of Anthrone reagent that was added in cool condition. The tubes were kept in boiling water bath for 8 minutes and cooled rapidly under running water. The absorbance of bluish green colour was read at 630 nm wave length9. The glucose content of the sample was determined by using standard graph. The value so obtained was multiplied by a factor 0.9 to determine the starch content.
iv) Determination of amylose content
Starch is composed of two components namely amylose and amylopectin. Amylose is a linear or non-branched polymer of glucose. The glucose units are joined by a- 1- 4 glucosidic linkages. Amylose exists in coiled form and iodine is adsorbed within the helical coils to produce a blue colour complex. The blue colour complex was measured calorimetrically9 & 12.
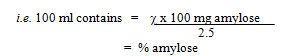
For determination of amylose content, 100 mg of powder sample was taken in a test tube; 1ml of distilled ethanol was added to it. To the test tube, 10 ml of 1N NaOH was added and left over night. The volume was made up to 100 ml in a volumetric flask. From the final volume, 2.5 ml of the extract was taken in a 50 ml volumetric flask and 20 ml of distilled water was added and then three drops of 0.1% phenolphthalein were added. Subsequently, 0.1N HCl was poured to it drop by drop, till disappearance of pink colour to neutralize the base.
To this solution, 1 ml of iodine reagent was added and volume was made up to 50 ml and absorbance was read at 590 nm wave length. The iodine reagent was prepared by dissolving 1g iodine and 10g of potassium iodide (KI) in water and volume was made up to 500 ml.
Standard graph was prepared by standard amylose solution and colour development was done like that of sample solution.
Calculation
Absorbance corresponds to 2.5 ml of the solution = c mg. amylose.
Determination of amylopectin
The amount of amylopectin was obtained by subtracting the amylose content from that of starch9.
Determination of total soluble sugar
Total soluble sugars were extracted by refluxing in 80% ethanol (Cerning and Guilbot 13). Quantitative determination of total soluble sugar was carried out by colorimetric methods of Yemm and Willis15.
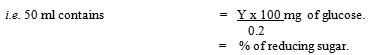
For this purpose, 100 mg of the oven-dried sample was taken in a test tube to which few drops of ethanol and 2 ml of distilled water was added. Test tube was stirred for 5 minutes with a glass rod; 5 ml of boiling 80% ethanol was added and again stirred for 10 minutes. It was then filtered in a volumetric flask trying to keep the residue in the tube. The process was repeated for 4 to 5 times with 80% ethanol and total volume was made to 50 ml by 80% ethanol. A suitable aliquot 0.2 ml of the extract was taken and volume was made to 2 ml with distilled water followed by 4 ml of Anthrone reagent was added in cold condition. The tubes were then kept in boiling water bath for 8 minutes and then cooled rapidly and the absorbance of bluish green colour was read at 630 nm wave length.
Calculation
Absorbance corresponds to 0.2 ml of test = Y mg of glucose.
vi) Determination of total reducing sugar
Total reducing sugar content was estimated by dinitro salicylic acid (DNS) method.9 DNS reagent was prepared by dissolving 1g of 3-5 dinitro-salicylic acid, 200 mg crystalline phenol and 50 mg sodium sulphate Na2SO4 in 100 ml of 1% NaOH. In such an alkaline medium, DNS was reduced by glucose or any other reducing sugar to form 3amino-5nitro-salicylic acid, which was dark brown in colour and showed maximum absorbance at 500 nm wave length.
For the purpose of estimation of reducing sugar, 100 mg of the sample was extracted with hot 80% ethanol twice (5 ml each time). The supernatant was collected and evaporated by keeping the tube on a water bath at 80°C. The residue was dissolved in 10 ml of distilled water. 0.5 ml of the extract was pipetted in test tube and volume was adjusted to 3 ml. Similarly different aliquots of working standard were taken in a series of test tubes and volumes were adjusted to 3 ml, which acted as standard. To the each test tube, 3 ml of DNS reagent was added and heated in boiling water bath for 5 minutes. In hot condition, 1ml of 40% Rochelle salt (Potassium sodium tartrate) solution was added. The tubes were cooled rapidly and the intensity of colour was read at 500 nm wave length.
The amount of reducing sugar present in the sample was calculated using the standard graph.
viii) Determination of total non-reducing sugar
Total non-reducing sugar content was determined by calculating the difference between total soluble sugar and reducing sugar.9
Selection of Genotypes
In order to select the promising genotypes from the experiment, ranking of genotypes was done based on the mean performance of the genotypes with respect to eight different biochemical characters namely total soluble protein content, crude protein content, starch content, amylose content, amylopectin content, total soluble sugar content, total reducing sugar content and total non-reducing sugar content.
The analysis of variance was calculated as per Panse and Sukhatme11. The rank correlation coefficient of total soluble protein content and seven other biochemical characters were calculated as per Singh and Chaudhary10.
Prior to selection, rank correlation was worked out, between total soluble protein content and seven other biochemical characters using the rank correlation formula,
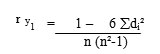
Where, r y1 = Correlation coefficient between total soluble protein content and character 1,
di = Difference of ranks of “i” th genotype between total soluble protein content and
character 1, and
n = Number of genotypes.
Rank correlation coefficients were tested by “t” test.
Results and Discussion
The analyses of variance for different nutritional parameters are presented in the Table 1. It reflected significant genetic variation among the rice genotypes at P = 0.01 or 0.05.
Table 1: Analysis of variance for different biochemical characters of bold grained rice
| Source |
d.f |
M E A N S U M O F S Q U A R E S | |||||||
| Crude protein content
%N X 5.95 |
Total soluble protein content (g/100g of oven dry sample) | Starch content (g/100g of oven dry sample) | Amylose content (% of starch) | Amylopectin content (% of starch) | Total soluble sugar content (g/100g of oven dry sample) | Total reducing sugar content (g/100g of oven dry sample) | Total non- reducing sugar content (g/100g of oven dry sample) | ||
| Replication | 2 | 3.02-2** | 2.22** | 1.13-3 | 1.52-3 | 8.62-4 | 8.16-4 | 4.5-5 | 5.34-4 |
| Genotypes | 48 | 7.31** | 1.34** | 38.08** | 30.60** | 30.66** | 0.15** | 7.4-3 | 0.11* |
| Error | 96 | 1.61-3 | 1.88-2 | 2.76-3 | 3.19-3 | 8.21-3 | 6.13-4 | 1.57-5 | 5.98-4 |
* Significant at 5% probability level, ** Significant at 1% probability level
The mean performance of forty nine genotypes is presented in Table 2. From the table it revealed that the mean performance of all the nutritional parameters varied significantly in the bold grained rice genotypes. The crude protein content ranged from 7.09 to 13.10 percent and total soluble protein content ranged from 4.10 to 6.69 (g/100g of oven dry sample). The results conformed to several earlier reports.1, 4, 5, 6, & 8 The genotype Bar Madhava (G28) recorded the maximum crude protein and total soluble protein content 13.10 and 6.69 percent respectively. The highest mean performance for starch content was shown by the genotype G28 (79.78 g/100g) and the least performance was reflected by the genotype G23 (65.63 g/100g). The result of the present investigation is in conformity with the findings of several earlier workers.1, 5, 8 & 16 The range of amylose content (% of starch) in the 49 genotypes varied from 25.56 to 15.25. The genotype G16 (25.56 % of starch) showed the highest mean performance for amylose content and G42 (15.25 % of starch) showed the least mean performance. Rice genotypes with high amylose content cook dry and less tender but become hard upon cooling. In contrast, low amylose rice genotypes cook moist and sticky. Intermediate amylose is mostly preferred in India (Binodh et al.3). The mean range of amylose content recorded against the genotypes in the present investigation is in conformity with the findings of many rice workers.1, 3, 5 & 17 The genotype G42 (84.75 % of starch) exhibited the highest mean performance and G16 (74.44 % of starch) showed the least mean performance for amylopectin content. Kandali et al.5 observed that amylopectin content in three glutinous rice varieties varied from 98.75 to 99.05 percent while in case of non-glutinous rice it varied from 78.86 to 83.59 percent. Ahmed et al.1 reported that the range of amylopectin content varied from 76.80 to 81.10 percent in nine scented cultivars. The highest total soluble sugar content was showed by the genotype G28 (1.14 g/100g) and the least performance was reflected by the genotype G16 (0.35 g/100g). Raj Kumar et al.8 reported a range of 0.50 to 1.73 percent of total soluble sugar in 16 rice cultivars. Kandali et al.5 found that the variation of total soluble sugar content in glutinous and non-glutinous rice varied from 0.85 to 1.24 percent and 0.92 to 1.27 percent respectively. The genotype G20 (0.363 g/100g) registered the highest reducing sugar content and G16 (0.103 g/100g) reflected the least mean performance for the character. The highest mean performance against total non-reducing sugar content was showed by G28 (0.935 g/100g) and the least mean performance by G3 (0.279 g/100g). Ahmed et al.1 reported that the total reducing sugar and the total non-reducing sugar content in 9 aromatic rice germplasm varied from 0.104 to 0.154 percent and 0.281 to 0.714 percent respectively.
Table 2: Mean performance of the bold grained rice genotypes for different biochemical traits
| Genotypes | Crude protein content (%N x 5.95) | Total soluble protein content (g/100g of oven dry sample) | Starch content (g/100g of oven dry sample) | Amylose content (% of starch) | Amylopectin content (% of starch) | Total soluble sugar content (g/100g of oven dry sample) | Total reducing sugar content (g/100g of oven dry sample) | Total non- reducing sugar content (g/100g of oven dry sample) |
| Soulpona (G1) | 11.90 | 5.84 | 72.47 | 21.27 | 78.73 | 0.91 | 0.213 | 0.697 |
| Lati Sali (G2) | 12.11 | 6.45 | 78.90 | 18.23 | 81.77 | 0.61 | 0.138 | 0.472 |
| Chuto Mula (G3) | 11.08 | 5.42 | 67.32 | 22.52 | 77.48 | 0.46 | 0.129 | 0.334 |
| Kartic Kalma (G4) | 10.07 | 5.83 | 70.29 | 23.16 | 76.84 | 0.38 | 0.105 | 0.279min |
| Basanta Bahar (G5) | 9.92 | 6.40 | 68.87 | 22.33 | 77.67 | 0.48 | 0.117 | 0.363 |
| Karmi Sail (G6) | 11.24 | 5.19 | 71.28 | 24.15 | 75.85 | 0.53 | 0.129 | 0.398 |
| Soularpona (G7) | 12.07 | 6.18 | 77.28 | 21.08 | 78.92 | 0.83 | 0.205 | 0.629 |
| Chaku Sail (G8) | 8.97 | 5.96 | 71.37 | 24.77 | 75.23 | 0.62 | 0.143 | 0.477 |
| Dhola Mula (G9) | 11.46 | 5.82 | 78.90 | 17.22 | 82.78 | 0.51 | 0.124 | 0.386 |
| Kuiari Sali (G10) | 11.96 | 5.52 | 66.73 | 24.58 | 75.42 | 0.76 | 0.166 | 0.591 |
| Matonga (G11) | 11.06 | 6.18 | 75.62 | 22.34 | 77.66 | 0.96 | 0.261 | 0.696 |
| Chafa Sali (G12) | 10.58 | 4.72 | 72.20 | 18.82 | 81.18 | 0.64 | 0.161 | 0.476 |
| Methi Chikon (G13) | 11.25 | 4.80 | 67.20 | 25.17 | 74.83 | 0.41 | 0.115 | 0.298 |
| Probat Jeera (G14) | 11.40 | 4.62 | 66.62 | 23.33 | 76.67 | 0.46 | 0.108 | 0.355 |
| Kamal Bhog (G15) | 8.32 | 6.09 | 73.78 | 18.73 | 81.27 | 0.78 | 0.145 | 0.635 |
| Betguti Dhan (G16) | 8.98 | 4.19 | 70.17 | 25.56max | 74.44min | 0.35min | 0.103min | 0.244 |
| Heera Dhan (G17) | 7.29 | 4.82 | 72.18 | 24.79 | 75.21 | 0.48 | 0.124 | 0.353 |
| Baodun (G18) | 11.09 | 5.65 | 69.73 | 21.84 | 78.16 | 0.68 | 0.148 | 0.532 |
| Kapilee Dhan (G19) | 7.58 | 5.14 | 69.82 | 24.17 | 75.83 | 0.39 | 0.106 | 0.284 |
| Chandmoni (G20) | 12.67 | 6.27 | 79.17 | 16.23 | 83.77 | 1.05 | 0.363max | 0.687 |
| Gourarchor (G21) | 12.86 | 6.16 | 71.21 | 18.70 | 81.30 | 0.78 | 0.108 | 0.672 |
| George Sail (G22) | 11.06 | 5.83 | 73.43 | 19.11 | 80.89 | 0.86 | 0.145 | 0.712 |
| Herapowa (G23) | 10.76 | 5.21 | 65.63min | 23.37 | 76.63 | 0.99 | 0.264 | 0.730 |
| Dudh Mula (G24) | 10.95 | 5.64 | 74.66 | 24.54 | 75.46 | 0.91 | 0.184 | 0.726 |
| Gajep Sail (G25) | 7.09min | 5.34 | 71.23 | 22.22 | 77.78 | 0.42 | 0.138 | 0.282 |
| Kali Makuri (G26) | 8.37 | 5.82 | 70.63 | 17.73 | 82.27 | 0.99 | 0.210 | 0.780 |
| Bata Sail (G27) | 8.28 | 6.25 | 69.70 | 18.19 | 81.81 | 0.63 | 0.113 | 0.521 |
| Bar Madhava (G28) | 13.10max | 6.69max | 79.78max | 17.08 | 82.92 | 1.14max | 0.201 | 0.935max |
| Monohar Sali (G29) | 11.93c | 5.41c | 71.13c | 23.06c | 76.67c | 0.70c | 0.146c | 0.554c |
| Ranjit (G30) | 9.73c | 5.16c | 70.15c | 22.83c | 77.17c | 0.42c | 0.108c | 0.312c |
| Hacha Lath (G31) | 11.23 | 6.18 | 69.14 | 23.71 | 76.29 | 0.82 | 0.169 | 0.651 |
| Samras (G32) | 10.27 | 6.24 | 68.23 | 24.88 | 75.12 | 0.63 | 0.131 | 0.502 |
| Atha Sail (G33) | 10.71 | 6.25 | 70.18 | 16.29 | 83.71 | 0.47 | 0.106 | 0.367 |
| Latha Sail (G34) | 9.29 | 6.61 | 73.16 | 17.51 | 82.49 | 0.78 | 0.166 | 0.614 |
| Haladhar Sali (G35) | 9.14 | 6.17 | 72.16 | 22.27 | 77.79 | 0.93 | 0.185 | 0.745 |
| Chatri Sail (G36) | 9.38 | 5.31 | 74.14 | 25.06 | 74.94 | 0.69 | 0.138 | 0.549 |
| Maghi Sail (G37) | 8.93 | 4.52 | 78.14 | 22.66 | 77.34 | 0.75 | 0.107 | 0.639 |
| Mala (G38) | 8.57 | 5.17 | 79.63 | 16.13 | 83.87 | 1.08 | 0.182 | 0.902 |
| Dome Sail (G39) | 7.90 | 5.91 | 71.13 | 23.44 | 76.56 | 0.72 | 0.145 | 0.575 |
| Agani Sali (G40) | 7.27 | 5.73 | 76.15 | 24.17 | 75.83 | 1.03 | 0.166 | 0.861 |
| Rashi (G41) | 8.25 | 4.33 | 72.24 | 23.82 | 76.18 | 0.85 | 0.159 | 0.694 |
| Hathi Sali (G42) | 8.90 | 4.85 | 73.22 | 15.25mim | 84.75max | 1.14max | 0.213 | 0.927 |
| Shem Sail (G43) | 10.03 | 5.33 | 70.58 | 22.81 | 77.19 | 0.63 | 0.105 | 0.525 |
| Daura Sail (G44) | 9.18 | 5.44 | 71.07 | 15.34 | 84.66 | 0.46 | 0.136 | 0.324 |
| Chingra Sail (G45) | 9.26 | 6.20 | 71.85 | 24.26 | 75.74 | 0.41 | 0.135 | 0.279max |
| Khasi Dhan (G46) | 9.18 | 6.15 | 73.42 | 25.23 | 74.77 | 0.58 | 0.146 | 0.434 |
| Malati (G47) | 10.39 | 6.23 | 70.17 | 22.35 | 77.65 | 0.69 | 0.190 | 0.504 |
| Zoli (G48) | 10.20 | 4.10max | 70.57 | 16.26 | 83.74 | 0.94 | 0.176 | 0.764 |
| Lalia Sail (G49) | 11.26 | 4.64 | 68.88 | 24.80 | 75.20 | 0.61 | 0.135 | 0.479 |
| SE d± | 0.033 | 0.11 | 0.043 | 0.046 | 0.074 | 0.02 | 0.0032 | 0.02 |
| CD 0.01 | 0.086 | 0.295 | 0.11 | 0.12 | 0.195 | 0.05 | 0.009 | 0.05 |
SE d±: Standard error of difference, CD 0.01: Critical difference at 1% probability level,* min: minimum mean value, *max: maximum mean value, c: Mean values of check varieties
Ranking of genotypes based on eight biochemical characters like total soluble protein content, crude protein content, starch content, amylose content, amylopectin content, total soluble sugar content, total reducing sugar content and total non-reducing sugar content were done on the genotypic mean over replication as per scale presented in the Table 3. The ranks of the different genotypes with respect to eight different biochemical characters are presented in the Table 4.
The rank correlation studies revealed that ranks of total soluble protein content had a significant positive correlation with the ranks of crude protein content, starch content, amylose content, amylopectin content, total soluble sugar content, total reducing sugar content and total non-reducing sugar content. Nine (9) genotypes were selected amongst all the genotypes on the basis of lower total cumulative rank. The selected genotypes were Chandmoni (G20) [Total rank (TR) =21], Bar Madhava (G28) [TR=22], Matonga (G11) [TR=31], Soularpona (G7) and Mala (G38) [TR=35], Soulpona (G1) [TR=37], Lati Sali (G2), Dudh Mula (G24) and Hathi Sali (G42) [TR=38]. These genotypes hold potential for use as parents in future hybridization program for transferring the desirable gene (s) for biochemical traits into other varieties.
Table 3: Assigned ranks on the performance of genotypes with respect to eight biochemical traits
| Assigned Rank | Crude protein content %N x 5.95 | Total Soluble protein content (g/100g of oven dry sample) | Starch content
(g/100g of oven dry sample) |
Amylose content (% of starch) | Amylo-pectin content (% of starch) | Total soluble sugar content (g/100g of oven dry sample) | Total reducing sugar content (g/100g of oven dry sample) | Total non- reducing sugar content (g/100g of oven dry sample |
| 1 | 13.20-12.58 | 6.72-6.45 | 79.88-78.45 | 25.62-24.52 | 84.83-83.73 | 1.20-1.11 | 0.367-0.340 | 0.960-0.887 |
| 2 | 12.58-11.96 | 6.45-6.18 | 78.45-77.02 | 24.52-23.42 | 83.73-82.63 | 1.11-1.02 | 0.340-0.313 | 0.887-0.814 |
| 3 | 11.96-11.34 | 6.18-5.91 | 77.02-75.59 | 23.42-22.32 | 82.63-81.53 | 1.02-0.93 | 0.313-0.286 | 0.814-0.741 |
| 4 | 11.34-10.72 | 5.91-5.64 | 75.59-74.16 | 22.32-21.22 | 81.53-80.43 | 0.93-0.84 | 0.286-0.259 | 0.741-0.668 |
| 5 | 10.72-10.10 | 5.64-5.37 | 74.16-72.73 | 21.22-20.12 | 80.43-79.33 | 0.84-0.75 | 0.259-0.232 | 0.668-0.595 |
| 6 | 10.10-9.48 | 5.37-5.10 | 72.73-71.30 | 20.12-19.02 | 79.33-78.23 | 0.75-0.66 | 0.232-0.205 | 0.595-0.522 |
| 7 | 9.48-8.86 | 5.10-4.83 | 71.30-69.87 | 19.02-17.92 | 78.23-77.13 | 0.66-0.57 | 0.205-0.178 | 0.522-0.449 |
| 8 | 8.86-8.24 | 4.83-4.56 | 69.87-68.44 | 17.92-16.82 | 77.13-76.03 | 0.57-0.48 | 0.178-0.151 | 0.449-0.376 |
| 9 | 8.24-7.62 | 4.56-4.29 | 68.44-67.01 | 16.82-15.72 | 76.03-74.93 | 0.48-0.39 | 0.151-0.124 | 0.376-0.303 |
| 10 | 7.62-7.00 | 4.29-4.02 | 67.01-65.58 | 15.72-14.62 | 74.93-73.83 | 0.39-0.30 | 0.124-0.097 | 0.303-0.230 |
Table 4: Ranking of bold grained rice genotypes on the basis of mean performance of different biochemical traits.
| Genotypes | Total Soluble protein content (g/100g of oven dry sample) | Crude protein content
%N X 5.95 |
Starch content
(g/100g of oven dry sample) |
Amylose content (% of starch) | Amylo-pectin content (% of starch) | Total soluble sugar content (g/100g of oven dry sample) | Total reducing sugar content (g/100g of oven dry sample) | Total non- reducing sugar content (g/100g of oven dry sample) | Total rank (TR) |
| G1 | 4 | 3 | 6 | 4 | 6 | 4 | 6 | 4 | 37# |
| G2 | 2 | 2 | 1 | 7 | 3 | 7 | 9 | 7 | 38# |
| G3 | 5 | 4 | 9 | 3 | 5 | 9 | 9 | 9 | 53 |
| G4 | 4 | 6 | 7 | 3 | 8 | 10 | 10 | 10 | 58 |
| G5 | 2 | 6 | 8 | 3 | 7 | 9 | 10 | 9 | 54 |
| G6 | 6 | 4 | 7 | 2 | 9 | 8 | 9 | 8 | 53 |
| G7 | 3 | 2 | 2 | 5 | 6 | 5 | 7 | 5 | 35# |
| G8 | 3 | 7 | 6 | 1 | 9 | 7 | 8 | 7 | 48 |
| G9 | 4 | 3 | 1 | 8 | 2 | 8 | 10 | 8 | 44 |
| G10 | 5 | 3 | 10 | 1 | 8 | 5 | 8 | 6 | 46 |
| G11 | 3 | 4 | 3 | 3 | 7 | 3 | 4 | 4 | 31# |
| G12 | 8 | 5 | 6 | 7 | 4 | 7 | 8 | 7 | 52 |
| G13 | 8 | 4 | 9 | 1 | 10 | 9 | 10 | 10 | 61 |
| G14 | 8 | 3 | 10 | 3 | 8 | 9 | 10 | 9 | 60 |
| G15 | 3 | 8 | 5 | 7 | 4 | 5 | 9 | 5 | 46 |
| G16 | 10 | 7 | 7 | 1 | 10 | 10 | 10 | 10 | 65 |
| G17 | 8 | 10 | 6 | 1 | 9 | 9 | 10 | 9 | 62 |
| G18 | 4 | 4 | 8 | 4 | 7 | 6 | 9 | 6 | 48 |
| G19 | 6 | 10 | 8 | 2 | 9 | 10 | 10 | 10 | 65 |
| G20 | 2 | 1 | 1 | 9 | 1 | 2 | 1 | 4 | 21# |
| G21 | 3 | 1 | 7 | 7 | 4 | 5 | 10 | 4 | 41 |
| G22 | 4 | 4 | 5 | 6 | 4 | 4 | 9 | 4 | 40 |
| G23 | 6 | 4 | 10 | 3 | 8 | 3 | 4 | 4 | 42 |
| G24 | 5 | 4 | 4 | 1 | 9 | 4 | 7 | 4 | 38# |
| G25 | 6 | 10 | 7 | 4 | 7 | 9 | 9 | 10 | 62 |
| G26 | 4 | 8 | 7 | 8 | 3 | 3 | 6 | 3 | 42 |
| G27 | 2 | 8 | 8 | 7 | 3 | 7 | 10 | 6 | 51 |
| G28 | 1 | 1 | 1 | 8 | 2 | 1 | 7 | 1 | 22# |
| G29 | 5 | 3 | 7 | 3 | 8 | 6 | 9 | 6 | 47 |
| G30 | 6 | 6 | 7 | 3 | 7 | 9 | 10 | 9 | 57 |
| G31 | 3 | 4 | 8 | 2 | 8 | 5 | 8 | 5 | 43 |
| G32 | 2 | 5 | 9 | 1 | 9 | 7 | 9 | 7 | 49 |
| G33 | 2 | 5 | 7 | 9 | 2 | 9 | 10 | 9 | 53 |
| G34 | 1 | 7 | 5 | 8 | 3 | 5 | 8 | 5 | 42 |
| G35 | 3 | 7 | 6 | 4 | 7 | 4 | 7 | 3 | 41 |
| G36 | 6 | 7 | 5 | 1 | 9 | 6 | 9 | 6 | 49 |
| G37 | 9 | 7 | 2 | 3 | 7 | 6 | 10 | 5 | 49 |
| G38 | 6 | 8 | 1 | 9 | 1 | 2 | 7 | 1 | 35# |
| G39 | 4 | 9 | 7 | 2 | 8 | 6 | 9 | 6 | 51 |
| G40 | 4 | 10 | 3 | 2 | 9 | 2 | 8 | 2 | 40 |
| G41 | 9 | 8 | 6 | 2 | 7 | 4 | 8 | 4 | 48 |
| G42 | 7 | 7 | 5 | 10 | 1 | 1 | 6 | 1 | 38# |
| G43 | 6 | 6 | 7 | 3 | 7 | 7 | 10 | 6 | 52 |
| G44 | 5 | 7 | 7 | 10 | 1 | 9 | 9 | 9 | 57 |
| G45 | 2 | 7 | 6 | 2 | 9 | 9 | 9 | 10 | 54 |
| G46 | 3 | 7 | 5 | 1 | 10 | 7 | 9 | 8 | 50 |
| G47 | 2 | 5 | 7 | 3 | 7 | 6 | 7 | 7 | 44 |
| G48 | 10 | 5 | 7 | 9 | 1 | 3 | 8 | 3 | 46 |
| G49 | 8 | 4 | 8 | 1 | 9 | 7 | 9 | 7 | 53 |
| Correlation (rk) with total soluble protein content | 0.97** | 0.97** | 0.956** | 0.966** | 0.969** | 0.95** | 0.966** | ||
** Highly significant at 1% probability level, # Selected genotype based on total rank performance
Conclusion
Nine bold grained rice genotypes were selected out of 47 bold grained rice genotypes on the basis of lower total cumulative rank obtained from the performance of eight biochemical traits. The selected bold grained rice genotypes were Chandmoni (G20) [Total rank (TR) =21], Bar Madhava (G28) [TR=22], Matonga (G11) [TR=31], Soularpona (G7) and Mala (G38) [TR=35], Soulpona (G1) [TR=37], Lati Sali (G2), Dudh Mula (G24) and Hathi Sali (G42) [TR=38]. These nine bold grained genotypes could be used as parents in future hybridization programme to transfer the desirable gene or gene block for one or more biochemical traits into the genetic background of a desirable rice variety.
References
- A. Ahmed, I. Borua, and D. Das, Oryza, 35(2): 167-69 (1998).
- AOAC Official Methods of Analysis. Association of Official Analytical Chemists, Washington D.C. (1965).
- K. Binodh, R. Kalaiyarasi, K.Thiyagarajan, and S. Manonmani, Indian J. Genet., 66(2): 107-112 (2006).
- R. Nayak, Indian. J. Genet., 66(1): 35-36 (2006).
- Kandali, S.A. Ahmed, R.C. Borah, C.R. Sarkar and A.K. Pathak, JAAS., (Spl. Vol): 42 (1995).
- Kandali and R.C. Borah, Oryza, 31: 169-173 (1992).
- H. Lowry, N.J. Rosebrough, A.L. Farr and R.J. Randall, J.Biol. Chem., 193: 265-275 (1951).
- Rai Kumar, D. Mazumdar, S. Pal, A.K. Das and A. Bhattacharya, Indian J. Agric. Biochem., 19(1): 1-4 (2006).
- Sadasivam and A. Manickam, Biochemical Methods (2nd edn). New Age International (P) Ltd. Publ. Calcutta, India and Tamil Nadu Agricultural University, Coimbatore, India (1996).
- K. Singh and B.D. Chaudhary, Biometrical methods in quantitative genetic analysis. Pp54. Kalyani Publishers, Ludhiana (1985).
- Panse, V.G. and Sukhatme, P.V., Statistical methods for Agricultural Workers. Pp 147-148. Indian Council of Agricultural Research, New Delhi (1978).
- Thayumanavan and S. Sadasiviam. Plant Foods Hum Nutr., 34: 253 (1984)
- Cerning and Guilbot. Cereal Chem, 50:220 (1973).
- Clegg, K.M., Sci. Food Agric., 50:40 (1956).
- Yemm, E.W. and Willis, A.J., Ann Bot., 30:291 (1954).
- Firmin, A., Food Chem., 39: 357-362 (1991).
- Latha, R., Senthilvel, S. and Thiyagarajan, K., Indian J. Genet., 65(1): 45-46 (2005).

This work is licensed under a Creative Commons Attribution 4.0 International License.


