

Manuscript accepted on : March 26, 2009
Published online on: 22-06-2009
Blessing O. Okperi1, Angela A. Okolo2 and BlaIse Ebiringa Anyanwu3
1Department of Paediatrics, Faculty of Clinical Sciences, College of Health Sciences, Delta State University, P.O.Box 1737, Effurun, Delta State Nigeria.
2Department of Child Health, College of Medical Sciences, University of Benin, Benin City Nigeria.
3Blaise Ebiringa Anyanwu Faculty of Clinical Sciences, College of Health Sciences, Delta State University Delta State Nigeria.
Corresponding Author E-mail: ofejiro@yahoo.com
ABSTRACT: The nutritional status indicated by weight,height and body mass index of two hundred and seventy five new primary school entrants (NPSE) randomly selected from one private and ten public prmary schools in Egor local government area (LGA) were studied comparing the helminth infested with the non helminth infested comparison group.The prevalence of intestinal helminth was 34.2%. Ascaris lumbricoides (AL) was the predominant helminth (24.4%) followed by the hookworms (HK) (Necator americanus and Ancylostoma duodenale) making up 1.8%. Tricuris tricuria (TT) was 0.7% and 7.3% had poly parasitism.. There was also no significant difference between the mean weight,height and body mass index (BMI) of infested and non infested NPSE.
KEYWORDS: Intestinal helminths; Nutritional status; New primary school entrants (NPSE)
Download this article as:| Copy the following to cite this article: Okperi B. O, Okolo A. A, Anyanwu B. E. Nutritional Status of Intestinal Helminth Infested Versus Non Helminth Infested New Primary School Entrants In Egor Local Government Area of Edo State of Nigeria. Biosci Biotechnol Res Asia 2009;6(1) |
| Copy the following to cite this URL: Okperi B. O, Okolo A. A, Anyanwu B. E. Nutritional Status of Intestinal Helminth Infested Versus Non Helminth Infested New Primary School Entrants In Egor Local Government Area of Edo State of Nigeria. Biosci Biotechnol Res Asia 2009;6(1). Available from: https://www.biotech-asia.org/?p=7840 |
Introduction
Children are generally more heavily infested with intestinal helminth than adults and are most likely to suffer the pathological consequences of the infestation through interference with their intake (anorexia), impaired absorption of nutrients, competition with the host for available nutrients and outright consumption of host tissues such as blood consumption in ancylostomiasis. All these could eventually culminates in poor nutritional status of these children. The assessment of the nutritional status of primary school pupils is an important aspect of the school health programme (SHP). In this programme, children are expected to have at least three medical examinations; at entrance, midway through school and at completion.1 The occurrence of jntestinal helminthiasis is universal especially in the developing world2-15. A few studies have reported its prevalence in Nigeria16-20 One of the cardinal aims of the SHP is to identify children with defects and diseases, which may adversely affect their health and education, and to treat such diseases, to ensure optimal health and maximal benefits from their educational opportunities.1 Despite the expected high prevalence of the disease in the region and in spite of the fact that children are most likely to suffer the pathological consequences of the intestinal helminthiasis ultimately culminating in negative impact on their nutritional status and even death in extreme cases, data on childhood intestinal helminthiasis in relation to nutritional status is relatively lacking.
In line with the Child Survival Strategy of growth monitoring and treatment of locally endemic diseases, it is necessary to assess the burden of this disease and its impact on the nutritional status of new primary school entrants (NPSE).
Subjects and Methods
Two hundred and seventy five NPSE were randomly selected from eleven primary school of Egor LGA of Edo state.
After collection of the stool specimen from each selected pupil who had no exclusion criteria, the body weight was taken without shoes but with the child wearing only underwears. This was measured using a standing scale calibrated to the nearest 100 grams. The height measurements were obtained using a field mini meter attached to a straight wall calibrated to the nearest 0.5cm as described in Jane’s work.21 A head block is lowered in contact with the ruler to touch the head of the subject being measured who is standing erect with the heels, buttocks and head touching the wall. The heels were held together.
The subjects looked straight ahead with auditory meatus and lower border of the orbit in the same horizontal plane. The subjects were asked to make themselves as tall as possible. The heels were checked to see that they were on the ground before measurements was taken.21
All stool samples collected were examined microscopically within 12 hours of collection. Each stool sample was concentrated by the floatation method using formol saline. Using a hydrometer, the specific gravity of the saline was first checked to ensure that it was between 1.180 and 1.200. Adjustment with distill water was made when necessary. A 5ml test tube was at first one quarter filled with the saline. The tube was then allowed to stand for 45 minutes after which the cover glass was lifted by a straight pull upwards and then placed face downwards on a glass 22.
The entire preparation was then examined microscopically using the Χ40 objective lens. The number and specie of ova of helminth identified was recorded. The stool microscpy was performed by a Medical Laboratory Scientist attached to the Department of Child Health, UBTH Research Laboratory.
Data Analysis
The information obtained from the proforma completed by the parents/guardian of subjects, anthropometric data where collated and entered into the computer and analysed using the software SSPS version 11.0 of the year 2000 and Microsoft Excel. A double check entry approach was adopted to ensure the accuracy of the data entered into the computer. The frequencies of all responses and parameters, the mean, standard deviation (SD) and range of the continuous variables were determined.
Data comparison was carried out using students’ t-test at 95% confidence internal. A 2-tailed p-value less than or equal to 0.05 was considered significant.
For the analysis of the association between worm load and nutritional status (measured by BMI), a two-tailed analysis of variance (ANOVA) was used to compare multiple mean values. Probability (p) values less than 5% (0.05) were accepted as statistically significant.
The measure of association ( R2 ) between BMI and worm load were determined and values greater than 0.85 were considered significant. The ranges and means are represented by box plot figures.
Data were categorized as appropriate in line with the specific objectives. The height and weight variables for infested and non-infested NPSE were compared to that of NCHS (National Center for Health Statistics) chart. The NCHS growth chart standard was used as reference standard following its recommendation by the World Health Organization as suited for international reference standard. 23 Centile curves were estimated using the Cole’s LMS. The BMI (also known as the Quetelet index) was calculated using the standard formula: Wt (kg)/height2(m). The normal range is taken as between the 5th and 85th centile for the age and sex.
Results
Three hundred and twenty pupils were selected. Forty five of them were not free of exclusion criteria hence 275 subjects were ultimately studied.
The age range of the study population was 4-16 years, mean age was 7 years, the median was 7 years and the mode was 6years. There were 124 males and 151 females with a male: female ratio of 1:1.2
All the schools studied had latrines for use by the NPSE. In the completed proforma returned by the respondents, they all claimed to have toilets at home. All the pupils had footwear on at school and also claimed to wear them regularly at home.
The social class distribution of the study population is shown on Table I
The majority of helminthic infestation was found in the lower social classes. Social class significantly influenced helminthic infestation with the tendency to be infested with decreasing class.
Table 1 : Social Class Distribution of Egor Npse.
| Social class | Total number | Helminth infested
no (%) |
| 1 & 2 (Upper) | 43 | 7 (16.3) |
| 3 (Middle) | 69 | 12 (17.4) |
| 4 & 5 (Lower) | 163 | 75 (46.0) |
Figures in brackets are percentages of total number:
c2 = 24.91 (df = 2): p = 0.0000039
Only three types of helminths were found in the study. Their frequencies are shown in Table II
Table 2: Frequency Table of All Helminths.
| Helminth | Number | % of 94 infested pupils | % of 275 study subject |
| Ascaris lumbricoides (AL) | 67 | 71.3 | 24.4 |
| Hookworms (HK) | 5 | 5.3 | 1.8 |
| Trichuris trichuria (TT) | 2 | 2.1 | 0.7 |
| AL+HK | 12 | 12.8 | 4.4 |
| AL+TT | 8 | 8.5 | 2.9 |
Table III shows the degree of infestation (worm load) of the various helminths.
Table 3: Worm Load of the Various Helminths.
| Helminths | Scanty | Few | Moderate | Total |
| AL | 40 | 46 | 1 | 87 |
| HK | 12 | 5 | 0 | 17 |
| TT | 10 | 0 | 0 | 10 |
Table IV shows the weight distribution by age of male pupils in the study
Table 4: Weight Distribution by Age of Male Npse.
| Age (Years) | Helminth infested
Wt (kg) |
Non helminth infested
Wt (kg) |
| ≤ 5 | 17 n=2 * | 19 n=5 * |
| 6-10 | 21 ± 4 n=41 y | 22 ± 5 n=80 y |
| > 10 | 28 n=2 * | 30 n=2 * |
* Data too small for statistical analysis.
y t = 1.111, p = 0.2690
Figures 1&2 show the weight percentile growth curves of helminth infested and non helminth infested NPSE versus NCHS respectively for males aged 4-12 years. The weight percentiles corresponded to the NCHS standard up until the age of 6 years but fell below the standard progressively with increasing age thereafter, with the NPSE 97th centiles corresponding to the 50th centile of NCHS at 8 years of age and falling further to correspond closely to NCHS 3rd centiles at 11 years There is little difference in weight percentiles between the infested and non-infested NPSE.
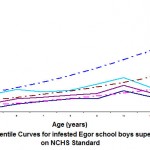 |
Figure 1
|
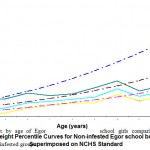 |
Figure 2
|
Table V shows the mean weight by age of Egor school girls comparing the infested and non infested groups.
Table 5: Mean Weight By Age of Female Egor Npse
| AGE (Years)
|
HELMINTH INFESTED
Wt (kg) |
NON HELMINTH INFESTED
Wt (kg) |
|||
| ≤ 5 | 14 n=2 * | 17 ± 3 n=6 * | |||
| 5-10 | 22 ± 4 n=45 y | 22 ± 4 n=84 y | |||
| > 10 | 29 n=2 * | 36 ± 3 n=4 * | |||
* Data too small for statistical analysis.
y t = 0.0, p = 1.0
Figures 3 & 4 show weight percentile curves for female helminth infested and non helminth infested NPSE aged 5-12 years respectively versus NCHS standard. The weight percentiles of the female NPSE for both infested and non-infested where below the corresponding NCHS standard with 97th, and 50th centile of the NPSE corresponding roughly to NCHS 50th and 3rd centiles of the NCHS. The weight centiles of the infested were slightly below those of the non-infested NPSE.
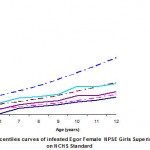 |
Figure 3
|
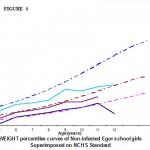 |
Figure 4
|
Table VI shows the mean height by age of Egor school boys comparing the infested and non infested groups.
Table 6: Mean Height Of Male Egor Npse.
| AGE (Years) | HELMINTH INFESTED
Ht ( cm) |
NON HELMINTH INFESTED
Ht (cm) |
| ≤ 5
6-10 >10 |
106 n=2 *
119 ±3 n=41 y 132 n=2 * |
116 ± 3 n=5 *
120 ± 4 n=80 y 134 n=2 * |
* Data too small for statistical analysis.
y t = 1.111, p = 0.2690
Figures 11 & 12 show the height percentile curves of helminth infested and non infested NPSE respectively for Egor males. The percentile curves corresponded roughly with the corresponding NHCS standard at all ages. There was no significant difference in the percentiles curves between the infested and non-infested NPSE.
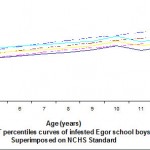 |
Figure 5
|
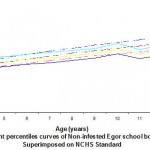 |
Figure 6
|
Table VII shows the mean height of Egor girls comparing the infested and the non infested groups.
Table 7: Mean Height Of Female Egor Npse
| AGE (Years) | HELMINTH INFESTED
Ht (cm) |
NON HELMINTH INFESTED
Ht (cm) |
| ≤ 5 | 106 n=2 * | 110 ± 3 n=6 * |
| 6-10 | 120 ± 4 n=45 y | 121 ± 3 n=84 y |
| >10 | 132 n=2 * | 149 ± 2 n=4 * |
* Data too small for statistical analysis.
y t = 1.601, p = 0.1118
Figures 7 & 8 show height percentile curves for girls aged 5-12 years: NPSE versus NCHS for helminth infested and non infested respectively. The percentile curves of the NPSE corresponded roughly with the NCHS standard. There was no significant difference in the percentile curves between the infested and non-infested groups.
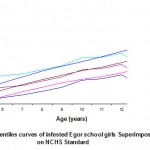 |
Figure 7
|
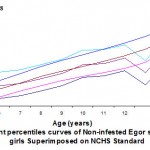 |
Figure 8
|
Table VIII shows the mean BMI of Egor boys comparing the infested and non infested groups.
Table 8: Mean Bmi Of Male Egor Npse.
| AGE (Years) | HELMINTH INFESTED
Ht ( cm) |
NON HELMINTH INFESTED
Ht (cm) |
| ≤ 5
6-10 >10 |
106 n=2 *
119 ±3 n=41 y 132 n=2 * |
116 ± 3 n=5 *
120 ± 4 n=80 y 134 n=2 * |
* Data too small for statistical analysis.
y t = 1.171, p = 0.2438
Figures 9 & 10 show BMI percentile lines for male ages 4-12: NPSE versus NCHS for helminth infested versus non helminth infested respectively. The percentile curves of the NPSE (infested and non-infested) corresponded closely with the NCHS standard until 9 years of age when they gradually fell below the corresponding centile until age 10. The centiles appreciated gradually towards the corresponding centile at 11 years but again continued to remain below the corresponding NCHS centiles at 12 years of age. There was no significant differences between the centiles of the infested and non-infested NPSE.
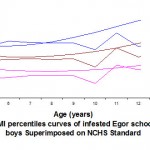 |
Figure 9
|
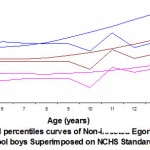 |
Figure 10
|
Table IX shows the mean BMI of Egor girls comparing the infested and the non infested groups.
Table 9: Mean Bmi Of Female Egor Npse.
| AGE (Years) | HELMINTH INFESTED
Ht (cm) |
NON HELMINTH INFESTED
Ht (cm) |
|
| ≤ 5 | 106 n=2 * | 110 ± 3 n=6 * | |
| 6-10 | 120 ± 4 n=45 y | 121 ± 3 n=84 y | |
| >10 | 132 n=2 * | 149 ± 2 n=4 * | |
* Data too small for statistical analysis.
y t = 0.0, p = 1.0
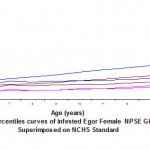 |
Figure 11
|
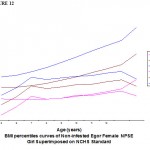 |
Figure 12
|
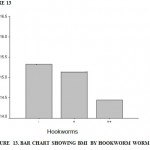 |
Figure 13
|
 |
Figure 14
|
Figures 17 & 18 show the BMI percentiles for females aged 5-12 years. NPSE versus NCHS for helminth infested and non helminth infested respectively. The percentile curves of the NPSE (infested and non-infested) remained below the corresponding NCHS standard at all ages. However, there were no significant differences in the percentile curves between the infested and non-infested NPSE.
Analysis of variance (ANOVA) comparing the mean BMI for the non infested and the infested with varying worm load of HK shows that there is no significant difference.
Analysis of variance (ANOVA) comparing the mean BMI for the non infested and the infested with varying worm load of TT shows that there is no significant difference between the mean ferritin levels between the non infested and the infested and with increasing worm load (p= 0.874).
With fewer than three groups (non infested and scantly infested group only) linearity measures for serum feritin versus TT worm load cannot be computed.
Discussion
Only three different intestinal helminths were found in this study. AL had the highest prevalence of 76.3%, followed by HK(14.9%) while TT had the lowest prevalence of 8.8%. The higher frequency of Ascariasis might be a reflection of the mode of transmission in which the personal hygiene of the school children is an important factor.
Poly parasitism was found in 20 pupils (7.3%) of the population. The mean weight, height and BMI of the infested and non infested children were not significantly different. This suggests that helminthiasis might not be a major determinant of the nutritional status of NPSE in Egor LGA.. However, the descriptive box plots showed a declining trend of BMI with infestation and with increasing worm load. The weight, height and BMI percentile curves were generally below the NCHS corresponding centiles. The poor growth may be due to factors other than intestinal helminths. The insignificant impact of infestation on growth in this study might be explained by the fact that our children had scanty to moderate infestations. This underscores the importance of growth monitoring and appropriate intervention at these ages using the school health programme as a major instrument for this.
The height percentile experienced similar growth spurts for the NPSE at 9 years for the females and 10 years for the males. There was no marked deviation from the NCHS percentiles unlike the weight percentiles which dropped by 10 years to 11 years. The fact that the height of the NPSE was similar to that of NCHS might be a reflection of the lighter influence of worm load on this parameter, given that weight is more readily influenced by acute and recent events than height. Thus the pupils had better growth in height than in weight.
The BMI percentile curve for the NPSE were markedly below the NCHS standards and became progressively more so with increasing age in both sexes. This trend might be a reflection of progressively rising trend in thinness with age in the study population. Considering that there was no significant difference between infested and non-infested pupils,it may safely be concluded that growth pattern was influenced by factors other than helminths. .
Conclusion
The study highlights that the height percentile graphs of NPSE were close to but below the corresponding NCHS centiles while the weights were markedly below the NCHS corresponding centiles for both sexes. The most profound deviations were observed after ten years. The BMI of both sexes were all below the corresponding NCHS centile.
There was no significant difference between the mean weight, height and BMI of infested and non infested NPSE.
There is a trend of declining weight, height, BMI with increasing worm load, but the trend was not statistically significant.
References
- Akani NA, Nkanginieme KEO. In Azubuike JC, Nkanginieme KEO,ed.Paediatrics and Child Health in a tropical region. African educational services, Owerri; 1999:510-520.
- Pawlowski ZS, Schad GA, Stott GJ. Hookworm infection and anaemia Geneva:WorldHealth Organisation, 1991 in Robert M, Suskind, Kraisid Tontisivin. Nutrition, Immunity and Infection in infants and children. Nestle Nutrition Workshop Series. Pediatric program 1991; 45 :407-419.
- Crompton DWT, Whitehead R. Hookworm infections and human iron metabolism. Parasitology 1993; 107:S137-45.
- Pritchard DI, Quinnell RJ, Moustafa M. Hookworm (Necator americanus) infection and storage iron depletion. Trans R Soc Trop Med Hyg 1991; 85:235-8.
- Karyadi E, Gross R, Sastroamidjojo S, Dillon D, Richards AL, Sutanto I, Antihelminthic treatment raise plasma iron level but does not decrease the acute phase response in Jakarta school children. S Asian J Trop Med Pub Hlth. 1996; 27: 742 – 53.
- Morales GA, Pinto de Morales L, Arteaga C, Matinella L, Rojas H, Prevalence of intestinal helminthiasis in 100 municipalities in Venezuala (1989 – 1992). Rev Soc Bras Med Trop.1999;32: 263 – 70
- Hanitrasoamampionoma V, Brutus L, Hebrard G, Raraolimalala VE, Collin A, Razanat Soarilala H, Sellin B, Prod’hon J, Epidemiologic study of the main human intestinal nematodes in the middle west of Madagascar (French). Bull Soc Path Exot 1998;91: 77-80.
- Bouhoum K, Schwartzbrod J. Epidemiological study of intestinal helminthiasis in a Morrakech raw sewage-spreading zone. Zentralblatt for Hygiene and Umweltmedizin. 1998; 200: 553 – 1
- Magnaval J.F, Complementary data on the development of intestinal parasitosis prevalence in Martinique (French). Bull Soc Path Exot 1998; 91: 224 – 5
- Dolo A, Cancrini G, Traore F, Traore S, Kassambara L, Diakite M,Camara F, Doumbo O. Protozoan infections and intestinal helminthasis among the population of a village in the northern Sudan Savannah area of Mali. Parasitologia 1996, 338: 585 – 9.
- Ferraira CB Marcal Junior O. Intestinal parasitoses in school children of Martinesia District, Uberlandia M,G: a pilot study (Portuguese) Rev Soc Bras Med Trop 1997; 30: 373 – 7.
- Raj M, Sein K T, Anuar A K, Mustaffa BE. Effect of Intestinal helminthiasis on intestinal permeability of early primary schoolchildren. Trans R Soc Trop Med Hyg. 1996; 90:666-9.
- Volkheimer G. Intestinal helminthiasis – general practice problem of the gastroenterologist (German) Zeitschrift fur Gastroenterologie.1996; 34: 534 – 41
- Stephenson L, Holland CV, Cooper ES, The public health significance of Trichuris trichiura. Parasitology 2000;121S:73-95
- Callender JE, Walker SP, Grantham-McGregor SM, Cooper ES. Growth and development four years after treatment for the Trichuris dysentery syndrome. Acta Paediatr 1998;87:1247-9
- Musa OI. Intestinal helminthiasis among students seen during school entrance medical examination in Ilorin. J Comm Med Pri Hlth Care 1997;9:35 – 41.
- Fashuyi SA. The prevalence of helminth eggs in human faeces deposited on the streets of Lagos, Nigeria. W Afr J Med 1983; 2:135 – 138
- Adedoyin MA, Anogun IA, Juergensen T. prevalence of intestinal parasitoses in relationship to diarrhoea among children in Ilorin W Afr J Med 1990; 9: 83-88.
- Faslinyi SA, Intestinal helminths in farming communities in Ondo State. W Afr J Med 1992; 11: 13-17.
- Ighogboja IS, Ikeh EI. Parasitic agents in childhood diarrhoea and malnutrition. 1997; 16: 36-39.
- Janes M.D. Physical growth of Nigerian Yoruba children. Trop Geogr Med 1974; 26:389-398.
- Chessbough M, Medical Laboratory manual for tropical countries. 1991; 1:133- 146.
- Hamill VV, Drizid TA, Johnson CL, Reed RB, Roche AF and Moore WM. Physical growth; National Centre for Health Statistics percentiles. Am J Clin Nutri 1979; 32:607-629.

This work is licensed under a Creative Commons Attribution 4.0 International License.


