

Manuscript accepted on : January 04, 2009
Published online on: --
Biochemical and Molecular Aspects of Dna in Raw and Ripen Fruit and Vegetables
Ujjwala Krothapalli, Lakshmi Sai Bharani Nuthi and Vemuri Praveen Kumar*
Department of Biotechnology, Koneru Lakshmaiah College of Engineering, Vaddeswaram, Guntur District - 522 502 India.
Corresponding Author E-mail: vemuripraveen@gmail.com
ABSTRACT: Vegetables, fruits, plant and animal products contain DNA in various amounts. DNA, the carrier of genetic information, the recipes or blueprints of an organism, is made up of four different chemical units. These can be digested and used just like any other nutrient in our food. Usually DNA is degraded during cooking, but even if DNA is eaten uncooked, like in the case of apples, or a salad, the DNA is degraded rapidly in our stomach. Eating DNA should not be a concern: even mother’s milk contains high amounts of DNA, because newborns have a higher need for them. Studies were carried out to give an idea of the amount of DNA we eat and some of its physical properties.
KEYWORDS: DNA, fruits; vegetables; animal products
Download this article as:| Copy the following to cite this article: Krothapalli U. Nuthi L. S. B, Kumar V. P. Biochemical and Molecular Aspects of Dna in Raw and Ripen Fruit and Vegetables. Biosci Biotechnol Res Asia 2009;6(1). |
| Copy the following to cite this URL: Krothapalli U. Nuthi L. S. B, Kumar V. P. Biochemical and Molecular Aspects of Dna in Raw and Ripen Fruit and Vegetables. Biosci Biotechnol Res Asia 2009;6(1).. Available from: https://www.biotech-asia.org/?p=20108 |
Introduction
Deoxyribonucleic acid (DNA) is a nucleic acid that contains the genetic instructions used in the development and functioning of all known living organisms and some viruses. DNA was first isolated in 1869 by Friedrich Miescher. The main role of DNA molecules is the long-term storage of information. DNA is the hereditary material in humans and almost all other organisms. The order, or sequence, of the nucleotide bases present in the DNA determines the information available for building and maintaining an organism. It is this sequence that is referred to as the genetic code, and it is sometimes called the code of life or blueprint of life. The organism which is rich in nucleic acids alternatively has a bigger chance to synthesize proteins through central dogma process. Thus the work indicates the choice of fruit or vegetable in raw or ripen condition for more consumption of nucleic acids into the body. DNA is isolated by placing the cells in a tube containing a special solution and mechanically or chemically breaking the cells open. This causes the cell to release its contents into the solution which may contain enzymes, chemicals, and salts. Enzymes are used to chew up the proteins; chemicals are to destroy any RNA present and salts to help pull the DNA out of solution. The process of extracting DNA from a cell is the first step for many laboratory procedures in biotechnology.
Materials and Mehods
Preparation of smoothie
The various raw and ripen fruits and vegetables like Cucumber, Tomato, Banana and Papaya was obtained form Vijayawada market. They are cleaned thoroughly with distilled water for the removal of contaminants or dust which may degrade the DNA. The surface layer of the fruits and vegetables are peeled out with the help of peeler. They are now made into slices with knife and taken into a large beaker along with 2-3 ml of Phosphate Buffer Saline. The slices are made into smoothie with the help of a blender and the smoothie is collected into a clean and sterile test tube.
Extraction of DNA by tweezers method
5ml of prepared fruit and vegetable smoothie is taken and 1ml of liquid soap is added to it. Then ethanol is added to the smoothie for gradual appearance of DNA at the interface of the two layers. The DNA is collected with glass rod.
Partial purification of DNA by precipitation
The collected DNA is equalized with ion concentration by adding one tenth volume of Sodium Phosphate buffer. Two volumes of ice cold 100% ethanol is added and let it stand in -20°C freezer for 15 minutes and centrifuged at 8000g in a cooling centrifuge. Finally residual ethanol is evaporated in a 370C water bath and DNA pellet is resuspended in desired volume of Tris-EDTA buffer.
Quantification of DNA by Diphenylamine method
DNA was estimated by the diphenylamine reagent (Burton, 1956; Giles & Myers, 1965), using deoxyadenosine as the standard obtained from Merck chemicals. A cocktail is prepared in a test tube by mixing DNA sample, citrated solution, diphenylamine solution and heated the sample at 60 0C in a water bath for 10 minutes. The diphenylamine solution when reacts with DNA forms furfural, which is further heated to get a bluish green coloured complex and is estimated at 595nm in an ELICO SL-159 UV-Visible spectrophotometer.
Characterization of DNA by agarose gel electrophoresis
1% agarose gel is prepared in Tris Acetate EDTA buffer and DNA samples are loaded into it. A standard molecular weight marker obtained from Genei, Bangalore is loaded along with the DNA samples.
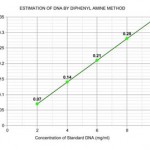 |
Figure 1
|
Results and Discussion
Estimation of standard DNA sample
The graph is constructed by plotting concentration of standard DNA on x-axis and absorbance at 595nm (read at red filter) on y-axis. The graph of standard DNA concentration versus its absorbance showed a linear line, which indicates the increase in the concentration of the DNA content in the solution.
Determination of DNA concentration in raw tomato
Graph is constructed for analyzing the concentration of standard DNA on x-axis and absorbance of DNA solution at 595nm (read at red filter) on y-axis. The graph of standard DNA concentration versus its Absorbance showed a linear line, which passes at the point 0.08 and gives the concentration of DNA of raw tomato as 2.4 mg/ml.
Determination of DNA concentration in ripen tomato
Graph is constructed for analyzing the DNA concentration of standard DNA on x-axis and absorbance of DNA solution at 595nm (read at red filter) on y-axis. The graph of standard DNA concentration versus its Absorbance showed a linear line, which passes at the point 0.16 and gives the concentration of DNA of ripen tomato as 4.6 mg/ml.
Determination of DNA concentration in raw papaya
The above graph is constructed for analyzing the concentration of standard DNA on x-axis and absorbance of DNA solution at 595nm (read at red filter) on y-axis. The graph of standard DNA concentration versus its Absorbance showed a linear line, which passes at the point 0.35 and gives the concentration of DNA of raw papayya as 10 mg/ml.
Determination of DNA concentration in ripen papaya
The above graph is constructed for analyzing the concentration of standard DNA on x-axis and absorbance of DNA solution at 595nm (read at red filter) on y-axis. The graph of standard DNA concentration versus its Absorbance showed a linear line, which passes at the point 0.73 and gives the concentration of DNA of ripen papayya as 20.8 mg/ml.
Determination of DNA concentration in raw banana
The above graph is constructed for analyzing the concentration of standard DNA on x-axis and absorbance of DNA solution at 595nm (read at red filter) on y-axis. The graph of standard DNA concentration versus its Absorbance showed a linear line, which passes at the point 0.14
Determination of DNA concentration in ripen banana
The above graph is constructed for analyzing the concentration of standard DNA on x-axis and absorbance of DNA solution at 595nm (read at red filter) on y-axis. The graph of standard DNA concentration versus its Absorbance showed a linear line, which passes at the point 0.59 and gives the concentration of DNA of ripen banana as 16.8 mg/ml.
Determination of DNA concentration in raw cucumber
The above graph is constructed for analyzing the concentration of standard DNA on x-axis and absorbance of DNA solution at 595nm (read at red filter) on y-axis. The graph of standard DNA concentration versus its Absorbance showed a linear line, which passes at the point 0.14 and gives the concentration of DNA of raw cucumber as 4 mg/ml.
Determination of DNA concentration in ripen cucumberThe above graph is constructed for analyzing the concentration of standard DNA on x-axis and absorbance of DNA solution at 595nm (read at red filter) on y-axis. The graph of standard DNA concentration versus its Absorbance showed a linear line, which passes at the point 0.39 and gives the concentration of DNA of ripen cucumber as 11.2 mg/ml.
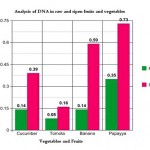 |
Figure 2
|
Analysis of raw and ripen fruits and vegetables
The graph is constructed for analyzing the DNA concentration of various fruits and vegetables in raw and ripen conditions on x-axis and absorbance of DNA solution at 595nm (read at red filter) on y-axis. The graph indicates a clear increase in DNA concentration for ripen fruits and vegetables than that of raw fruits and vegetables. The maximum concentration of DNA is observed in ripen papaya and minimum at ripen tomato. Similarly, the maximum amount of DNA concentration in observed at raw papaya and minimum at raw tomato.
Conclusion
Use of this assay will allow researchers to obtain DNA from fruits and vegetables quickly for use in molecular assays that previously required specialized instrumentation were time-consuming. The main aim of this work was to determine by using molecular markers and quantification assay whether raw and ripen fruits and that of vegetables have the same amount of DNA population. All of the ripen DNA, grouped together by characterization with the standard DNA were identical according to DNA analyses. This suggests that a clonal population of the DNA present in ripen fruits and vegetables are quiet more in amount than that of raw fruits and vegetables.
References
- The Chemistry and Biology of Left-Handed Z-DNA A Rich, A Nordheim, and A H J Wang. Annual Review of Biochemistry Vol. 53: 791-846
- Frozen smoothie kit and method for smoothie preparation, United States Patent 20070042090.
- A simple and rapid method for isolation of high quality genomic DNA from fruit. CS Kim, CH Lee, JS Shin, YS Chung and NI Hyung. Nucleic Acids Research, Vol 25, Issue 5 1085-1086
- Rapid and simple method for purification of nucleic acids. R Boom, C J Sol, M M Salimans, C L Jansen, P M Wertheim-van Dillen and J van der Noordaa. J Clin Microbiol. 1990 March; 28(3): 495-503
- Rapid method for the purification of DNA from subgingival microorganisms. G. L. F. Smith, S. S. Socransky, C. M. Smith. Oral Microbiology and Immunology, Volume 4 Issue 1, Pages 47 – 51
- Molecular Cloning: A Laboratory Manual 3rd Ed. Cold Spring Harbor Laboratory Press. Cold Spring Harbor, NY. Sambrook J, Russel DW (2001).
- The gel electrophoresis of DNA. Biochim Biophys Acta. 1972 May 10; 269(2):192–200. [PubMed]. Aaij C, Borst P.
- Application of agarose gel electrophoresis to the characterization of DNA. J Gen Microbiol. 1979 Sep; 114(1):15–25. [PubMed]. Willshaw GA, Smith HR, Anderson ES.

This work is licensed under a Creative Commons Attribution 4.0 International License.


