

Manuscript accepted on : August 29, 2008
Published online on: 28-12-2008
Determination of mirtazapine in tablet dosage forms by visible spectrophotometry
Ravi Kumar1, V. Naga Lakshmi1, S. V. M.Vardhan2and C. Rambabu3
1Department of Chemistry, Acharya Nagarjuna University Nuzvid Campus, Nuzvid India.
2Department of Biochemistry, Acharya Nagarjuna University Nuzvid Campus, Nuzvid India.
3Department of Chemistry, Acharya Nagarjuna University Nuzvid Campus, Nuzvid India.
ABSTRACT: Two visible spectrophotometric methods have been developed for the quantitative estimation of Mirtazapine from its tablet formulations. The first method (method-A) is based on internal salt formation of red to violet colored chromogen of drug with citric acid – acetic anhydride which shows lmax at 580nm and linearity was observed in the concentration range of 8-40 μg.mL-1. The percentage recovery of drug from tablet formulation using this method was found to be in the range of 99.50-99.83 %. The second developed method (method-B) based on redox reaction of drug with Fe (III) – hexacyano ferrate (III) which shows lmax at 740 nm and linearity was observed in the concentration range of 5-25 μg.mL-1. The percentage recovery of drug from tablet formulation using this method was found to be in the range of 99.15-99.91 % Analysis of results for both developed methods were validated statistically. Recovery study results were close to 100%. The developed methods were found to be simple, rapid, accurate and repro9ducible. Both the methods are suitable for the estimation of mirtazapine from tablet dosage forms.
KEYWORDS: Mirtazapine;hexacyanoferrate(III)
Download this article as:| Copy the following to cite this article: Kumar R, Lakshmi V. N , Vardhan S.V.M ,Rambabu C. Determination of mirtazapine in tablet dosage forms by visible spectrophotometry. Biosci Biotechnol Res Asia 2008;5(2). |
Introduction
Mirtazapine is an antidepressant used in the treatment of mild severe depression. Mirtazapine[1,2] is chemically designated as 2-methyl-1,2,3,4,10,14b-hexahydrobenzo [C] pyrazine[1,2] pyrido [3,2] azepine. It is a presynaptic α2 antagonist, which increases noradrenergic and serotonergic neurotransmission in central nervous system. It is used to treat major depressive episodes. Very few analytical methods HPLC [3-6], LC-MS/MS [7,8], GC-MS [9] RP-HPLC [10]and UV spectrophotometric methods[11] have been reported for the determination of Mirtazapine in pharmaceuticals.. The present paper describes two simple, selective and economical validated visible sperctrophotometric methods for the assay of Mirtazapine in tablets basing on internal salt formation and redox reactions.
Experimental
All spectral measurements were made on ELICO [SL-159]-UV-visible spectrophotometer. All chemicals used are of analytical grade.
Preparation of Reagents
Method-A
Citric acid / Acetic anhydride solution (12%, 6.245×10⁻¹M)
12.0 grams of citric acid monohydrate was dissolved in 5mL of methanol and the volume was made upto 100mL with Acetic anhydride.
Method-B
K3[Fe(CN)6] solution (0.1%, 3.02×10⁻³M)
Prepared by dissolving 100mg of potassium ferricyanide in 100mL of distilled water.
Fe(III)Cl3 solution: (0.054%, 3.32×10⁻³M)
Prepared by dissolving 54mg of anhydrous Fe(III)Cl3 in 100mL distilled water.
HCl solution (1N)
Prepared by diluting 86mL of concentration HCl to 100mL with distilled water and standardized.
Preparation Of Standard Drug Solution
Mirtazapine (pure and formulations) (100mg) was accurately weighed, dissolved in methanol (15.0mL ) and transferred to standard 100mL volumetric flask. The volume was made upto the mark with methanol. The final concentration was brought upto 400 μg.mL-1 for Method-A and 100 μg.mL-1 for Method-B respectively.
Recommended Methods For The Determination Of Mirtazapine
Method-A
Aliquots of the standard mirtazapine solution (0.5-2.5mL, 400μg.mL-1) were transferred into a series of 25.0mL calibrated tubes and gently evaporated on a boiling water bath to dryness. 10.0mL of citric acid /Acetic anhydride reagent was added to each tube. The tubes were placed in a boiling water bath and heated for 30 minutes. The solution in each tube was made upto the mark with acetic anhydride. The absorbance of the colored solutions were measured at 580nm after 15 minutes against a reagent blank prepared in a similar way.
Method-B
Into a series of 10mL calibrated tubes aliquots of standard mirtazapine solution (0.5-2.5mL, 100μg.mL-1) were transferred and 1.0mL of Fe(III)Cl3 solutions was added. The tubes were stoppered immediately and shaken well for 5 minutes. Then 0.5mL of K3[Fe(CN)6]solution was added into each tube and were closed with lids immediately. After 5minutes, 1.0mL of 1N HCl was added and final volume was made upto 10mL with distilled water. The absorbance of the solution in each tube was measured immediately at 740nm against a similar reagent blank.
Results and Discussion
The Method-A is based on when distinctly basic amine (especially tertiary) in Mirtazapine is heated with either citric acid in Acetic anhydride or its dehydration product, aconitic anhydride in Acetic anhydride, red to violet color developed due to the formation of internal salt (scheme-I) which exhibiting λmax at 580 nm. The Method-B is based on the oxidation of mirtazapine by excess ferric salt Fe (III) or Fe3+ to give products of oxidation inclusive of Fe(II) reduced form of oxidant besides unreacted oxidant Fe (III). Fe(II) has been estimated Vis-spectrophotometrically by using selective regent such as hexacyano ferrate (III) (scheme-II) , exhibiting λmax at 740nm. Optical characteristics such as Beer’s law limits, molar absorptivity, sandell’s sensitivity linearity, intercepts and slope have been calculated using regression equations which are presented in Table-1. Precision and accuracy of the proposed methods were tested by carrying out the determination of the drug whose concentration lie within Beer’s law limits. The values of standard deviation and percent range of error (0.05% level and 0.01 % level confidence limits) were calculated and are listed in Table-1
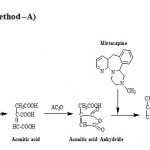 |
Scheme 1
|
Scheme –II (Method –B)
Step I
Mirtazapine + Fe (III) ® oxidation products + Fe (II) + unreacted Fe (III)
Step II
The second step concerns with the estimation of Fe (II) with [Fe (CN)6]3- .
3Fe2+ + 2[Fe (CN)6]3- ® Fe3[Fe (CN)6]2 .
Table 1: Optical Characteristics and Precision
|
Optical Characteristics
|
Method A |
Method B |
|
λ max (run) Beer’s law limits( μg.mL-1 )(C) Molar absorptivity (lit.mol-1cm-1) Sandell’s sensitivity (µg/cm2)-0.001 abs unit |
580 8 – 40 2.37×10³ 0.2344 |
740 5 – 25 6.39×10³ 0.1195 |
| s
Regression equation(Y = a + bc)* |
||
| Slope (b) | 0.0088 | 0.0241 |
| Intercept ( a) | 0.0009 | 0.0002 |
| Correlation coefficient (r) | 0.9999 | 0.9999 |
| % RSD | 0.6669 | 0.3869 |
| Range of errors** | ||
| Confidence limits with 0.05 level | 0.7002 | 0.4062 |
| Confidence limits with 0.01 level
|
1.0981 | 0.6370 |
Y is the absorbance and C is the concentration μg.mL-1
** For six measurements
Analysis of Formulations
Commercial formulations containing mirtazapine were successfully analyzed by each proposed method. The value obtained by the proposed and reference methods for formulations were compared statistically by the t- and F- tests found not to differ significantly. Recovery studies were conducted by analyzing each pharmaceutical formulation in the first instance for the active ingredient by the proposed methods. The results are reported in Table-2.
Table 2: Assay of Mirtazapine in Pharmaceutical Formulations.
|
Formulations* |
Amount taken (mg)
|
Amount found by proposed Methods** |
Reference method |
Percentage recovery by proposed Methods*** |
||
| Tablet – I | 30 |
29.91+ 0. 08 F=1. 266 t=1. 018
|
30.01+0. 21
F=0. 818 t=1. 299 |
29.86+0.19 | 99.51+0. 35 | 99.39+0.12 |
| Tablet – II | 45 |
45.09+0.13 F=3. 698 t=0. 82
|
44.93+0. 06
F=0. 694 t=0. 629 |
44.91+0. 25 | 99.42+0.18 | 99.69+0. 26 |
* Tablets from two different pharmaceutical companies.
** Average + standard deviation of six determinations, the t-and F-test values refer to comparison of the proposed method with the reference method. Theoretical values at 95% confidence limit, F = 5.05, t = 2.262
*** Recovery of 10mg added to the preanalysed pharmaceutical formulations (average of three determinations).
Conclusions
The proposed methods were found to be simple, economical, selective and sensitive. The statistical parameters and recovery study data clearly indicate the reproducibility and accuracy of the methods. Analysis of the authentic samples containing mirtazapine showed no interference from the common excipients. Hence, these methods could be considered for the determination of mirtazapine in the quality control laboratories.
Acknowledgements
The authors are thankful to M/s. Aurobindo Pharma Ltd, Hyderabad, for providing pure drug samples, and to the Head, Department of Chemistry, Acharya Nagarjuna University Nuzvid Campus, Nuzvid, for providing laboratory facilities.
References
- Merck Index 1996, 12th edition, P: 6295.
- G. S Stimmel, J.A.Dopheide and S.M Stahl., Pharmacotheraphy, 17(1), 1997, P.10.
- Briguenti A.C.C, Bonato P.S., Braz.J. Pharm .Sci, 41, 2005, P. 429.
- Zong-DeZhai, Yan – Ping shi and Ting Wang, Analytical chemica Acta, 550,
- 2005, P 123-129.
- T.Sheshasena Reddy, P.Sitadevi, Journal Liq. Chromatography and related Technologies, 31(8), 2008, P.1204-1212.
- L.Labat, P. Dallet, E.Kummer and J.P.Dubost Jour. Pharma and Biomed Analysis, 28(2), 2002, P 365-371.
- Wille S.M.R, Maudens K.E, Van Peteghem C.H and Lambert.WEE. J. Chromato. A 1098, 2005, P.19.
- Briguenti A.C.C, Bonato P.S., Braz.J.Pharm.Sci, 41, 2005, P.429.
- Meineke I, poserW, Ruther E, Brockmoller J,Ther Drug Monit 26,2004, P.277.
- P.Dallet, L.Labat, M.Richard, M.H.Langlois, H.P.Dubost Jour. Liq. Chromatography and related Technologies, 21(1), 2002, P.101-111.
- N.Karas and S.Altinoz, Jour Pharma and Biomed analysis 24(1), 2000, P.11-17.

This work is licensed under a Creative Commons Attribution 4.0 International License.


