

Manuscript accepted on :
Published online on: 09-03-2016
Spectrophotometric Estimation of Tenofovir in Pharmaceutical Formulations
Appala Raju1, J. Venkateswara Rao1*, K. Vanitha Prakash2 and K. Mukkanti3
1Department of Pharmaceutical Chemistry, Sultan-Ul-Uloom College of Pharmacy, Mount Pleasant, Road
23, Banjara Hills, Hyderabad - 500 034 India.
3Centre For Environment IST Building, JNTU, Kukatpally, Hyderabad - 500 072 India.
Corresponding Author E-mail: jvrao1963@yahoo.co.in
ABSTRACT: Three simple, accurate, rapid and sensitive methods (A, B and C) have been developed for the estimation of Tenofovir in its pharmaceutical dosage form. The Method A is based on the formation of orange red colored chromogen, due to reaction of Tenofovir with p-Dimethyl amino cinnamaldehyde (PDAC) reagent in methanol, which exhibits l max at 530 nm. Method B is based on the reaction of Tenofovir with 4-aminophenazone (4-AP) in the presence of Sodium periodate to form a intense violet colored chromogen, which shows maximum absorbance at 545 nm. The Method C is based on the formation of blood red colored chromogen with Ferric Chloride and 1,10-phenanthroline which shows absorption maximum at 512 nm. The absorbance-concentration plot is linear over the range of 1-7 mcg/ml for Method A, 5-50 mcg/ml for Method B and 1-15 mcg/ml for Method C. Results of analysis for all the methods were validated statistically and by recovery studies. The proposed methods are economical and sensitive for the estimation of Tenofovir in bulk drug and in its formulations.
KEYWORDS:
UV-Visible Spectrophotometry; Tenofovir; Ferric chloride; methanol; Sodium periodate
| Copy the following to cite this article: Raju A, Rao J. V, Prakash K. V, Mukkanti K. Spectrophotometric Estimation of Tenofovir in Pharmaceutical Formulations. Biosci Biotechnol Res Asia 2008;5(1) |
| Copy the following to cite this URL: Raju A, Rao J. V, Prakash K. V, Mukkanti K. Spectrophotometric Estimation of Tenofovir in Pharmaceutical Formulations. Biosci Biotechnol Res Asia 2008;5(1) Available from: https://www.biotech-asia.org/?p=6989 |
Introduction
Tenofovir1is a acyclic phosphonate nucleotide analogue, chemically (1-R)-2-(6-amino-9H-purin-9-yl-)-1-methoxy)methyl phosphonic acid monohydrate. It is official in Indian pharmacopoeia. It’s molecular weight is 287.21 with molecular formula C9H14N5O4P. Tenofovir is a nucleotide reverse transcriptase inhibitor used in combination with other antiretrovirals for the treatment HIV infection2,3,4. Survey of literature reveals that the drug is determined by using HPLC5-10 in biological fluids. However no study has been done to estimate the tenofovir in pharmaceutical dosage forms by visible spectrophotometric methods. The present investigation aims to develop simple, sensitive, accurate, rapid and cost effective spectrophotometric methods A, B, and C for the estimation of Tenofovir in its tablet formulations.
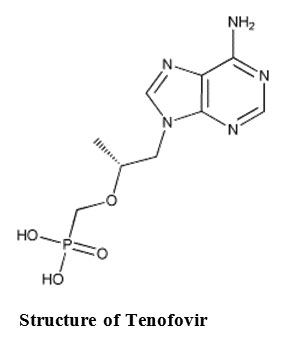
Structure of Tenofovir
Experimental
Instrument
Elico Ultraviolet-Visible double beam spectrophotometer SL-164 with 1 cm matched quartz cells was used for all spectral measurements.
Reagents
All the chemicals used were of analytical reagent grade.
1,10-phenanthtoline-( 0.2 M) AR Grade: 780 mg 1,10-phenanthtoline in 25 ml of in distilled water.
o-Phosphoric acid-(0.2 M) AR Grade :
Ferric chloride hexahydrate (0.03 M) AR Grade: 405 mg of Ferric chloride hexahydrate is dissolved in 50 ml of distilled water.
4-aminophenazone (4-AP) AR Grade – (0.5% w/v): 500 mg of 4-AP is dissolved in 100 ml of distilled water.
Sodium periodate-(0.5% w/v) AR Grade: 500 mg of Sodium periodate in 100 ml of distilled water.
p- Dimethylamino cinnamaldehyde-(PDAC) AR Grade (3%w/v): 3 gms of PDAC is dissolved in methanol.
Methanol AR grade.
Sulfuric acid (0.1N) AR Grade.
Procedure
Standard stock solution was prepared by dissolving 10 mg of Tenofovir in distilled water. The volume was made upto 10 ml with distilled water to get a concentration of 1000 mcg/ml. This was further diluted to get the working standard solution of 20 mcg/ml for method A and 100 mcg/ml for method B&C.
Assay Procedure
Method A
Aliquots of standard drug solution of Tenofovir 0.5 – 3.5 ml
(20 mcg/ml) were taken and transferred into series of 10 ml graduated test tubes. To each test tube 2ml of methanolic p-Dimethylamino cinnamaldehyde( 3%w/v) (PDAC) and 0.5ml of H2S04(0.1N) were added. After thoroughly shaking, the test tubes were set aside for 10 mins, for the reaction to complete. The volumes in each test tube were adjusted to 10 ml with methanol. The absorbances of the solutions were measured at 530 nm against reagent blank, and the calibration curve was plotted. Similarly the absorbance of the sample solution was measured, and the amount of Tenofovir was determined by referring to the calibration curve.
Method B
Aliquots of standard solutions of Tenofovir containing 0.5-5.0 ml (100µg/ml) were transferred into series of 10 ml graduated test tubes, 1 ml of 4-AP (0.5 % w/v) and 1 ml of Sodium periodate (0.5% w/v) were added to each test tube. The volume was made up to 10 ml with distilled water. The absorbance of the violet colored species was measured at 545 nm against reagent blank. The colored species is stable for 30 min. The amount of Tenofovir present in the sample solution was computed from its calibration curve.
Method C
Aliquots of standard drug solution of Tenofovir containing 0.1-1.5 ml
(100 mcg/ml) were taken and transferred into series of graduated test tubes. To each test tube 2 ml of Ferric chloride (0.03M) and 2 ml of 1,10-phenanthtoline-( 0.2 M) and 0.2 ml of
o-Phosophoric acid were added. The test tubes were allowed to stand in water bath at 700 c for 20 mins. The test tubes were then cooled to room temperature and the solutions were made upto 10 ml with distilled water. The absorbance of the red colored chromogen was measured at 512 nm against reagent blank and a calibration curve was constructed. The absorbance of the sample solution was measured, and the amount of Tenofovir was determined by referring to the calibration curve.
The methods were extended for the determination of Tenofovir from Tablet formulations. Twenty tablets of Tenofovir (Tencef 300mg, Hetero Drugs) were accurately weighed and powdered. Tablet powder equivalent to 100 mg of Tenofovir was dissolved in 50 ml of distilled water, sonicated for 15 mins, filtered and washed with distilled water. The filtrate and washings were combined and the final volume was made to 100 ml with distilled water for all the three Methods. The solution was suitably diluted and analyzed as given under the assay procedure for bulk samples.
The analysis procedure was repeated three times with Tablet formulations and the results of analysis are shown in Table II.
Recovery Studies
To ensure the accuracy and reproducibility of the results obtained, adding known amounts of pure drug to the previously analyzed formulated samples and these samples were reanalyzed by the proposed method and also performed recovery experiments. The percentage recoveries thus obtained were given in Table II.
Results and Discussions
In the present study, the Method A involves quantitative reaction of the drug with PDAC reagent. The reaction is based on the condensation of Tenofovir with methanolic p-dimethylaminocinnamaldehyde, in acidic media thereby producing orange red colored chromogen with maximum absorbance of 530 nm. Stability study of the developed chromogen was carried out by measuring the absorbance values at time intervals 15 min for 3 hrs, and it was found to be stable for more than 3 hrs at room temperature. The linearity was found to be in the concentration range of 1-7 mcg/ml.
The Method B is based on the reaction between 4-aminophenazone (4-AP) and Tenofovir in the presence of Sodium periodate results on resulting in formation of violet colored antipyrine dye, with absorjption maximum at 545 nm. The linearity was found to be in the concentration range of 5-50 mcg/ml. The colored chromogen was stable for 30mins.
The Method C is based on the reduction of Ferric chloride to ferrous form by the drug, which forms complex with 1,10 -phenanthtoline to yield red colored chromogen, having absorbance maximum at 512 nm. The linearity was found to be in the concentration of 1-15 mcg/ml. The colored chromogen was stable for 3 hrs.
The optical characteristics such as absorption maxima, Beer’s law limits, molar absorptivity and Sand ell’s sensitivity are presented in Table I.
Table 1: Optical Characteristics and Precision Data.
| Parameters | Method A | Method B | Method C |
| l max (nm) | 530 | 545 | 510 |
| Beer’s law limits | 1-7 | 5-50 | 1-15 |
| Molar absorptivity (l/mol.cm) | 4.46x 10³ | 0.68 x 10³ | 1.8 x 10³ |
| Sand ell’s sensitivity
(micrograms/cm2/0.001 absorbance unit) |
0.066 | 0.5025 | 0.15 |
| Regression Equation* (Y)
Slope (m) Intercept (c) |
0.015 – 0.0073 |
0.002 0.011 |
0.006 0.0265 |
| Correlation Coefficient(r) | 0.9998 | 0.9997 | 0.9995 |
| Precision (%Relative Standard Deviation) | 0.689 | 0.072 | 0.0812 |
| Standard error of estimate | 0.0174 | 0.0265 | 0.0255 |
*Y=mx+c, where X is the concentration in micrograms/ml and Y is absorbance unit.
The regression analysis using the method of least squares was made for slope (m), intercept (b) and correlation obtained from different concentrations and the results are summarized in Table I.
The reproducibility and precision of the methods are very good as shown by the low values of coefficient of variance (CV). The Mean percentage recovery value of 99.6% for Method A, 100.4% for Method B and 99.5% for Method C, indicates non-interferences from the formulation excipients. All the validated parameters are summarized in Table II.
Table 2: Assay of Tenofovir in Tablet Formulations.
|
Tablet formulation |
Labelled Amount (mg) |
Amount Obtained (mg)*
By proposed method |
** % Recovery by the
Proposed method |
||||
| Method
A |
Method
B |
Mehtod
C |
Method
A |
Method
B |
Method
C |
||
| 1 | 300 | 299.5 | 301.5 | 299.8 | 99.5 | 99.9 | 99.7 |
| 2 | 300 | 298.5 | 302.3 | 300.2 | 99.4 | 101.2 | 99.3 |
| 3 | 300 | 301.3 | 299.8 | 301.6 | 99.9 | 100.1 | 99.5 |
*Average of three determinations.
** After spiking the sample.
In conclusion, the proposed methods are simple, sensitive, accurate and economical for the routine analysis of Tenofovir in bulk and in its formulations.
Acknowledgement
The authors acknowledge M/s Hetero Drugs Ltd, Hyderabad for the supply of Tenofovir as gift sample and to the Management, Sultan-Ul-Uloom college of Pharmacy, Hyderabad, for providing the necessary facilities to carry out the research work.
References
- S.Budhavari, The Merck Index, 14th edition, 2006, pg#1573.
- C.Sean Sweetman, Martindale-The Complete Drug Reference, 34, 2005, pg# 655.
- Grim S.A., Romandh F., Ann Pharmacother 2003, 37, 849-59, (2003)
- Gallant J.E., Deresinkski.S., Clin Infect Dis 2003;37;944-50, (2003).
- Sparidans, Rolf W.; Crommentuyn, Kristel M. L.; Schellens, Jan H. M.;
- Beijnen, Jos H. Journal of Chromatography, B: Analytical Technologies in the Biomedical and Life Sciences, 791(1-2), 227-233 (English), (2003).
- Jullien, Vincent; Treluyer, Jean-Marc; Pons, Gerard; Rey, Elisabeth. Journal of Chromatography, B: Analytical Technologies in the Biomedical and Life Sciences, 785(2), 377-381 (English),(2003)
- Sentenac, S.; Fernandez, C.; Thuillier, A.; Lechat, P.; Aymard, G. Journal of Chromatography, B: AnalyticalTechnologies in the Biomedical and Life Sciences, 793(2), 317-324(English), (2003).
- Takahashi, Masaaki; Kudaka, Yuichi; Okumura, Naoya; Hirano, Atsushi; Banno, Kazuhide; Kaneda, Tsuguhiro. Biological &Pharmaceutical Bulletin, Pharmaceutical Society of Japan 30(9), 1784-1786 (English) (2007)
- King, Tracy; Bushman, Lane; Kiser, Jennifer; Anderson, Peter L.; Ray, Michelle; Delahunty, Thomas; Fletcher, Courtney V. Journal of Chromatography, B: Analytical Technologies in the Biomedical and Life Sciences, 843(2), 147-156 (English) (2006)
- Gehrig, Anne-Kathrin; Mikus, Gerd; Haefeli, Walter E.; Burhenne, Juergen. Rapid Communications in Mass Spectrometry, 21(16), 2704-2716 (English), (2007).

This work is licensed under a Creative Commons Attribution 4.0 International License.


