

Manuscript accepted on :
Published online on: --
Plagiarism Check: Yes
S. Balaselvakumar1, K. Kumaraswamy 2, S. Srileka3 and N. Jawahar Raj4
1Research Scholar, Department of Geography, Bharathidasan University, Tiruchirappalli - 620 024 (India). 2Reader, Department of Geography, Bharathidasan University, Tiruchirappalli - 620 024 (India). 3Project Associate, Department of Futurology, Madurai Kamaraj University, Madurai (India). 4Lecturer, Department of Geology National College, Tiruchirappalli - 620 001 (India).
ABSTRACT: In this paper an attempt has been made to mapping the land use and land cover categories of Arjuna River basin using the Remote Sensing techniques. The study area, which is located in the southern part of Tamil Nadu. The basin covers an area of about 1687 sq.km. The basin has basin subjected to different kinds of environmental degradation by both man and nature. The analysis will help for better land management for sustainable development. The analysis is based on primary, secondary and ground data. The primary remote sensing data are included IRS (LISS I, II). The interpretation key of the NRSA (1985) has been used for this purpose. The advantage of the remote sensing data over the conventional statistical data is due to its more reliability, accuracy, time saving and cost effective. The present land use / land cover pattern indicates as follow, built land, agricultural land, forest, waste lands and water bodies. These classification of land use were mapped using the GIS software (Arc Info / Arc View)
KEYWORDS: Remote sensing - Geographic Information System (GIS) - Land use
Download this article as:| Copy the following to cite this article: Balaselvakumar S, Kumaraswamy K, Srileka S, Raj N. J. Application Of Remote Sensing Data For Land Use / Land Cover Mapping A Case Study Of Arjuna River Basin, Tamil Nadu. Biosci Biotechnol Res Asia 2003;1(1) |
| Copy the following to cite this URL: Balaselvakumar S, Kumaraswamy K, Srileka S, Raj N. J. Application Of Remote Sensing Data For Land Use / Land Cover Mapping A Case Study Of Arjuna River Basin, Tamil Nadu. Biosci Biotechnol Res Asia 2003;1(1). Available from: https://www.biotech-asia.org/?p=3372 |
Introduction
The unparalleled increase in population growth has resulted in the increasing demands for food, fodder and shelter resources. This calls for rational utilization of the available land and hence the study of its characteristics is crucial in formulating the management and development plans.
The conventional methods for the study of land use involves extensive field study which is time consuming and cumbersome. Land use changes are equipped due to the natural and human activities, it can be observed using current and archived through remotely sensed data (Luong, 1993). The information on land use / land cover patterns, their spatial distribution and changes over a time scale are perquisite for making development plans (Dhinw et al, 1992). Remote sensing, the latest advancement in space technology has the capabilities to overcome the shortcomings of the conventional methods. It makes a major technological breakthrough in the method acquiring information on land resources, agriculture, forestry, ocean resources and other studies. In the present study described the various land use / land cover categories.
Study Area
The study area, which is a sub-basin of Vaippar, is located in the southern part of Tamil Nadu. It is bounded by Gundar basin on the north and other sub-basins of Vaippar on the south. The Western Ghats and Vaduvarpatti odai basin forms the western and eastern boundaries of the study area. It extends from 9°20′ to 9°45′ North latitude and 77°25′ to 78°05′ East longitude (Fig. 1). It covers an area of 1687 sq.km. The average annual rainfall of the basin ranges from 700 to 950mm. Most part of the study area is a plain region. The hilly areas are found confined along the western and the northern most fringes of the area and hence, the high relief areas.
Table. 1 : Land use Categories and areal extent
| Land use / Sub-basin | 1 | 2 | 3 | 4 | 5 | 6 | Total |
| Towns | – | – | 10.075 | 5 | – | 12 | 27.075 |
| Villages | 14.48 | 10.275 | 8.26 | 5.425 | 7.885 | 6.425 | 52.75 |
| Kharif | 55.87 | 15.9 | 19.5 | 5.425 | 8.5 | 7.97 | 114.90 |
| Rabi | 44.31 | 11.295 | 43.22 | 7.15 | 29.65 | 42.75 | 220.36 |
| Double Crop | 66.4 | 22 | 24 | 49.14 | 13.65 | 10.4 | 136.89 |
| Fallow Land | 30.85 | 119.06 | 52.07 | – | 76.85 | 50.5 | 395.85 |
| Plantation | 24.14 | 10 | – | 66.5 | – | – | 34.14 |
| Dence Forest | 60.17 | – | 2.5 | – | – | – | 62.67 |
| Open Forest | 55.1 | – | 10.5 | – | – | – | 65.6 |
| Degraded Forest | 35.95 | – | 3 | – | – | – | 38.95 |
| Land with Scrub | 48.75 | 48.45 | 20.23 | 29.49 | 53.6 | 65.13 | 265.64 |
| Land without Scrub | – | – | 17.07 | 24.51 | 30.43 | 71.08 | |
| Barren and Rocky | 9 | – | 3.5 | 10.33 | – | 3 | 3.5 |
| Water Bodies | 53.97 | 33.02 | 38.9 | 3.5 | 28 | 21.14 | 185.61 |
| Total | 499 | 270 | 253 | 176 | 243 | 246 | 1687 |
The study area is almost extremely covered by metamorphic rocks, which includes different gneieiss, charnockite, limestone and pink granite. The red sandy loam type of soil is found some of the areas, particularly in the central and northern parts of the basin; other soil of skeletal, red sandy, black, alluvial soil area noted in the basin.
Database
The following data products have been utilized for the present study
Survey of India (SOI) topographic maps (58G/ 6,10,14,58k/2 and 3 on 1:50,000 scale
IRS – IB – LISS – II Geocoded data of 1:50,000 scale of February 1993 and Land sat 5 TM data of 1:50,000 scale of August 1993
Methodology
The study has made use of various primary and secondary data. The Indian Remote Sensing Satellite (IRS) and Landsat satellite data were visually interpreted for the study of land use. The interpretation is carried out on 1: 50,000 scale using the image interpretation elements such as tone, texture, shape, pattern, association etc., Adequate field checks were made before ascertaining / finalization of the thematic maps.
Results and Discussion
Analysis of Land use features by Remote Sensing Data
The various land use categories were identified and demarcated (Fig 2). Using IRS – IB LISS II Geocoded and Landsat TM data based on the image interpretation elements. They are described as below.
Built – up land
The built-up lands are areas of human habitation developed due to non-agricultural uses like building, transport, communication, and utilities in association with water, vegetation and vacant lands. These features can be identified with their dark bluish green tone in the core and bluish tone on the periphery. They have a typical coarse and molted texture. These areas are also associated with the network of canals, roads, and railway lines. Apart from the settlement, transportation lines were also identified with their typical straight, sharp and smooth curves.
In the study area, three major settlements are distributed randomly, two of which (Srivilliputhur, Sattur) are found in the southern part and the other in the east (Virundhunager). Few smaller settlements, which represent the minor towns were also mapped and this include Watrap, Peraiyur, Kallupatti, Tiruthangal and others.
The total area covered by the major and minor settlements in the basin constitutes 21.07 and 52.75 sq.km. 4.73% respectively.
Agricultural land
These are the lands primarily used for farming and for production of food, fiber, and other commercial and horticultural crops. By the help of satellite data, it is possible to identify the various agricultural lands upto level III.
The information about the kharif, rabi and double cropped areas were identified with the help of multi date satellite data. The various categories of the agricultural lands identified in the study area are described in detail.
Crop land
These include all the agricultural areas and these could be identified by their characteristic red tone, regular shape of the agricultural fields, association with the water bodies, etc., The crop lands are found well distributed throughout the foot hill zones and plain regions of the study area. By using satellite data of different seasons it was possible to identify the kharif, rabi and double cropped areas. The kharif crops (paddy, groundnut) are cultivated in the months or June, July and August. In the study are, such cropped areas were found mostly in the northwestern portions. The water availability from the nearby higher altitude areas facilitate the cultivation of these crops in these parts. It is interesting to note that such crops are totally absent in the south and the southeastern portions of the study area. Such cropped areas cover approximately 114.90 sq.km. The rabi crops mostly paddy, cholam, cumbu and maize are cultivated during the months of October, November and December. The crops cultivated during this season are found distributed all over the study area and it occupies 220.36 sq.km.
In certain areas, the crops are found to be cultivated in both the kharif and rabi season. The crops include paddy and groundnut. Such areas are categorized under double-cropped areas. These areas are found nearer the tanks, canals and along the rivers and streams and they occupy 136.89 sq.km. (6.81%).
Fallow land
These are the lands, which remain vacant without crop during both the khrif and rabi seasons. These were identified by their dark greenish tone, smaller size, regular shape and medium texture. In the study area, such fallow lands are to be found well distributed in the central and southeastern portions. In the other areas these are to be found sparsely scattered. These occupy 395.84 sq. km. (23.46%).
Plantations
These include areas where crops such as plam trees, coconut, banana, etc. Such areas were identified form their dark red tone, smooth texture and association with foothill areas, etc., In the study area, such plantations are found in the areas between Thaniparai and Watrap, areas along the Periayar, Chittar and Kovilar Rivers, which lie in the western portion of the study area. Approximately the plantation-cropped areas occupy about 29 sq. km. (1.72%).
Forest
Forest, which comprises of thick and dense canopy of tall trees, which predominantly remain green throughout the year. These lands are discerned by their red to dark red tone and varying in sizes. They show irregular shape and smooth texture. These forest areas are found on west, northwest and northern tracts. It is found on the hill slope of Thaniparai, Perumalswami Uchi, Rajamparai, Valangai Mottai, Thaniparai Medu, Muriamppanjam Mottai, Karikkadan Kombu and Kamba Ittu Malai. Based on the tonal and textural variations, the forests of the study area were divided into three categories as dense, open and degraded.In the study area, the various forest classes, their distribution and their characteristics are described in the following sections.
Dense forest
Dense forests are those areas, which have crown cover of 40 per cent and over. These forests have a characteristic dark red tone, smooth texture and are irregular in shape. In the study area, such dense forest areas are found in the west and northwestern areas. It includes, Kamba Ittu Malai, Thungan Kadavu, Kukka Muttu Malai, Perumal Swami Uchchi and Ser Malai. These forests are found confined to the higher and medium altitudinal areas. Approximately such dense forests cover and area of about 62.67 sq. km. (3.71%)
Open forest
In this forest category, the crown cover varies from 10 to 40 percent and the concentration of trees is less. This forest category can be identified from its dark red to medium red tone, irregular shape and medium texture. In the study area, such open forests are found in western and northwestern areas and are associated with the areas nearer the dense forests. Such forests are found in medium and low altitude areas. Approximately these forests cover an area of about 65.6 sq. km. (3.88%)
Degraded forest
The forests of this category have limited crown cover (about 10 per cent) and occupy an area of (2.31%) nearly covering by 38.95 sq.km. The relative concentration of scrubs, bushes and smaller trees are predominant. Taller trees are limited. In remotely sensed data, such forests were identified by yellow tone and their proximity to the other mentioned forest areas. These forests are found in lower altitudes of the hill areas and found associated with other forests.
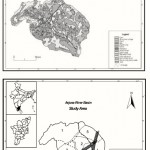 |
Figure 1 |
Waste lands
Land, which in its present state does not or only possess limited ability to support vegetation, is called wasteland. Eroded soil, ravine, rock, sand dunes and active depositional features are included in this category. These may result form inherent / imposed constraints such as location, environment, chemical and physical properties of the soil. In the study area, there are three categories of wastelands, which could be easily identifiable from the satellite image.
Land with scrub
These include the uplands or high grounds with scrub. These lands are subjected to degradation or erosion and consist mainly of thorny bushes. Such areas were identified from their yellowish tone and their association with uplands, and their irregular shapes. These areas are found near Srivilliputhur, Sivakasi and their surroundings. The total area under this category is about 265.64 sq. km. (15.75%).
Land without scrub
These lands area also found associated with higher topography and are formed by degradation or erosion. It could be identified in the satellite data from its light yellow tone, and its association with the higher altitudes. The absence of vegetation distinguishes this category form the earlier described one. In the northern part of Sivakasi and near Sattur such areas are found to occur. This category occupies 71.08 sq. km. (4.21%).
Barren rocky
These are rocky exposures of varying lithology often barren and devoid of soil cover and vegetation. They occur amidst hill forests as openings or scattered as isolated exposures or loose fragments of boulders or as sheet rocks on uplands and plains. In the study area, these lands are appeared as brownish colour and they are irregular in shape. These barren rocky and stony wastes are found in surroundings of the hilly regions. The barren rocky areas are cover 15.5 sq.km.(0.91%).
Water bodies
Both man-made and natural water features covered with water are included in this category. i.e. rivers / streams, lakes, tanks and reservoirs. The water features appear black in tone in the satellite imagery. They shallow water and deep water features appear in light blue to dark blue in colour. In the study area, a number of tanks are evenly placed all over the basin except southeastern portion. The lakes and tanks can be delineated very easily by using land sat imagery.
In some of the tanks energy plants, scrubs and bushes cover them. They appear as light red in tone. The area under water body in the basin is covered by 191.61 sq.km (11.36%). A few reservoirs are also found in the northwestern hilly area and in southeastern parts of the study area.
Table 2: Land use / Land cover Classification of Arjuna River basin
| Level I | Level II | Area in sq. km. | Percentage of |
| Basin Area | |||
| 1. Built up land | 1.1 Built up land | 79.82 | 4.73 |
| 2. Agricultural land | 2.1 Crop land | ||
| a. Kharif | 114.90 | 6.81 | |
| b. rabi | 220.36 | 13.06 | |
| c. Double crop | 136.89 | 8.11 | |
| 2.2. Fallow land | 395.84 | 23.46 | |
| 2.3. Plantations | 29 | 1.72 | |
| 3. Forest | Dense forest | 62.67 | 3.71 |
| Open forest | 65.6 | 3.88 | |
| Degraded forest | 38.95 | 2.31 | |
| 4. Waste lands | Land with scrub | 265.64 | 15.75 |
| Land without scrub | 71.08 | 4.21 | |
| Barren rocky | 15.5 | 0.91 | |
| 5. Water bodies | River/ stream / lake/ | ||
| Reservoir/ tank/ canal | 191.61 | 11.36 |
Conclusion
The land use categories of the study area were mapped with the help of IRS and Landsat data. The land use categories were demarcated viz. built-up lands, agricultural lands, forests, wastelands and water bodies. The built-up lands include towns and villages/ minor towns. The total area covered by this land use category is about 74 sq.km. In area under agricultur, it was possible to identify the croplands, fallow lands and plantations. Using multi date satellite data it was possible to identify the kharif, rabi and double cropped areas. Agricultural areas are to be found well distributed throughout the study area and their aerial extent were calculated and tabulated
The forests of the study area are confined to sub basins 1 and 3 covering the hill slopes of Thani parai, Perumal Swami uchi, Rajam parai, Valangai mottai, Thani parai medu, Mariyampanjam mottai, Karikkadan kombu and Kamba ittu malai. The forests occupy about 166 sq.km. Of these, open forests occupy more areas than the dense and degraded forests. Wasteland categories, such as land with / without scrubs and barren rocky areas were demarcated. The land with / without scrubs areas are found near Srivilliputhur, Sivakasi, and Sattur areas, while the barren rocky areas are found in the vicinity of the hilly areas.
In the water body category, features such as rivers / streams, tanks and reservoirs were delineated. In the study area, several streams / rivers representing the Periyar, Meenakshipuram, Mannarkottai, Mel uppu odai, Kaushiha Mahanadhi etc. were identified. The tanks were to be found well distributed throughout the study area, except in the southern area where they are less. A few reservoirs were also identified in the northwestern hill and in the southeastern parts of the study area. GIS techniques (using software Arc View/ Arc Info) applied for preparation of land use mapping of Arjuna river basin.
References
- Anderson James, R., Land Use and Land Cover Changes: A Frame Work for Monitoring, Journal of Research, United States Geological Survey (U.S.G.S), 5(2), 143-153 (1979)
- Cautam, N,C., and L.R.A Narayan., Land Use and Land Cover Mapping and Change Detection in Tripura using Land sat Satellite Data’s, Journal of Indian Society of Remote Sensing, 6(3&4), 517-528 (1985)
- Mulder, J. Integrating Water Resource and Land use Planning, Logan, Utah Water Research Laboratory, Utah State University (1979)
- National Remote Sensing Agency, Manual of Nation wide Land use / Land cover Mapping using satellite imagery, Part – I, NRSA, Hyderabad (1989)
- Pathak R.C and J.M. Kate., Land Use Mapping by Air photo Techniques, Journal of Indian Society of Remote Sensing, 16(2), 47-52 (1988)
- Rao, D.P., IRS IA Application for Land Use / Land Cover Mapping in India, Current Science, 61(3&4), 153-167 (1991)
- Rekha Ghosh, Study of Drainage Profiles in Jharia Coal fields, Eastern India, from Aerial photos: Implications for Land use Planning, Journal of Indian Society of Remote Sensing, 17(1), 55-62 (1989)
- Sharma, P.R., Spatial Characteristics of Land use and its Efficiency: An Evaluation (A case study of Chattisgarh Region), National Geographer, 13(1), 81-89 (1978)
- Shelton, M.L., Runoff and Land Use in the Deschutes Basin, Annals of the Association of American Geographers, 17(1), 11-27 (1981)
- Shai, B., Land Use Survey of Idukki District Technical Report Prepared Jointly by the Kerala State Land Use Board, Trivandrum and Space Application Centre, Ahemedabad, 109 (1980)

This work is licensed under a Creative Commons Attribution 4.0 International License.


