

Manuscript accepted on : 16-07-2020
Published online on: --
Plagiarism Check: Yes
Reviewed by: Yamini Tiwari
Second Review by: Avinash Cau
Final Approval by: Dr Mohd Ashraf Rather
Lekshmi K. Edison1, Vipin Mohan Dan1, Reji S. R1 and Pradeep N. S2*
1Microbiology Division, KSCSTE-Jawaharlal Nehru Tropical Botanic Garden and Research Institute, Palode, Thiruvananthapuram, Kerala- 695 562, India
2KSCSTE-Malabar Botanical Garden and Institute of Plant Sciences, Kozhikode, Kerala- 673014, India
Corresponding Author E-mail : drnspradeep@gmail.com
DOI : http://dx.doi.org/10.13005/bbra/2862

ABSTRACT: β-glucan rich cereals such as barley and oats serve as a raw material in breweries and also used as an animal feed. Digestion of β-glucan is often a major hurdle, thus providing exogenous enzyme β-glucanase serves as an option. The present study takes an effort for the expression and over production of β-glucanase genes from Streptomyces sp in E. coli. The exo-β-1,4-glucanase and endo-β-1,3-glucanase encoding genes were isolated and codon optimized and significant-high expression levels were obtained in E. coli strain. The expressed enzymes showed broad pH stability, good thermostability, and better affinity towards the barley β-glucan substrate. The study implies that heterologous expression with codon optimization strategy enhances the production of Streptomyces origin beta-glucanase enzymes with prominent physio-chemical properties for efficient beta-glucan degradation.
KEYWORDS: Animal Feeds; Brewing; Beta Glucanase; Industrial Enzymes; Production Enhancement; Streptomyces; Western Ghats
Download this article as:| Copy the following to cite this article: Edison L. K, Dan V. M, Reji S. R, Pradeep N. S. A Strategic Production Improvement of Streptomyces Beta glucanase Enzymes with Aid of Codon Optimization and Heterologous Expression. Biosci Biotech Res Asia 2020;17(3). |
| Copy the following to cite this URL: Edison L. K, Dan V. M, Reji S. R, Pradeep N. S. A Strategic Production Improvement of Streptomyces Beta glucanase Enzymes with Aid of Codon Optimization and Heterologous Expression. Biosci Biotech Res Asia 2020;17(3). Available from: 0 |
Introduction
β- glucan is a chief constituent of sub-aleurone and endosperm cell wall of cereals, found as (1→4)-(1→3) linked β-D-glucopyranose units.1,2,3 Major cereal β-glucan sources are barley and oats and lesser present in rye, wheat, rice, maize, sorghum and millet.4,5 β-glucan rich cereals improve human health6,7 and often used as a dietary replacement of antibiotics in animal feeds.8 β-glucan rich barley is the principal component in breweries, which increases flavor, colour and nutritional properties.9 Besides these beneficial effects, it impairs the energy metabolism in animals such as cattle and poultry and also creates problems in the brewing industry which include inefficient filtration, gels and hazes formations that affects the flavour and taste of beer.10 The addition of exogenous β-glucanases (E.C. 3.2.1.x) can circumvent these negative effects.
β-glucanases can function as exo- and endo-hydrolayes. Exo-enzymes hydrolyses the glycosidic bonds serially from non-reducing ends, while endo-enzymes randomly cuts internal bonds. On account of the type of glycosidic bond cleavage, they are further classified as β-1,4-glucanases, β-1,3-glucanases, β-1,6-glucanases, β-1,4- 1,3-glucanases etc.11 In cereal β-glucan, around 70% of glycosidic linkage is β-(1→4) and the remaining 30% is β-(1→3), hence the complete hydrolysis necessitates the synergic action of different β-glucanases. The ever-growing global demand for beverages and feed enzyme in the market puts significant pressure on industries and thus indirectly raises the future demand of β-glucanases. The major problem related to beta-glucanase commercial availability is the production cost. Few pure β-glucan products are offered from some companies that can be used as the substrate for β-glucanases and these are highly expensive, which in turn increases the overall production outlays of the enzymes. Regarding large scale production, heterologous production has proved to be a better alternative to conventional production.
Industrial enzymes from Streptomyces spp., exclusively isolated from unexplored habitats like Western Ghats regions in Kerala that boasts of unique biodiversity (recognized by UNESCO as a World Heritage Site), are more versatile than other bacterial and fungal enzymes with immense physiochemical properties.12, 13 Unfortunately, the heterologous expression may not deliver the expected outcomes due to high GC content and divergence in codon usage. Heterologous expression with the codon-optimization strategy in enzyme encoding genes has a significant impact on the industrial production of enzymes. The present study details the isolation and purification of exo-β-1,4-glucanase (exo14) and endo-β-1,3-glucanase (endo13) enzymes respectively from Streptomyces althioticus TBG-MR17 and Streptomyces cinereoruber subsp. cinereoruber TBG-AL13 strains, isolated from the Western Ghats habitats of Kerala. The enzyme producing genes were isolated and codon optimized for obtaining high level expression in E. coli host. The over-expressed enzymes were purified and characterised for the efficient degradation of beta-glucan substrates.
Materials and Methods
Beta Glucanases Gene Amplification, Cloning and Sequencing
PCR amplicons of exo14 and endo13 genes from Streptomyces althioticus TBG-MR17 and Streptomyces cinereoruber subsp. cinereoruber TBG-AL13 strains, respectively, were generated using EX4F/EX4R and EN3F/EN3R primers designed from the conserved regions of exo-β-1,4-glucanase and endo-β-1,3-glucanase genes retrieved from the phylogenetic neighboring species of above mentioned Streptomyces strains available in the NCBI database. PCR program included an initial denaturation at 95 ºC for 2 min followed by 35 cycles of denaturation at 95 ºC for 1 min, annealing at 66 ºC for 30 sec and extension at 72 °C for 1.30 sec and a final extension at 72°C for 5 min. The purified amplicons were cloned into pGEM®-T Easy Vector (Promega, USA), transformed to DH5α E. coli cells and sequenced using primers TvectF/TvectR. The primer sequences were shown in Supplementary Table 1.
Sequence Analysis
Open reading frames (ORF) of sequences were determined and the nucleotide sequences were translated to protein, using the ExPASy Translate tool (http://web.expasy.org/translate/). Functional domains and motifs were recognized using the NCBI conserved domain database (CDD) search.14 Signal peptide cleavage sites were predicted by SignalP v4.1 (http://www.cbs.dtu.dk/services/SignalP/). Physico-chemical parameters like molecular weight, theoretical isoelectric point (pI), instability index, half-life, the number of positive (+R) and negative residues (-R), aliphatic index, extinction coefficient and grand average of hydropathicity (GRAVY) values were determined by the EXPASY tool ProtParam (http://web.expasy.org/protparam/).15
Codon Optimization and Gene Synthesis
According to the E. coli codon preference, Streptomyces spp. exo14 and endo13 genes were optimized using the GeneArt™ GeneOptimizer® expert software (Life Technologies-Invitrogen) by employing an approach of sliding window algorithm with multiparametric optimization of DNA sequences considering codon usage, GC content, ribosomal entry sites, and RNA instability motifs. The optimized genes (optexo14 and optendo13) were synthesised as oligonucleotides and assembled by an overlapping batch-Polymerase Extension Reaction. The assembled fragments were cloned into a pMA-T vector (GeneartTM, Germany) and transformed into E. coli K12 OmniMAX™ 2 T1R cells. The purified plasmid constructs were amplified with primers pmaXf/pmaXr (for optexo14) and pmaNf/pmaNr (for optendo13) and verified by sequencing.
Vector Construction
PCR amplification of wild (wl) genes from pGEMT construct and optimized (opt) genes from pMA-T construct were carried out in 20 µL of a reaction mixture comprising 1 µL of 20 ng plasmid, 10 ng of each primer and 10 µL Phusion™ Flash High-Fidelity Master Mix. Primers wlEX-f/wlEX-r and wlEN-f/wlEN-r used correspondingly for wild exo14 and endo13 gene amplifications. Optimized exo14 and endo13 gene amplifications were carried out using primers optEX-f/optEX-r and optEN-f/optEN-r, respectively. Fast and two-step PCR amplification was performed in a temperature profile of an initial denaturation at 98 ºC for 10 sec followed by 30 cycles of denaturation at 98 ºC for 1 sec, extension at 72 °C for 15 sec and a final extension at 72 °C for 1 min. Purified amplicons were cloned into pET101 D-TOPO® vector and transformed to TOP10 E. coli as described by the manufacture’s protocol. The recombinant constructs were validated by restriction digestion using restriction enzymes EcoRI and ClaI for both wl and opt exo14 constructs and EcoRI and SacI for wl and opt endo13 constructs. Finally, the recombinant constructs were sequenced using primers T7 and T7 Reverse to confirm the insertion of the construct is in the frame with proper C-terminal fusion tags.
Protein Expression
BL21 StarTM (DE3) E. coli cells were transformed with pET101 D-TOPO wild (pET101/wlexo14 and pET101/wlendo14) and optimized (pET101/optexo14 and pET101/optendo14) expression constructs. The protein expression was induced with 1 mM IPTG in Terrific Broth (TB) containing 50 μg.mL-1carbenicillin. The proteins were harvested by incubating the cells on ice for 30 min after resuspending in lysis buffer (Sodium phosphate, 50 mM; NaCl, 500 mM; Imidazole, 10 mM) with 1 mg.ml-1 lysozyme, 1% (v/v) protease inhibitor cocktail (Sigma, P8849), 10 μg.mL-1RNase A and 5 μg.mL-1 DNase.
SDS-PAGE and Western Blot Analysis
SDS-PAGE was performed on 12% gel, prepared using TGX™ FastCast™ Acrylamide Kit (Bio-Rad, USA) and stained with Coomassie Brilliant Blue R250. Protein bands were quantified by densitometry using ImageJ v1.52a (NIH, USA) software. For Western blot, the resolved protein samples in SDS-PAGE were transferred to Immobilon®-P PVDF membrane (Merk, India) in a TV100-EBK mini electroblotters (SCIE-PLAS, Cambridge, UK). The membrane was blocked using 5% non-fat dry milk in TBST buffer for 1 h at room temperature, then followed three times washing with TBST buffer. Then it was incubated with Anti-V5-HRP Antibody (1:2000 dilution in TBST) overnight at 4 °C with continuous shaking. After washing twice with TBST, the blot was developed by Di-aminobenzoic acid (DAB) stain and photographed.
Comparison of Protein Quantity and Enzyme Activity of Wild and Optimized Expressions
Protein concentration was determined by Bradford Protein Assay kit (Bio-Rad Laboratories, USA) with bovine serum albumin (BSA) as a standard.16 The enzyme activity of wild, optimized exo14 and wild, optimized endo13 was assayedusing0.5% (w/v) Avicel® PH-10 and 0.2% (w/v) CM-curdlan as substrates, respectively. The assay mixture (substrate, 100mM sodium- acetate buffer, pH- 5.0) was incubated with the enzyme at 37 °C for 1 h and the reaction was stopped by adding DNS reagent.17 The released reducing sugars were quantified by measuring A540. One unit of enzyme activity was denoted as the amount of enzyme required to releasing 1 µmol of reducing sugar from the corresponding substrate per minute.
Purification by Nickel Affinity Chromatography
The soluble crude lysates of recombinant optimised exo14 and endo13 proteins were subjected to Nickel affinity chromatography using Profinity™ IMAC (immobilized metal affinity chromatography) Nickel charged resin (Bio-Rad, USA) in Bio-Scale MT10 12 x 88 mm column (Bio-Rad, USA). A Column containing 2 mL nickel resin was equilibrated with binding buffer (5 mM imidazole). Then the crude clear lysate was loaded into the column and incubated at room temperature for 1h. The column was washed with 5 column volume of wash buffer (10 mM imidazole). Finally the proteins were eluted into elution buffer (250 mM imidazole). The purified proteins were desalted and concentrated using Amicon® Ultra-15 Centrifugal Filters, 30K (Merk Millipore, Ireland) and documented on 12% SDS gel. The total activity, total protein, specific activity, yield and fold purification of affinity purified proteins were calculated.
Effect of Temperature and pH
Temperature optimum for purified optexo14 and optendo13 activities were determined by incubating the purified enzymes at various temperature ranges from 20-80 °C in 100mM sodium- acetate buffer (pH- 5.0) with substrates (Avicel for exo14 and CM-curdlan for endo13) for 1h and for determining thermostability, the enzymes was pre-incubated at 50-80 °C without substrate in 100mM sodium- acetate buffer (pH- 5.0) for 5h.
The optimum pH was determined by conducting enzyme assays in various ranges of pH from 2.0-10.0 at optimum temperature and the activity was calculated. The buffers (0.1M) used were KCl-HCl buffer (pH 2.0), Glycine-HCl buffer (pH 3.0), Sodium-Acetate buffer (pH 4.0-5.0), Citrate buffer (pH 6.0), Citrate-Phosphate Buffer (pH 7.0), Phosphate Buffer (pH 8.0), Tris-HCl Buffer (pH 9.0) and Carbonate-Bicarbonate Buffer (pH10.0).The pH stability of enzymes were estimated by pre-incubating the enzyme solution with buffers at different pH ranges from 2.0-10.0 at optimum temperature for 6 h and the enzyme assays were performed with specific substrates.
Substrate Specificity
The hydrolysing efficiency of purified enzymes on various substrates was determined by performing an enzyme assays containing 100 µg of enzyme with different substrates such as Avicel (0.5%), CM-Curdlan (0.5%), Barley β-glucan (0.5%), salicin (0.5%), carboxy methylcellulose (CMC) (0.5%), birchwood xylan (0.5%) and chitin (0.5%)under optimal conditions for each enzyme.
Effect of Inhibitors and Metal Ions
The influence of metal ions Mg2+, Co2+, Mn2+, Ca2+, Cu2+, Fe2+, Zn2+, Ag+, K+ and Na+ were determined by pre-incubating the purified enzymes with 5mM concentrations of MgSO4, CoCl2, MnCl2, CaCl2, CuSO4, FeSO4, ZnSO4, AgNO3, KI and NaCl respectively. The enzyme activities were determined by standard assay under optimum conditions.
Kinetic Parameters
The kinetic constants such as Km and Vmax of purified enzymes were analysed under optimal assay conditions by incubating the enzyme with 2-100mM concentrations of barley β-glucan as a substrate. The Km and Vmax were determined by the Lineweaver-Burk plot using nonlinear regression analysis of GraphPad Prism version 8.0.
Data Analysis
All experiments were conducted in triplicate and the values were given as mean±SE. Analysis of data and graphical conversions were done by GraphPad Prism version 8.0.
GenBank Submissions and Culture Submissions
The native gene sequences were deposited in the GenBank database under the accession numbers of MG983485 (exo14) and MH719000 (endo13). Codon optimised synthetic gene constructs were deposited in GenBank under the accession numbers of MN175689 (optexo14) and MN200435 (optendo13).
Results
Beta Glucanases Gene Amplification, Cloning and Sequencing
The exo14 and endo13 genes correspondingly from Streptomyces althioticus TBG-MR17 and Streptomyces cinereoruber subsp. cinereoruber TBG-AL13 (Supplementary Fig. S1) were amplified and cloned into pGEMT vector which resulted in pGEMT/exo14 and pGEMT/endo13 constructs. The open reading frames (ORFs) were determined after sequencing, assembling and vector screening. The ORF of exo14 encoded 1737 bp corresponding 578 putative amino acids (Fig. 1a) and endo13 encoded 1293 bp corresponding 430 amino acids (Fig. 1b). Sequence analysis confirms both polypeptide sequence contains a signal peptide sequence, catalytic domain and carbohydrate binding module. The physicochemical properties of predicted proteins were computed using ExPASy ProtParam are shown in Table 1.
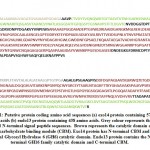 |
Figure 1: Putative protein coding amino acid sequences (a) exo14 protein containing 578 amino acids (b) endo13 protein containing 438 amino acids. |
Table 1: Physicochemical properties of proteins exo14 and endo13
| Parameters | exo14 | endo13 |
| No of amino acid residues | 578 | 430 |
| Molecular weight (Daltons) | 61152.67 | 44360.76 |
| Chemical formula | C2661H4046N742O892S14 | C1918H2956N582O615S11 |
| Theoretical PI | 4.34 | 8.11 |
| +R residues | 38 | 33 |
| -R residues | 76 | 31 |
| Extinction coefficient | 111270-111645 | 79410-79910 |
| Instability index | 24.65 | 29.37 |
| Aliphatic index | 66.26 | 59.35 |
| Estimated half-life in E.coli | >10 hours | >10 hours |
| GRAVY | -0.446 | -0.424 |
Codon Optimization and Gene Synthesis
To increase the Streptomyces exo14 and endo13 gene expression in E. coli, the codons were optimized in silico according to E. coli codon preference without altering amino acid sequences. The optimized and denovo synthesised genes were cloned into pMA-T cloning vectors. The GeneOptimizer® program changed 431 codons out of 578 total codons of exo14 wild sequence (72% of changes), and also changed the codon adaptation index (CAI) from 0.73 (wlexo14) to 0.97 (optexo14). Additionally, overall GC content was decreased from 69 to 49%. Codon optimization of endo13 gene by GeneOptimizer® changed 324 codons out of total wild type 430 codons (75%). The CAI was improved from 0.67 (wlendo13) to 0.98 (optendo13) and GC was reduced from 71 to 53%. Wild and optimized exo14 and endo13 gene sequences with corresponding amino acid sequences are shown in Supplementary Fig. S2 and S3 respectively.
Vector Construction and Overexpression of Beta Glucanases
Champion™ pET101 directional TOPO® Expression System was used for the expression of wild and optimized exo14 and endo13 genes in E. coli. Phusion™ Flash High-Fidelity amplified blunt-end PCR products from pGEM-T and pMA-T constructs were directly cloned to the pET101 expression vector. The schematic representation of recombinant expression constructs architecture is shown in Fig. 2. One Shot® TOP10 E. coli harboured plasmids were purified and the presence of beta glucanase genes was confirmed by restriction analysis. The sequencing confirmed the insertion of genes within the vector was in the correct frame and right orientation with V5-epitope tag and 6x His tags at C-terminal end.
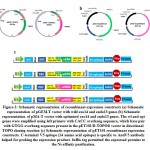 |
Figure 2: Schematic representation of recombinant expression constructs |
The protein expressions were induced in E. coli BL21 StarTM (DE3) strains. Wild and optimized exo14 protein showed expression on 4th h when induced with 1mM IPTG at 37°C, while both wild and optimized endo13 protein displayed expression in 0.5mM IPTG at 27°C on 4th h. The detected proteins in lysate supernatant as soluble fractions indicated that it was transported to periplasmic space using signal sequences. The approximate molecular weight of induced proteins determined from the SDS-PAGE was around 70 kDa for both wild and optimised exo14 proteins (Fig. 3a), which is anomalously higher molecular weight than expected ~61 kDa (after removing signal peptide, but including V5-epitope tag and His-tag). According to Graceffa et al.18 and Alves et al.19 the anomalous slow migration might be due to the great proportion of acidic amino acids. The exo14 protein has high acidic amino acids which were already determined by in silico computation of physico-chemical parameters. (Table 1). The endo13 proteins exhibited around 44 kDa protein (with V5-epitope tag and His-tag), which is almost equal to the theoretical molecular weight determined in silico (Fig. 3a). The intensity of each band was determined by densitometry, using ImageJ software. The relative fold expression levels of optimized proteins were calculated based on the percentage peak area of each intensity plots (Figure 3b). In both cases, the sequence optimization produced substantially elevated levels of expression than the native ones.A Comparison of expression levels of wild and optimized proteins is shown in Table 2. Optexo14 revealed a 13 fold increase in protein expression when compared with a wild genes, whereas optendo13 showed only a 3.75 fold increase in expression when relating with wild genes, which is comparatively less than exo14 protein. The results from initial expression studies were confirmed further by western blot analysis of expressed recombinant proteins using Anti-V5-HRP Antibody (Figure 3c).
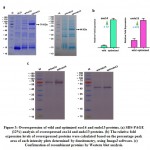 |
Figure 3: Overexpression of wild and optimized exo14 and endo13 proteins. |
Table 2: Comparison of CAI, GC content and expression profile of wild and optimized genes
| Protein | Length | CAI* | GC% | Codon Altered (No) | Codon Altered (%) | Ratio of Expression** | Expression Statistics | ||
| wl | opt | wl | opt | ||||||
| exo14 | 578 | 0.73 | 0.97 | 69 | 49 | 431 | 74 | 1:13 | + |
| endo13 | 430 | 0.67 | 0.98 | 71 | 53 | 324 | 75 | 1:3.75 | + |
* CAI-codon adaptation index- is a measure of the relative adaptiveness values of the used codons that represents the ratio of the frequency of codons used in an expression system and frequency of synonymous codons for the same amino acid. This provides a value of 1 for optimal codon and less frequently used codons are scaled down accordingly. **Ratio of expression calculated by analysing the intensity of each band as the percentage peak area of intensity plots using ImageJ (NIH, USA) gel quantification through densitometry.
Comparison of Enzyme Activity and Protein Quantification
The analysis of recombinant crude enzyme activities of proteins expressed in E. coli BL21 StarTM (DE3) cells showed both the codon-optimised proteins have higher activity in comparison to the native ones. The recombinant exo-β-1,4-glucanase encoded by optexo14 gene showed 16.56 fold increase in the functional activity and 12.96 fold increase in protein concentration than native exo14 protein (Fig. 4a). The endo-β-1,3-glucanase produced by the optendo13 gene gave 6.32 fold increase in activity and 5.19 fold increase in protein concentration (Fig. 4b). While comparing with densitometry experiments, nearly a similar pattern of fold increases were detected in both protein concentrations.
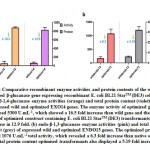 |
Figure 4: Comparative recombinant enzyme activities and protein contents of the wild and optimised β-glucanase gene expressing recombinant E. |
Purification and Functional Assay of Optimised Recombinant Beta Glucanases
The Profinity™ IMAC Nickel charged resin purification and SDS-PAGE analysis of highly expressed optexo14 and optendo13 proteins showed homogenous nature as detectable single bands with corresponding molecular mass of 70 kDa and 44 kDa, respectively. Purification of 100mL of Terrific Broth (TB) culture yielded 42 mg.mL-1 of optexo14 protein with 72.0 U.mg-1 exo-β-1,4-glucanase activity and optendo13 protein yielded 11mg.mL-1 protein with 65.63 U.mg-1 endo-β-1,3-glucanase activity. The yields of the enzymatic activities were 57% for exo-β-1,4-glucanase and 67% for endo-β-1,3-glucanase, considering the total activity in the crude extract as 100%. The details of the purification are summarized in Table 3.
Table 3: Purification of optexo14 and optendo13 proteins
| optexo14 | |||||||
| Step | Volume (mL) | Total Activity (U.mL-1) | Total Protein (mg.mL-1) | Specific Activity (U.mg-1) | Yield (%) | Purification Fold | |
| Crude Extract | 5 | 5300 | 830 | 6.3 | 100 | 1 | |
| Ni2+ Affinity Column | 1 | 3024 | 42 | 72.0 | 57.0 | 11.42 | |
| optendo13 | |||||||
| Crude Extract | 5 | 1076 | 322 | 3.34 | 100 | 1 | |
| Ni2+ Affinity Column | 1 | 722 | 11 | 65.63 | 67.1 | 19.64 | |
Physico-Chemical Properties of Purified Optimized Beta Glucanases
The optexo14 showed the best activity at 50°C, whereas optendo13 showed the best activity at 60°C (Fig. 5a). Optexo 14 showed evident activity at 50°C and 60°C with 25% enzyme activity retaining at 70°C even after 120 min incubation (Fig. 5b). Optendo13 has shown similar retainment of activity at these temperatures and the enzyme activity was retained to 10% even after 240 mins of incubation at 80°C (Fig. 5c). Optexo14 showcased stability and desirable activity at pH 6 and 7 with maximum activity at pH 7.0, while for optendo 13 it was from pH 4 to 8 with maximum activity at pH 6 (Fig 5d, 5e, 5f).
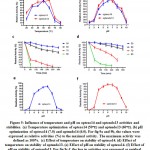 |
Figure 5: Influence of temperature and pH on optexo14 and optendo13 activities and stabilities. |
At optimum temperature and pH optexo14 showed 100% activity towards Avicel, 80% towards barley β-glucan and only 22% to CMC, whereas it showed no activity towards CM-Curdlan, birchwood xylan and chitin. Optendo13 was highly active towards CM-Curdlan and showed 60% activity towards barley β-glucan, but no hydrolysis was observed with CMC, Avicel, birchwood xylan and chitin (Table 4). Both optexo14 and optendo13 activities were highly stimulated by metal ion Mn2. Ca2+ and Mg2+ also showed some positive effect on the optexo14. Zn2+ witnessed high inhibitory activity on optexo14, whereas it increased the activity of optendo13. Common inhibitory metal ions of both enzymes were Fe2+, Cu2+, Co2+ and KI. The inhibitors such as EDTA, DTT, β-mercaptoethanol and SDS had detrimental effects on both optexo14 and optendo13 activities while PMSF and Triton X-100 produced minor positive effects (Table 5). The purified recombinant optexo14 showed a Km value of 7.508 mM and Vmax value of 58.62 µM.min-1.mg-1 and recombinant optendo13 showed Km value of 9.221 mM and Vmax value of 95.51 µM.min-1.mg-1 using the substrate barley β-glucan. Low Km values of both enzymes indicating the high affinity towards the substrate barley β-glucan (Fig. 6).
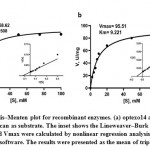 |
Figure 6: Michaelis–Menten plot for recombinant enzymes. (a) optexo14 and (b) optendo13 with barley β-glucan as substrate. |
Table 4: Substrate specificity of optexo14 and optendo13 proteins
| Substrate | Description | Relative Activity (%) | |
| optexo14 | optendo13 | ||
| Avicel | (1,4)- β-glycosidic linkage | 100 ± 3 | 0 |
| Barley β-glucan | (1,4)-and (1,3)- β-glycosidic linkage | 80 ± 5 | 60 ± 5 |
| Carboxy methyl cellulose | (1,4)-β-glycosidic linkage | 22 ± 4 | 0 |
| CM-Curdlan | (1,3)- β-glycosidic linkage | 0 | 100 ± 4 |
| Birch wood xylan | (1,4)- β- xylopyranose linkage | 0 | 0 |
| Chitin | (1,4)- β-glycosidic linkage | 0 | 0 |
The values were expressed as relative activities (%) to the maximal activity. The maximum activity was defined as 100%. The results are presented as mean ± standard deviations (n=3).
Table 5: The effect of metal ions and inhibitors on optexo14 and optendo13 activities
| Metal Ions and Inhibitors | Relative Activity (%) | |
| optexo14 | optendo13 | |
| Control | 100 ± 6 | 100 ± 3 |
| Mg2+ | 108 ± 7 | 80 ± 7 |
| Co2+ | 65 ± 4.4 | 7.8 ± 2.8 |
| Mn2+ | 175 ± 5 | 143 ± 1.8 |
| Ca2+ | 118 ±3.4 | 92 ± 3.4 |
| Cu2+ | 37 ± 2.7 | 40 ± 2.7 |
| Fe2+ | 20 ± 3.5 | 90 ± 3.5 |
| Zn2+ | 11 ± 6.2 | 120 ± 3.2 |
| Ag+ | 103 ± 6 | 125 ± 6 |
| KI+ | 98 ± 1.88 | 82.8 ± 1.9 |
| Na+ | 100 ± 7 | 97 ± 1.32 |
| EDTA | 89 ± 8 | 17 ± 3.4 |
| DTT | 45 ± 7 | 70 ± 6 |
| PMSF | 103 ± 3.5 | 102 ± 3.5 |
| ß-ME | 50 ± 6.2 | 64 ± 5 |
| SDS | 94 ± 5 | 92 ± 5 |
| Triton X-100 | 120 ± 4.3 | 113 ± 4.3 |
The values were expressed as relative activities (%) to the maximal activity. The maximum activity was defined as 100%. The results are presented as mean ± standard deviations (n=3)
Discussion
Recent developments in sequence optimization by frequently used host cell codons combined with de novo synthesis of genes deliver more significant impacts on recombinant protein expression tailored for precise industrial applications. The isolated beta glucanase genes, exo14 and endo13 from Streptomyces althioticus TBG-MR17 and Streptomyces cinereoruber subsp. cinereoruber TBG-AL13, respectively, were codon optimized for efficient expression in E. coli. The GeneOptimizer® expert program used in the present study has a deterministic algorithm implemented as a sliding window approach, which executes the sequences as unidirectional as normally within the cell that starts from 5’ and ends at 3’. GeneOptimizer algorithm considers more than 50 parameters to determine the optimal gene sequence for further consistent and higher level expression without changing the protein sequence.20 To improve the expression of exo14 (exo-β-1,4-glucanase) and endo13 (endo-β-1,3-glucanase) genes isolated from Streptomyces spp., the variances in the relative codon adaptiveness between the expression host E. coli and Streptomyces spp. were considered in detail, then codon usage was adapted according to E. coli codon bias resulting CAI value of 0.97 and also the GC content adjusted to acquire prolonged mRNA half- life and better expression. The elevated GC content of target genes against E. coli codon bias could be the major cause of declined protein expression in E. coli host,21 hence, the GC content of both gene sequences (~70%) was reduced as per to E. coli genome GC content (~50%).
pET101 directional TOPO® Expression vector (5753 bp) was used for this study due to their high success rate in the production of recombinant proteins22,23,24 and also the action of topoisomerase assists the direct integration of blunt end PCR product without ligase.25 The codon optimised synthetic human insulin gene cloned in pET101/D-TOPO vector expressed in E. coli cells produced high yield of pro-insulin protein.26 Habib-ur-Rehman et al.27 reported effective recombinant expression of the pullulanase gene from a hyperthermophilic Archaeon, Pyrobaculum calidifontis, cloned in pET101/D-TOPO vector and expressed in E. coli and proficiently purified using metal affinity chromatography.
As per previous studies, the codon optimised malaria vaccine gene dramatically improved 5-fold protein expression level in E. coli when compared with the native sequence.28 The significant 4.6 fold increase in codon optimised human cystatin expression in E. coli has commercial importance.29 Our finding also correlated to the above studies with optexo14 showing a 13 fold increase after codon optimization. The enzyme activity and protein concentration of codon optimised proteins were higher compared to native counterparts. The improved function of enzymes can be correlated to significantly high production of enzymes having a native folded state, which was achieved via codon optimization approach.30 Previous studies also showcased that sequence optimization of enzyme coding genes gave rise to upgraded catalytic activities compared to native ones in heterologous expression. The codon optimization of α-amylase gene isolated from Bacillus licheniformis exhibited 2.62 fold higher expression in Pichia pastoris.31 The wild-type lipase gene from Candida rugosa produced no lipase activity in heterologous host P. pastoris, while its optimised gene product produced the hydrolytic activity of 4.7 U.mL-1 in P. pastoris.32 The codon optimized genes in this study resulted in higher protein quantity of each enzyme. The sequence optimised genes have positive effects on expression at different levels such as transcription, translation, and mRNA stability, which improves the overall protein yield and activity of recombinant proteins.33 The purified optimised optexo14 and optendo13 protein fractions showed specific activities of 72 U.mg-1 and 65.63 U.mg-1 respectively, which were the highest beta glucanase activities ever reported from Streptomyces spp.
In the industrial scenario fungal beta glucanase enzymes are widely employed and most of the commercially available beta glucanase preparations are from the fungal source, mainly from Aspergillus and very few prepared from bacteria Bacillus amyloliquefaciens.34, 35, 36 The majority of available fungal beta glucanases are highly unstable during higher temperature requirements in the brewing process.37 The bacterial β-glucanases shows activity at an optimal pH, but do not show activity at wide pH intervals.38 When comparing our findings to exo-β-1,4-glucanases from Trichoderma viridi39 and Chaetomium olivaceum40 and endo- β-1,3-glucanases from Trichoderma harzianum41 and Trichoderma koningi42 Streptomyces spp. established an exception that our enzymes optexo14 and optendo13 have significantly high thermostability and pH stability than fungal enzymes and also showed significant activity and stability in wide ranges of pH from 4.0 to 8.0.
Optexo14 showed a high affinity towards cellulolytic substrate Avicel. Studies claim that the high affinity of enzymes towards Avicel confirms it as an exo- acting enzyme, hence Avicel is used as a model substrate for detecting cellobiohydrolase (CBH) activity.43, 44, 45 Optendo13 showed high specificity towards the β-1,3 linked substrate CM-Curdlan, and also showed 60% specificity towards barley β-glucan which confirmed the enzyme is also able to cleave the internal β-1,3-linkages within the barley β-glucan chain, these results define the enzyme as an endo-β-1,3-glucanase.
The metal ions such as Cu2+, Co2+ and Fe2+ showed a significant inhibitory effect on optexo14 and optendo13. Zn2+ produced a high detrimental effect on optexo14 activity. The inhibitory action of Zn2+ and Cu2+ is a general feature of β-glucanases. According to Lim et al.,46 Mn2+ and Cu2+ were reported as fungal β-glucanase inhibitors. However, Mn2+ stimulated the activities of both optexo14 and optendo13 Streptomyces enzymes. The results of kinetic studies of the purified recombinant optexo14 and optendo13 showed Km values of 7.508 and 9.221 mM using the substrate barley β-glucan. The lower Km values designate the higher affinity to β-glucan substrates which proves the beneficial application of both enzymes in industrial sectors such as brewing and animal feed enzyme industries.
Conclusion
Our exploration through the heterologous expression combined with the codon optimisation strategy efficiently improved the expression of Streptomyces spp. β-glucanase genes such as EXO14 (exo-β-1,4-glucanase) and ENDO13 (endo-β-1,3-glucanase) in E. coli and accomplished high protein yield and functional activity with better physio-chemical characteristics. These results suggested that the enzymes individually as well as the cocktail mix will be the better candidates for the applications in the brewing industry as well as animal feed enzyme industry for efficient hydrolysis of cereal β-glucan. Also suggested this strategy can efficiently use in large scale cost-effective production.
Supplementary Information
Additional File: PDF
Acknowledgements
The authors are grateful to Woman Scientist Division (WSD), Kerala State Council for Science, Technology and Environment (KSCSTE), Kerala for financial assistance.
Compliance with Ethical Standards
Not applicable.
Conflict of Interests
All authors declare that they have no competing interests.
References
- Wood P. J., Fulcher R. G., Stone B. A. Studies on the specificity of interaction of cereals cell wall components with congo red and calcofluor: Specific detection and histochemistry of (1→3),(1→4)- β-D-glucan. Journal of Cereal Science. 1993; 1:95-110.
- Havrlentova M., Kraic J. Content of β-D-glucan in cereal grains. Journal of Food and Nutrition Research. 2006; 45(3):97-103.
- Havrlentova M., Petrulakova Z., Burgarova A., Gago F., Hlinkova A., Sturdik E. Cereal β-glucans and their significance for the preparation of functional foods – A Review. Czech Journal of Food Sciences. 2011; 29(1):1-14.
- Fincher G. B., Stone B. A. Cell walls and their components in cereal grain technology. In: Pomaranz Y, editors. Advances in cereal technology. St. Paul: AACC; 1986. Pp 278-295.
- Lee C. J., Horsley R. D., Manthey F. A., Schwarz P. B. Comparisons of β-glucan content of barley and oat. Cereal Chemistry. 1997; 74:571-575.
- Kapur N. K., Ashen D., Blumenthal R. S. High density lipoprotein cholesterol: an evolving target of therapy in the management of cardiovascular disease. Vascular Health and Risk Management. 2008; 4:39-57.
- Cui S. W., Wang Q. Cell wall polysaccharides in cereals: chemical structure and functional properties. Structural Chemistry. 2009; 20:291-297.
- Moon S. H., Lee I., Feng X., Lee H. Y., Kim J., Ahn D. U. Effect of dietary beta-glucan on the performance of broilers and the quality of broiler breast meat. Asian-Australasian Journal of Animal Sciences. 2016; 29(3):384-9.
- Gupta M., Abu‐Ghannam N., Gallaghar E. Barley for brewing: characteristic changes during malting, brewing and applications of its by‐products. Comprehensive Reviews in Food Science and Food Safety. 2010; 9:318-328.
- Jin Y. L., Speers R. A., Paulson A. T., Stewart R. J. Barley beta-glucans and their degradation during malting and brewing. Technical Quarterly, Master Brewers Association of the Americas. 2004; 41:231-240.
- Dake M. S., Jhadav J. P., Patil N. B. Induction and properties of 1,3-β-D-Glucanases from Aureobasidium pullulans. Indian Journalof Biotechnology. 2004; 3:58-64.
- Logeswaran R., Prabagaran S. R. P, Ramesh D. Bacterial Diversity towards Industrially Important Enzyme Producers from Velliangiri Hills, Western Ghats. IOSR Journal of Environmental Science, Toxicology and Food Technology. 2014; 8(5):45-63.
- Nampoothiri K. M., Ramkumar B., Pandey A. Western Ghats of India: Rich source of microbial biodiversity. Appl Biochem Biotechnol. 2013; 167(6):1753-62.
- Marchler-Bauer A. CDD: conserved domains and protein three-dimensional structure. Nucleic Acids Research. 2013; 41:384-52.
- Gasteiger E., Hoogland C., Gattiker A. Protein identification and analysis tools on the ExPASy Server. John M. Walker, editors. The Proteomics Protocols Handbook. Humana Press; 2005. Pp 571-607.
- Bradford M. M. A rapid and sensitive method for the quantitation of microgram quantities of protein utilizing the principle of protein-dye binding. Annals of Biochemistry. 1976; 72:248-254.
- Miller G. L. Use of dinitrosalicylic acid reagent for determination of reducing sugar. Analytical Chemistry. 1959; 31:426-428.
- Graceffa P., Jancso A., Mabuchi K. Modification of acidic residues normalizes sodium dodecyl sulfate-polyacrylamide gel electrophoresis of caldesmon and other proteins that migrate anomalously. Archives of Biochemistry and Biophysics. 1992; 297(1):46-51.
- Alves V. S., Pimenta D. C., Sattlegger E., Castilho B. A. Biophysical characterization of Gir2, a highly acidic protein of Saccharomyces cerevisiae with anomalous electrophoretic behaviour. Biochemical and Biophysical Research Communications. 2004; 314(1):229-234.
- Raab D., Graf M., Notka F., Schoedl T., Wagner R. The GeneOptimizer Algorithm: Using a sliding window approach to cope with the vast sequence space in multiparameter DNA sequence optimization. Systems and Synthetic Biology. 2010; 4(3):215-225.
- Redwan E. L. The optimal gene sequence for optimal protein expression in Escherichia coli: principle requirements. Arab Journal of Biotechnology. 2006; 9:493-510.
- Tokano D. V., Kawaichi M. E., Venancio E. J., Vidotto M. C. Cloning and characterization of the iron uptake gene IutA from avian Escherichia coli. Brazilian Archives of Biology and Technology. 2008; 51(3):473-482.
- Zarif R., Sankian M., Gholubi A., Farshadzadeh Z., Soleimanpour S., Youssefi F., Abdolreza V. Cloning and expression of Mycobacterium tuberculosis major secreted protein antigen 85B (Ag85B) in Escherichia coli. Jundishapur Journal of Microbiology. 2013; 6(2):112-6.
- Kishore V., Nishita K. P., Manonmani H. K. Cloning, expression and characterization of L-asparaginase from Pseudomonas fluorescensfor large scale production in E. coli BL21. Biotechnology. 2015; 5:975e81.
- Shuman S. Novel approach to molecular cloning and polynucleotide synthesis using Vaccinia DNA Topoisomerase. The Journal of Biological Chemistry. 1994; 269(51):32678-32684.
- El-Aziz G. A., Abdel-Aziz S. H., Reda M. M., Baehen M., Baeshen N. A., Redwan E. M. Synthesis of human insulin gene in vitro through computational methodology. Life Science Journal. 2014; 11(1):27-34.
- Habib-ur-Rehman, Siddiqui M. A., Qayyum A., Bano A., Rashid N. Gene expression in Escherichia coli and purification of recombinant type II pullulanase from a hyperthermophilic archaeon, Pyrobaculum calidifontis. Pakistan Journal of Zoology. 2018; 50(4):1381-1386.
- Yadava A., Ockenhouse C. F. Effect of codon optimization on expression levels of a functionally folded malaria vaccine candidate in prokaryotic and eukaryotic expression systems. Infection and Immunity. 2003; 71(9):4961-4969.
- Qing W., Mei C., Zhen H., Zhu J. Codon preference optimization increases prokaryotic cystatin c expression. Journal of Biomedicine and Biotechnology. 2012; 732017:1-7.
- Li Y. M., Li D. J., Xu X. J., Cui M., Zhen H. H., Wang Q. Effect of codon optimization on expression levels of human cystatin C in Pichia pastoris. Genetics and Molecular Research. 2014; 13(3): 4990-5000.
- Wang J. R., Li Y. Y., Liu D. N., Liu J. S., Li P., Chen L. Z., Xu S. D. Codon optimization significantly improves the expression level of α -amylase gene from Bacillus licheniformis in Pichia pastoris. BioMed Research International. 2015: 248680.
- Xu L., Jiang X., Yang J., Liu Y., Yan Y. Cloning of a novel lipase gene, lipJ08, from Candida rugosa and expression in Pichia pastoris by codon optimization. Biotechnology Letters. 2010; 32:269-276.
- Fath S., Bauer A. P., Liss M., Spriestersbach A., Maertens B., Hahn P., Ludwig C., Schafer F., Graf M., Wagner R. Multiparameter RNA and codon optimization: a standardized tool to assess and enhance autologous mammalian gene expression. PLoS ONE. 2011; 6(3):e17596.
- Sahay S. Wine Enzymes: Potential and Practices. In: Kuddus M, editors. Enzymes in Food Biotechnology: Production, Applications, and Future Prospects. 2019: 73-92. doi:10.1016/b978-0-12-813280-7.00006-2.
- Mischnick P., Momcilovic D. Chemical Structure Analysis of Starch and Cellulose Derivatives. Advances in Carbohydrate Chemistry and Biochemistry. 2010; 117–210. doi:10.1016/s0065-2318(10)64004-8.
- Canal-Llauberes R. M. Enzymes and wine quality. Managing Wine Quality. 2010; 93-132. doi:10.1533/9781845699987.1.93
- You S., Tu T., Zhang L., Wang Y., Huang H., Ma R., … Yao B. Improvement of the thermostability and catalytic efficiency of a highly active β-glucanase from Talaromyces leycettanus JCM12802 by optimizing residual charge-charge interactions. Biotechnology for biofuels. 2016; 9:124. doi:10.1186/s13068-016-0544-8.
- Cano-Ramirez C., Santiago-Hernandez A., Rivera-Orduna F. N., Garcia-Huante Y., Zuniga G., Hidalgo-Lara M. E. Expression, purification and characterization of an endoglucanase from Serratia proteamaculans CDBB-1961, isolated from the gut of Dendroctonus adjunctus (Coleoptera: Scolytinae). AMB Express. 2016; 6(1):63.
- Irshad M., Anwar Z., Afroz A. Characterization of exo -1,4-β glucanase produced from Trichoderma Viridi through solid-state bio-processing of orange peel waste. Advances in Bioscience and Biotechnology. 2012; 3:580-584.
- El-Gindy A. A, Saad R. R, Fawzi E. Purification and some properties of exo-1,4-beta-glucanase from Chaetomium olivaceum. Acta Microbiologica Polonica. 2003; 52:35-44.
- Noronha E. F., Ulhoa C. J. Purification and characterization of an endo-β-1,3-glucanase from Trichoderma harzianum. Canadian Journal of Microbiology. 1996; 42(10):1039-1044.
- Monteiro V. N., Ulhoa C. J. Biochemical characterization of a beta-1,3-glucanasefrom Trichoderma koningii induced by cell wall of Rhizoctonia solani. Current Microbiology. 2006; 52(2):92-96.
- Kruus K., Wang W. K., Ching J. T., Wu J. H. D. Exoglucanase activities of the recombinant Clostridium thermocellum CelS, a major cellulosome component. Journal of Bacteriology. 1995; 177:1641-1644.
- Teeri T. T. Crystalline cellulose degradation: new insight into the function of cellobiohydrolases, Trends in Biotechnology. 1997; 15(5):160-167.
- Zhang Y. H. P., Himmel M. E., Mielenz J. R. Outlook for cellulase improvement: Screening and selection strategies. Biotechnology Advances. 2006; 24(5):452-81.
- Lim J., Lee C., Dhakshnamoorthy V., Park J. S., Hong S. Molecular characterization of Streptomyces coelicolor A(3) SCO6548 as a cellulose 1,4-β-cellobiosidase. FEMS Microbiology Letters. 2016; 363:245.

This work is licensed under a Creative Commons Attribution 4.0 International License.


