

Manuscript accepted on : 25-May-2019
Published online on: 27-06-2019
Plagiarism Check: Yes
Reviewed by: Mr Shokri Omar Mustafa Mustafa
Second Review by: Dasari Sreenivas
Final Approval by: Ghulam Md Ashraf
Arti Sharma and Meenu Sharma*
Department of Zoology, University of Jammu, Jammu (180006), Jammu and Kashmir, India.
Corresponding Author E-mail: msmahimasharma77@gmail.com
DOI : http://dx.doi.org/10.13005/bbra/2758

ABSTRACT: The study aim to investigate the zooplankton diversity in relation to physico-chemical parameters of surface water in Barnai pond of Jammu district. Water parameters were analysed by following various standard methods, where as zooplankton were collected through the plankton net of standard bolting silk cloth no. 25 (mesh size 0.003-0.004 μm) and the total number of zooplankton was counted by using Drop count method. Statistical analysis of data involves Pearson’s Correlation analysis and various diversity indices viz; Shannon-Wiener diversity index (H´), Simpson’s Index (D), Margalef’s Index (d´) and Pielou’s Evenness (J). A total of 38 zooplankton taxa along with Nauplius larvae were observed belonging to 5 major taxonomic groups: Protozoa (6 species), Rotifera (21species), Cladocera (6 species), Copepoda (3 species) and Ostracoda (2species). Physico-chemical parameters of Barnai pond revealed well marked fluctuations with maxima and minima values of each parameter during specific seasons and zooplankton analysis revealed seasonal variations with an increase during summer and a fall during winter and monsoon seasons.
KEYWORDS: Correlation; Diversity Indices; Physico-Chemical Parameters; Seasonal Variation; Zooplankton
Download this article as:| Copy the following to cite this article: Sharma A, Sharma M. Zooplankton Diversity in Relation to Physico-Chemical Parameters in Subtropical Pond of Jammu, Jammu and Kashmir, India. Biosci Biotech Res Asia 2019;16(2). |
| Copy the following to cite this URL: Sharma A, Sharma M. Zooplankton Diversity in Relation to Physico-Chemical Parameters in Subtropical Pond of Jammu, Jammu and Kashmir, India. Biosci Biotech Res Asia 2019;16(2). Available from: https://bit.ly/2XxUYkX |
Introduction
Functioning of any aquatic system depends to a great extent on the physico-chemical characteristics of its water (Sharmila and Rajeswari, 2015). The quality of water in any ecosystem provides significant information about the available resources for supporting life in that ecosystem (Pandit and Solanki, 2004 and Thirupathaiah et al., 2012) and it also helps in determining the health of the water body (Shinde et al., 2011). Important physical and chemical parameters influencing the aquatic environment are temperature, rainfall, dissolved oxygen and free carbon dioxide. These parameters are the limiting factors for the survival of aquatic organisms (flora and fauna) as they provide a way to understand the changes in the abundance and distribution of flora and fauna along with time. Among fauna zooplanktons are key component of food web and their qualitative and quantitative studies play an important role in the water quality assessment. They are an important component of secondary production in aquatic system and act as primary consumers and constitute an important link between primary producers (phytoplankton) and higher consumers like carnivore fish in aquatic food chain (Pradhan, 2014). They are known not only to form an integral part of the lentic community but also contribute significantly to the biological productivity of the lentic ecosystem (Wetzel, 2001). They are closely linked with their surrounding environment throughout their life cycles, thereby demonstrating abrupt changes in their populations whenever any disturbance occurs. As a result, any change in their abundance, species diversity, or community composition can provide important indications of environmental change or disturbance. Therefore, they are regarded as a potential bio-indicator species for water pollution (Jakhar, 2013). The Zooplankton community fluctuates according to physico-chemical parameter of the environment, and their density in any water is governed by various water quality parameters such as light penetration, temperature, nutrient enrichment, herbivores and heterotrophic microorganisms (Reynolds, 1987). So, the estimation of plankton analysis also helps in explaining the cause of colour, turbidity, presence of odour, taste and visible particles in water (Pradhan, 2014).
The study of zooplankton has been a interesting subject for a long time. In the last two decades much attention has been paid in tropical countries toward the study of biology, ecology and toxicology of zooplankton because of their importance in various emerging concepts in environmental management like environmental Impact assessment (EIA), bio indication of pollution and biological monitoring. Hence zooplankton association, their abundance, seasonal variation, richness and diversity can be used for the assessment of water pollution. The goal of the present paper is to investigate the zooplankton diversity and their seasonal variations in relation to selected water quality parameters to analyse the status of the studied water body.
Material and Methods
Study Area
Jammu and Kashmir state, the jewelled crown of India with extravagant beauty of Himalayas is located in the extremely northernmost part of Indian sub continent, covering a total geographical area of 2, 22,236 sq. Km. The state shares international border with China and Afghanistan in the north, Tibet in the east and Pakistan in the west, while the states of Punjab and Himachal Pradesh form its southern border. Major parts of J&K state represent high and rugged mountainous terrain. Moreover, the state is divided into three regions, Jammu, Kashmir, and Ladakh. Jammu is the largest city in Jammu division and the winter capital of state of Jammu and Kashmir.
Physiography of Jammu
Jammu, like the rest of north-western India, features a humid subtropical climate with a temperature ranging from extreme summer highs reaching 46oC (115o F), to the extreme winter lows reaching 7oC (45oF). The climatic conditions of Jammu experiences four well defined seasons viz; winter, spring, summer and autumn.
Average yearly precipitation is about 42 inches (1,100mm) with the bulk of the rainfall in the months from June to September, although the winters can also be rather wet. Day length varies from11 hours December to 14 hours in mid-June. Jammu, the southern part of Jammu and Kashmir, lies at the foot hills of Shivalik range at 31o14´29´´N latitude and 77o2´ 12´´ E longitude at an elevation of 327m (1,073ft) above mean sea level.
Barnai Pond
Barnai Pond is a stagnant and perennial water body located at 32o45¢ 50² N latitude and 74o 48¢ 12² E longitude about 10 km away from the Jammu city. The pond is irregularly circular having thick, marshy and sluggish bottom ranging in depth from 14.8 cm during lower water phase to 45 cm during monsoon. It is surrounded by human settlement on one side and temple on other side. Rain water, surface runoff and waste water from the nearby locality are the main sources of water to the pond. During the investigative period, three stations were selected in the pond as
Station I
It was situated near the temple and received anthropogenic as well as domestic waste. This site exhibited luxuriant growth of macrophytes
Station II
This station received domestic waste from the vicinity along with the cattle waste and showed considerable growth of aquatic macrophytes.
Station III
Located exactly opposite to the station I in the shady area. It received huge amount of waste water from the nearby human locality.
Water: Sampling and Analysis
For the analysis of physico-chemical parameters, monthly collection of water samples was done for the period of two years (July, 2013-June, 2015) from the selected study sites of water body. Estimation of selected physico-chemical parameters viz; temperature, depth, transparency and chemical parameters such as pH, dissolved oxygen, free carbon dioxide, carbonates, bicarbonates, chloride, calcium and magnesium was done on the spot while for rest of the chemical parameters such as nitrates, phosphates and sulphates, water samples were collected in the glass bottles and brought to the laboratory for further analysis.
Methodolgy adopted for analysis of water quality parameters as under:
Physical Parameters
Air Temperature
It was recorded with the help of a mercury bulb thermometer while avoiding its direct exposure to the sunlight (Welch, 1952).
Water Temperature
It was recorded with the help of mercury centigrade thermometer graduated upto 110ºC. This was done by dipping the thermometer vertically into the water (Welch, 1952).
Transparency
The transparency of the water was determined by Secchi disc of 20cm in diameter(painted black and white on the upper surface) and determined by the formula:
T= X + Y/2 (Welch, 1952)
Where, T= transparency in cm.
X= depth at which disc becomes invisible.
Y = depth at which disc reappeared while pulling the rope upward.
Depth
A graduated meter rode was used for recording the depth (Adoni, 1985)
Chemical Parameters
pH
pH of the water sample was determined with the help of a portable field pH meter by lowering its bulb directly into the water.
Dissolved Oxygen (DO)
It was determined by sodium azide modification of winkler’s method (APHA, 1985).
Free carbon Dioxide (FCO2)
Titrimetric method was adopted for the estimation of the free carbon dioxide (APHA, 1985)
Carbonate and Bicarbonate
These were estimated following APHA, 1985.
Chloride
Argentometric method was used for the estimation of chloride in which Potassium chromate was used as an indicator (APHA, 1985).
Calcium and Magnesium
The estimation of calcium and Magnesium was done by the EDTA-Titrimetric method as suggested in APHA (1985).
Nitrate
Nitrate was determined by Phenol disulphonic acid method using spectrophotometer (APHA, 1985; Adoni, 1985 and Chopra and Kanwar, 1991).
Phosphate
It was determined by Stannous Chloride method using spectrophotometer (APHA, 1985 and Adoni, 1985).
Sulphate
Turbiditimetric method using spectrophotometer was used to estimate sulphate content of the water samples (APHA, 1985 and Adoni, 1985).
Collection of Zooplankton
Planktonic invertebrates or zooplankton were collected by filtering 50 litres of water sample through the plankton net of standard bolting silk cloth no. 25 (mesh size 0.003-0.004 microns). Finally the volume of zooplankton samples was adjusted to 20 ml and preserved by adding 5% formalin. The preserved zooplankton samples were then brought to the laboratory and analysed both qualitatively and quantitatively. The identification was done using the keys by Ward and Whipple (1959), Pennak (1978) and Adoni (1985).Total number of zooplankton was counted by using Drop count method(Adoni,1985) and calculated using formula:
Organisms /litre = A × 1/L × n/v
where,
A = no. of organisms per drop.
L = vol. of original sample (l).
n = total vol. of concentrated sample (ml).
v = volume of one drop (ml).
Statistical Analysis of Data
Various diversity indices viz; Shannon-Wiener diversity index (H´), Simpson’s Index(D), Margalef’s Index (d´), Pielou’s Evenness (J) were applied to the resultant data in order to analyse the structural community of zooplankton at different study sites of pond. Pearson’s Correlation analysis between abiotic and biotic parameters was also done by using Statistical Package for the Social Sciences software (SPSS Software) (Version -17).
Results and Discussion
During the present investigation, a total of 38 Zooplankton taxa along with Nauplius larvae were observed from Barnai pond belonging to 5 major taxonomic groups: Protozoa (6 species), Rotifera (21species), Cladocera (6 species), Copepoda (3species) and Ostracoda (2 species) (Table 1).
Group Protozoa was taxonomically represented by 4 families viz., Centropyxidae (2 species- Centropyxis aculeata and C.ecornis), Difflugiidae (single species- Difflugia oblonga), Arcellidae (2 species- Arcella dentata and Arcella megastoma) and Paramecidae (single species- Paramecium caudatum)(Table 1).
Rotifera was taxonomically represented by 6 families viz; Brachionidae (15 species- Brachionus calyciflorus, B.quadridentata, B.bidentata, B. fulcatus, B.plicatilis, B.forficula, B.angularis, Platyias patulus, Platyias quadricornis, Keratella tropica, K.cochleralis, Lepadella sp., Mytilina sp., Cephalodella sp. and Colurella sp.), Lecanidae (2 species- Lecane luna and Monostyla sp.), Trichoceridae (single species- Trichocera sulcata), Asplanchnidae (single species- Asplanchna sp.), Testudinellidae (single species-Filinia longiseta), Philodinidae (single species- Philodina sp.)(Table 1).Cladocera was represented by 3 families viz; Daphnidae(single species- Ceriodaphnia sp.), Sididae (single species- Diaphanosoma brachyurum) and Chidoridae (4species – Chydorus sphaericus, Alona monocantha, Alonella sp. and Scapholeberis sp.). The fourth most important group i.e. Copepoda was represented by a single family Cyclopidae (3 species- Cyclops sp., Mesocyclops leukartii and Tropocyclops sp.) along with Nauplius larvae. The fifth group i.e. Ostracoda was represented by only two species Oncocypris pustulosa and Stenocypris sp. (Table 1).
Population Dynamics of Zooplankton
Overall percent contribution of different groups of total zooplankton population inhabiting the Barnai pond during the study period of 2 years revealed the dominance of Rotifera (63.54%) followed by Copepoda (19.43%), Cladocera (13.86%), Protozoa (3.02%) and Ostracoda (0.24%) (Fig. 2). Figures 3-5 reveal the order of dominance of different taxonomic groups at all stations depicted the dominance of rotifera over other zooplankton groups and the main species which contributed maximally to the Rotifera population was Philodina sp. and its abundance may be due to its high growth rate with attainment of maximum size in a very short period of time (Moreira et al., 2016). Apart from this, more availability of food and optimum temperature also favoured the growth of Rotifers (Bottrell et al., 1976). In context to the present findings, George (1966) has also considered a numerical superiority of rotifera over other zooplankton groups, while the observations of Koli and Muley (2012), Jose and Sanal (2012) and Kadam et al. (2014) also recorded similar order of dominance.
Seasonal Variations
Seasonal Variations in Water Quality Parameters
Monthly variations in physico-chemical parameters of Barnai pond revealed well marked fluctuations with maxima and minima during specific seasons. Mean standard deviations of each parameter of all the stations of pond in which air temperature, water temperature, free carbon dioxide, chloride, nitrates, phosphates and sulphates showed summer hike in their values. Their summer maxima might be attributed to the accelerated decomposition of organic matter with rise in temperature and release of excessive nutrients (Chourasia and Adoni, 1985 and Ahwange et al., 2012) and increased respiratory activity of the aquatic organisms at high temperature (Singh et al., 1999; Harney et al., 2013 and Bharama and Korgaonkar, 2015) while Transparency, pH, dissolved oxygen, bicarbonates, calcium, and magnesium reflected winter hike in their values (Table 2). Maxima in dissolved oxygen during winters might be attributed to the decreased rate of decomposition of organic matter at low temperature (Singh, 2004) and low metabolic activity of aquatic organisms (Sharma, 2002). Moreover, accumulation of bicarbonate ions in water, as the rate of their uptake is declined due to reduced photosynthetic activity in winters (Naik et al., 2015) might be responsible for maxima of bicarbonates. Further, increased solubility of calcium and magnesium ions at low temperature (Singh and Gupta, 2010 and Chowdhary, 2011) and run off loaded with calcium and magnesium ions enter directly or indirectly into the pond during winter rains (Kumar, 1990) may be plausible reason for maximum concentration of calcium and magnesium during winters. Other parameter like water depth revealed maximum values during monsoon and it was due to the surface runoff from the catchment area and inflow of rain water (Chowdhary, 2011). However, station wise analysis did not reveal much differences among these parameters but Station-III of the pond depicted slightly high values of depth, free carbon dioxide, bicarbonates, calcium, magnesium, chlorides, nitrates, phosphates and sulphates and low values of transparency, dissolved oxygen (Table 3). As per WHO, the standard value of DO is between 4.0-6.0mg/l(Table-4) which reflected the polluted nature of the Station III as it was a victim of huge waste water inflow and domestic sewage from the human locality. Moreover, Site III was shady as compare to Site I and Site II due to the presence of huge marginal tree (Ficus religiosa) which might restrict the photosynthetic process of aquatic weeds, thereby causing less production of dissolved oxygen and more production of free carbon dioxide in water. However, Carbonates remained absent at all stations throughout the study period.
Seasonal Variations in Zooplankton
The density of zooplankton revealed well marked seasonal variations in Barnai pond, with an increase during summer and a fall during winter and monsoon season. However, during post monsoon season, their abundance (147.03 no. /l) remained moderate (Fig.1). Varied distribution during different seasons seemed to be greatly influenced by different environmental factors like water temperature, presence of nutrients and physico-chemical factors (Ahmed et al., 2011).
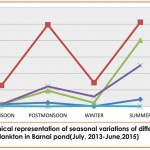 |
Figure 1
|
Maximum abundance(241.19 no./l) of zooplankton faunal assemblage in Barnai pond during the summer season was primarily contributed by Rotifera(102.3no./l), Copepoda(49.79no./l) and Cladocera(80.5 no./l) which may be due to favourable environmental conditions (Dede and Deshmukh, 2015), maximum temperature during summer stimulates the rate of decomposition of organic matter (Mishra et al., 2009), availability of more food due to decomposition of organic matter, less predation pressure(Shivashankar and Venkataramana, 2013), increase in nutrient load (nitrate and phosphate) which cause an increase in phytoplankton productivity(Breitburg et al., 1999) and prolific growth of macrophytes during summer may serve as a better refuge for zooplankton (Bozkurt and Guven, 2009).
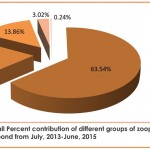 |
Figure 2
|
Similar trend of summer rise in zooplankton abundance has also been put forth by Godhantaraman (2001), El- Sherbiny et al.(2011), Sarma et al., 2011), Pradhan (2014), Dede and Deshmukh (2015), Vasanthkumar et al.(2015) and Golmarvi et al. ( 2017).
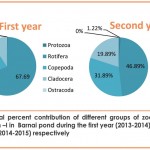 |
Figure 3
|
The moderate abundance (147.03 no./l) of zooplankton fauna observed during post monsoon may be due to high nutrient flow during this season, maximum abundance in food supply in the form of bacteria, suspended detritus and senescenced macrophytes with withered leaves floating on the surface of water may provide more space and shelter to the zooplankton population (Ahmed et al., 2010 and Rathod et al., 2016).
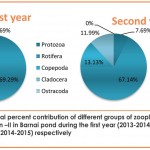 |
Figure 4
|
The characteristic fall in zooplankton population during rainy season i.e. monsoon (July-August) (33.15 no./l) and winter (Jan-feb)( 45.64 no./l) (Fig.1) could be attributed to dilution factors (Rathod et al., 2016) which destabilize the pond ecosystem, thereby affecting the habitat of zooplankton fauna, regular flush out of pond water during rains (Kumar et al., 2011), increased flow of water during rains reduces the detritus, which may disturb the feeding habitat of zooplankton (Sawhney, 2004), high turbidity interferes with the photosynthesis of phytoplankton thus inhibiting their multiplication and ultimately reducing the zooplankton population due to food scarcity (Viroux, 2002 and Kumar et al., 2011).
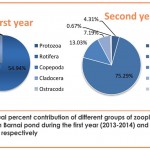 |
Figure 5
|
Similar trend of monsoon decline in zooplankton population has also been put forth by Godhantaraman (2001), Karuthapandi et al. (2013), Sharma (2013), Dede and Deshmukh (2015), Manjare (2015), Vasanthkumar et al.( 2015) and Rathod et al. (2016).
Quantitative abundance of zooplankton population recorded at different stations of the pond revealed maximum abundance(1263no./l at St-I (Ist year-2013 to 2014) and at St-II(2392no./l) (2nd year-2014 to 2015) (Table-5 and fig. 6) which might be due to prolific growth of emergent aquatic macrophytes especially during summer which provide day time refuge against predators, better habitat and better feeding ground to the zooplankton fauna Crowder and Cooper,1982; Walsh, 1995; Jeppesen et al., 1998; Burks et al.,2006 and Cazzanelli et al.,2008), comparatively high DO(Table 3) at both these sites (Kemdirim, 2000) and favourable environmental conditions (Rathod et al. 2016) with special reference to the favourable temperature which may directly be responsible for the abundant growth of phytoplankton on which zooplankton are known to feed (Patil et al., 2002).While Station III recorded the lowest abundance(First year-810 no./l; Second year-1182 no./l) both qualitatively and quantitatively (during both the years of study)(table 5,table 6 and fig. 6 ) which could be attributed to highly polluted nature of this station as reflected by very less DO (Table 3), absence of sunlight and less abundance of phytoplankton .
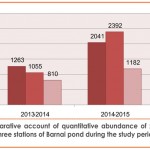 |
Figure 6
|
Correlation coefficient (r) between the zooplankton and physico-chemical parameters exhibited significant positive and negative correlation (Table 7).
Rotifera recorded a positive and significant correlation with air temperature (r= 0.586), water temperature (r=0.555), free carbon dioxide(r=0.612), chloride(r=0.593), nitrates (r=0.449), phosphates (r=0.682), sulphates(r=0.729) while negative and significant correlation with pH(r= -0.573), dissolved oxygen (r= -0.544), bicarbonates (r= -0.572), calcium (r= -0.603) and magnesium (r= -0.451). Tidame and Shinde (2012), Bera et al. (2014) and Sivalingam et al. (2016) also recorded a significant positive correlation of rotifers with temperature and free carbon dioxide.
Copepods recorded a positive and significant correlation with water temperature (r=0.448), free carbon dioxide (r=0.473) and chloride (r=0.458) while negative and significant correlation with pH (r= -0.432) and dissolved oxygen(r=-0.474) (Bera et al., 2014). Positive correlation with water temperature and negative correlation with pH coincides with the investigation of Koli and Muley (2012) in Tulsi Reservoir, Maharashtra.
Cladocerans recorded a negative and significant correlation with pH(r= -0.414), dissolved oxygen(r=-0.428), calcium(r= -0.518) while positive and significant correlation with free carbon dioxide (r=0.476).
Ostracods recorded a positive and significant correlation with dissolve oxygen (r=0.409) and bicarbonate(r=0.447) while negative and significant correlation with air temperature(r=-0.408) and free carbon dioxide(r=-0.430). Significant positive correlation of Ostracods with dissolved oxygen and bicarbonate coincides with the findings of (Sivalingam et al., 2016).
Various diversity indices viz; Shannon-Wiener diversity (H), Margalef’s richness (d), Pielou’s evenness index (J) and Simpson’s dominance index (D) were derived to analyse zooplankton community structure in Barnai pond and the results of statistical analysis revealed marked variability at different stations (Table 8). During the first year (2013-2014), the values of various diversity indices i.e. (H), (d), (J), and (D) were 2.05, 3.36, 0.61 and 0.24 at Station-I; 2.23, 3.59, 0.63 and 0.22 at Station-II and 1.98, 3.13, 0.72 and 0.17 at Station-III respectively. Similarly during the second year (2014-2015), the values of (H), (d), (J), and (D) were 2.27, 3.41, 0.69 and 0.15 at Station-I; 2.11, 3.98, 0.61 and 0.23 at Station-II and 2.01, 2.68, 0.67 and 0.22 at Station-III respectively.
Perusal of the table 8 further depicted high values of Shannon-Wiener index at Station-II (H=2.23) during the first year (2013-2014) and at Station-I (H=2.27) during the second year (2014-2015), thus indicating more species diversity at these study sites. Values of Margalef’s richness index was higher at Station-II (d= 3.59; d= 3.98) during both the years of study indicated quantitative richness, while high values of Pielou’s evenness indicated even distribution of organisms at Station-III (J=0.72) during the first year and at Station-I (J=0.69) during the second year. Values for Simpson’s dominance index close to zero indicate satisfactory diversity status (Hazarika, 2013) and in the present studies, these values were observed to be more satisfactory at Station-III (First year) and at Station-I (Second year).
Table 1: Diversity of Zooplankton in Barnai Pond (July-2013 to June-2015).
| Protozoa |
| Family-Centropyxidae |
| Centropyxis aculeate |
| C.ecornis |
| Family-Difflugidae |
| Difflugia oblonga |
| Family-Arcellidae |
| Arcella dentata |
| Arcella megastoma |
| Family-Paramecidae |
| Paramecium caudatum |
| 6 species |
| Rotifera |
| Family-Brachionidae |
| Brachionus calyciflorus |
| B. quadridentata |
| B.bidentata |
| B. fulcatus |
| B.plicatilis |
| B.forficula |
| B.angularis |
| Platyias patulus |
| Platyias quadricornis |
| Keratella tropica |
| K.cochleralis |
| Lepadella sp |
| Mytilina sp |
| Cephalodella sp |
| Colurella sp |
| Family-Lecanidae |
| Lecane luna |
|
Monostyla sp. |
| Family-Trichoceridae |
| Trichocera sulcata |
| Family-Asplanchnidae |
| Asplanchna sp. |
|
Family-Testudinellidae |
|
Filinia longiseta |
|
Family-Philodinidae |
|
Philodina sp. |
|
21 species |
|
Cladocera |
|
Family-Daphnidae |
|
Ceriodaphnia sp. |
|
Family-Sididae |
|
Diaphanosoma brachyurum |
|
Family-Chidoridae |
|
Chydorus sphaericus |
|
Alona monocantha |
|
Alonella sp. |
|
Scapholeberis sp. |
|
6 species |
|
Copepoda |
|
Family-Cyclopidae |
|
Cyclops sp. |
|
Mesocyclops leukartii |
|
Tropocyclops sp. |
|
3 species |
|
Nauplius larvae |
|
Ostracoda |
|
Oncocypris pustulosa |
|
Stenocypris sp. |
|
2 species |
Table 2: Mean standard deviations in water quality parameters of Pond depicting minima and maxima in different seasons during the study period (2013-2015).
| Water quality parameters | (2013-2014) | (2014-2015) | ||
| Minimum | Maximum | Minimum | Maximum | |
| Air Temp.(°C) | 15.3+0.61(Jan) | 39.7+0.17(June) | 13.1+0.76(Jan) | 40.2+0.76(June) |
| Water Temp. (°C) | 15+0.25(Jan) | 29.3+0.32(June) | 10+0.76(Jan) | 29.8+0.76(June) |
| Water depth(cm) | 16.8+1.79(June) | 38 +7.02(Aug.) | 16+3(June) | 43+4.35(Sept.) |
| Transparency(cm) | 11.5+1(Aug.) | 27.3+3.36(Dec.) | 12+2.64(Aug.) | 27.6+2.51(Dec.) |
| p H | 5.7+0.05(June) | 7.3+0.1(Jan) | 5.6+0.05(June) | 7.2+0.1(Jan) |
| Dissolved Oxygen(mg/l) | 0.5+0.35(June) | 4.2+0.5(Jan.) | 0.7 + 0.2(June) | 4.9 + 0.80(Jan) |
| Free Carbondioxide | 25+ 2(Jan.) | 57 + 3.06(June) | 27+ 1.53(Jan) | 54 + 3.21(June) |
| Bicarbonates(mg/l) | 122.1+2.88(June) | 468.3+10.92(Jan.) | 115.5+ 5.00(June) | 477.3+16.47(Jan) |
| Chloride(mg/l) | 11+2.08(Jan) | 37+ 2(June) | 10+2.08(Dec.) | 37+3.60(June) |
| Calcium(mg/l) | 27.47 + 2.57(June) | 65.91+ 1.69(Jan.) | 28.3+8.00(May) | 65.23+3.04(Dec.) |
| Magnesium(mg/l) | 16.95+0.92(June) | 45.22+2.98(Jan.) | 22.65+2.38(June) | 47.33+1.94(Dec.) |
| Nitrates(mg/l) | 0.117+0.009(Jan) | 0.971+0.04(June) | 0.092+0.01(Jan) | 0.939+0.05(June) |
| Phosphates(mg/l) | 0.043+0.01(Jan) | 0.925+0.09(June) | 0.045+0.01(Jan) | 1.01+0.22(June) |
| Sulphates(mg/l) | 0.005+0.003(Jan) | 0.397+0.16(June) | 0.05+0.04(Jan) | 0.441+0.11(June) |
Table 3: Mean and standard deviations of Physico-chemical parameters at all the three study sites of Barnai Pond from July-2013 to June, 2015.
| (2013-2014) | (2014-2015) | |||||
| St-I | St-II | St-III | St-I | St-II | St-III | |
| Air Temp.(°C) | 27.25±17.32 | 27.9±16.82 | 27.35±17.61 | 26.5±19.09 | 27.5±19.09 | 26±19.09 |
| Water Temp.(°C) | 22.25±10.25 | 22.55±9.97 | 22.1±9.76 | 20±14.14 | 20.75±13.78 | 19.25±13.79 |
| water depth(cm) | 22.9±11.46 | 28.25±15.20 | 31.6±18.95 | 26.5±19.09 | 28.5±17.67 | 33.5±20.51 |
| Transparency(cm) | 21.2±12.31 | 20±12.02 | 17±9.19 | 22.5±10.61 | 19.5±12.02 | 17.5±10.61 |
| p H | 6.6±1.31 | 6.55±1.06 | 6.45±1.06 | 6.5±1.31 | 6.4±1.13 | 6.35±1.06 |
| Dissolved Oxygen(mg/l) | 4.7±2.54 | 4.0±2.48 | 1.85±2.33 | 5.5±3.46 | 4.8±2.96 | 2.35±2.62 |
| Free Carbon dioxide(mg/l) | 38.5±21.92 | 41.5±23.33 | 43.5±23.33 | 38.5±17.68 | 41.5±20.51 | 43±19.79 |
| Carbonates(mg/l) | 0±0 | 0±0 | 0±0 | 0±0 | 0±0 | 0±0 |
| Bicarbonates(mg/l) | 288.05±238.37 | 295.95±246.57 | 301.7±249.61 | 288.05±251.09 | 292.95±250.81 | 308.35±265.66 |
| Chloride(mg/l) | 23±16.97 | 23.5±19.09 | 26.5±17.68 | 21±16.97 | 24±19.79 | 26.5±19.09 |
| Calcium(mg/l) | 44.63±27.43 | 46.67±27.94 | 48.78±26.16 | 42.26±28.19 | 45.21±28.31 | 52.83±21.84 |
| Magnesium(mg/l) | 29.09±18.45 | 31.17±20.15 | 33±21.35 | 32.95±17.77 | 34.76±17.41 | 37.26±17.15 |
| Nitrates(mg/l) | 0.518±0.58 | 0.551±0.62 | 0.564±0.62 | 0.493±0.59 | 0.509±0.579 | 0.546±0.63 |
| Phosphates(mg/l) | 0.426±0.57 | 0.487±0.62 | 0.538±0.68 | 0.428±0.57 | 0.503±0.643 | 0.654±0.84 |
| Sulphates(mg/l) | 0.142±0.19 | 0.166±0.23 | 0.296±0.41 | 0.167±0.22 | 0.252±0.277 | 0.699±0.21 |
Table 4: Drinking water standards
| S.No. | Parameters | Standard Value | Units | Recommended |
| 1. | pH | 6.5-8.5 | – | ICMR/BIS |
| 2. | DO | 4.0-6.0 | mg/l | WHO |
| 3. | Ca | 75 | mg/l | BIS |
| 4. | Mg | 30 | mg/l | BIS |
| 5. | Chloride | 45 | mg/l | ICMR/BIS |
| 6. | Sulphate | 5.99 | mg/l | ICMR |
| 7. | Nitrate | 150 | mg/l | ICMR |
Table 5: Seasonal abundance (no./l))of different groups of Zooplankton at all the three study sites of Barnai from July, 2013-June 201.
| 2013-2014 | STATIONS | July | Aug | Sep. | Oct | Nov. | Dec. | Jan. | Feb. | March | April | May | June | TOTAL | ||||||||||||
| PROTOZOA | I | 0 | 0 | 0 | 0 | 0 | 0 | 0 | 0 | 0 | 0 | 2 | 4 | 6 | ||||||||||||
| II | 0 | 0 | 2 | 6 | 0 | 0 | 0 | 1 | 0 | 10 | 18 | 3 | 40 | |||||||||||||
| III | 0 | 1 | 2 | 0 | 0 | 0 | 0 | 0 | 0 | 0 | 0 | 2 | 5 | |||||||||||||
| ROTIFERA | I | 41 | 20 | 70 | 139 | 21 | 16 | 10 | 10 | 112 | 112 | 153 | 151 | 855 | ||||||||||||
| II | 38 | 29 | 76 | 67 | 37 | 21 | 9 | 44 | 20 | 37 | 193 | 160 | 731 | |||||||||||||
| III | 19 | 16 | 53 | 100 | 12 | 43 | 24 | 3 | 9 | 46 | 14 | 106 | 445 | |||||||||||||
| CLADOCERA | I | 14 | 0 | 0 | 5 | 0 | 0 | 0 | 5 | 9 | 0 | 72 | 10 | 115 | ||||||||||||
| II | 0 | 1 | 0 | 0 | 0 | 0 | 0 | 0 | 2 | 8 | 109 | 0 | 120 | |||||||||||||
| III | 0 | 0 | 2 | 0 | 0 | 0 | 1 | 10 | 23 | 9 | 128 | 18 | 191 | |||||||||||||
| COPEPODA | I | 9 | 0 | 22 | 3 | 0 | 0 | 0 | 14 | 8 | 44 | 93 | 91 | 284 | ||||||||||||
| II | 4 | 5 | 4 | 20 | 2 | 4 | 1 | 11 | 11 | 28 | 39 | 35 | 164 | |||||||||||||
| III | 8 | 8 | 21 | 2 | 0 | 4 | 6 | 0 | 1 | 11 | 44 | 61 | 166 | |||||||||||||
| OSTRACODA | I | 0 | 0 | 0 | 3 | 0 | 0 | 0 | 0 | 0 | 0 | 0 | 0 | 3 | ||||||||||||
| II | 0 | 0 | 0 | 0 | 0 | 0 | 0 | 0 | 0 | 0 | 0 | 0 | 0 | |||||||||||||
| III | 0 | 0 | 0 | 0 | 0 | 0 | 2 | 1 | 0 | 0 | 0 | 0 | 3 | |||||||||||||
| 2014-2015 | ||||||||||||||||||||||||||
| PROTOZOA | I | 0 | 0 | 1 | 9 | 0 | 0 | 1 | 0 | 0 | 5 | 9 | 0 | 25 | ||||||||||||
| II | 0 | 0 | 4 | 29 | 0 | 0 | 0 | 9 | 5 | 119 | 4 | 14 | 184 | |||||||||||||
| III | 0 | 0 | 0 | 9 | 10 | 0 | 2 | 9 | 7 | 0 | 5 | 9 | 51 | |||||||||||||
| ROTIFERA | I | 30 | 66 | 163 | 106 | 69 | 18 | 37 | 8 | 80 | 36 | 189 | 155 | 957 | ||||||||||||
| II | 87 | 26 | 160 | 180 | 80 | 15 | 30 | 52 | 86 | 65 | 407 | 418 | 1606 | |||||||||||||
| III | 12 | 26 | 37 | 227 | 32 | 75 | 30 | 29 | 41 | 25 | 163 | 193 | 890 | |||||||||||||
| CLADOCERA | I | 16 | 2 | 25 | 72 | 11 | 0 | 18 | 5 | 0 | 53 | 154 | 50 | 406 | ||||||||||||
| II | 13 | 6 | 0 | 123 | 0 | 0 | 0 | 1 | 3 | 37 | 104 | 0 | 287 | |||||||||||||
| III | 0 | 8 | 0 | 2 | 0 | 0 | 0 | 5 | 0 | 0 | 70 | 0 | 85 | |||||||||||||
| COPEPODA | I | 26 | 24 | 61 | 71 | 8 | 0 | 5 | 3 | 341 | 12 | 49 | 51 | 651 | ||||||||||||
| II | 26 | 16 | 51 | 13 | 5 | 4 | 24 | 15 | 50 | 5 | 69 | 36 | 314 | |||||||||||||
| III | 21 | 46 | 1 | 26 | 8 | 2 | 11 | 1 | – | 4 | 34 | – | 154 | |||||||||||||
| OSTRACODA | I | 0 | 0 | 0 | 2 | 0 | 0 | 0 | 0 | 0 | 0 | 0 | 0 | 2 | ||||||||||||
| II | 1 | 0 | 0 | 0 | 0 | 0 | 0 | 0 | 0 | 0 | 0 | 0 | 1 | |||||||||||||
| III | 0 | 0 | 0 | 0 | 0 | 0 | 1 | 1 | 0 | 0 | 0 | 0 | 2 | |||||||||||||
Table 6: Distribution of zooplankton fauna along various stations of Barnai pond during the study period (2013-2015).
| Zooplankton species | Station-I | Station-II | Station-III | ||||
| 2013-2014 | 2014-2015 | 2013-2014 | 2014-2015 | 2013-2014 | 2014-2015 | ||
| Protoza | |||||||
| Centropyxis aculeata | + | + | + | + | + | + | |
| C.ecornis | – | + | + | + | – | + | |
| Difflugia oblonga | + | + | + | + | – | + | |
| Arcella dentata | – | + | + | + | – | – | |
| Arcella megastoma | – | – | – | + | + | – | |
| Paramecium caudatum | – | + | + | + | – | + | |
| Rotifera | |||||||
| Brachionus calyciflorus | + | + | + | + | + | + | |
| B.quadridentata | + | + | + | + | + | – | |
| B.bidentata | + | + | – | + | – | + | |
| B.fulcatus | + | + | – | + | + | + | |
| B.plicatilis | + | – | + | + | – | – | |
| B. forficula | – | – | + | – | – | – | |
| B.angularis | – | – | – | + | + | – | |
| Platyias patulus | + | + | + | + | + | + | |
| Platyias quadricornis | + | + | + | + | + | – | |
| Keratella tropica | + | – | – | – | – | – | |
| K. cochlearis | – | – | + | – | – | – | |
| Lepadella sp. | – | + | + | + | – | – | |
| Mytilina sp. | + | – | + | + | – | – | |
| Cephalodella sp. | + | – | + | + | – | – | |
| Colurella sp. | – | + | + | + | – | – | |
| Lecane luna | + | + | + | + | + | + | |
| Monostyla sp. | + | + | – | + | – | + | |
| Trichocera sp. | – | – | – | – | + | + | |
| Asplanchna sp. | + | + | + | + | + | + | |
| Filinia longiseta | + | – | – | – | – | – | |
| Philodina sp. | + | + | + | + | + | + | |
| Cladocera | |||||||
| Ceriodaphnia sp. | + | + | + | + | + | – | |
| Diaphanosoma brachyurum | – | + | + | + | + | + | |
| Chydorus sphaericus | + | – | + | + | + | ||
| Alona sp. | + | + | + | + | + | + | |
| Alonella sp | – | + | – | – | – | – | |
| Scapholeberis sp. | – | + | – | + | + | + | |
| Copepoda | |||||||
| Nauplius larva | + | + | + | + | + | – | |
| Cyclops sp. | + | + | + | + | + | + | |
| Mesocyclops leukartii | + | + | + | + | + | + | |
| Tropocyclops sp | + | + | – | + | + | + | |
| Ostracoda | |||||||
| Oncocypris pustulosa | + | + | – | – | + | + | |
| Stenocypris sp. | – | – | – | + | – | – | |
| Total species | 25 | 27 | 26 | 32 | 22 | 20 | |
Table 7: Correlation coefficient (r) between the zooplankton fauna and various physico-chemical parameters of water of Barnai pond.
| PARAMETERS | PROTOZOA | ROTIFERA | COPEPODA | CLADOCERA | OSTRACODA |
| Air Temp. | 0.198 | 0.586** | 0.367 | 0.396 | -0.408* |
| Water Temp. | 0.210 | 0.555** | 0.448* | 0.364 | -0.295 |
| pH | -0.279 | -0.573** | -0.432* | -0.414* | 0.394 |
| Water depth | -0.225 | -0.213 | -0.189 | -0.247 | 0.60 |
| Transparency | -0.35 | -0.248 | -0.226 | -0.185 | 0.175 |
| Dissolved oxygen | -0.250 | -0.544** | -0.474* | -0.428* | 0.409* |
| Free carbon dioxide | 0.232 | 0.612** | 0.473* | 0.476* | -0.430* |
| Bicarbonate | -0.315 | -0.572** | -0.378 | -0.458* | 0.447* |
| Carbonate | 0 | 0 | 0 | 0 | 0 |
| Calcium | -0.237 | -0.603** | -0.402 | -0.518** | 0.383 |
| Magnesium | -0.009 | -0.451* | -0.276 | -0.271 | 0.345 |
| Chloride | 0.210 | 0.593** | 0.458* | 0.399 | -0.319 |
| Nitrate | 0.095 | 0.449* | 0.226 | 0.237 | -0.200 |
| Phosphate | 0.197 | 0.682** | 0.348 | 0.202 | -0.316 |
| Sulphate | 0.128 | 0.729** | 0.391 | 0.306 | -0.332 |
**Correlation is significant at the 0.01 level (2-tailed)-reflects the confidence level is 99% and the two parameters show very strong correlation with each other
*Correlation is significant at the 0.05 level (2-tailed)- reflects the confidence level is 95% and the two parameters show strong correlation with each other but less than (0.01 level)
Table 8: Diversity indices used of zooplankton community structure at various stations of Barnai pond from July, 2013- June, 2015.
| Index | 2013-2014 | 2014-2015 | ||||
| I | II | III | I | II | III | |
| Margalef’s Richness Index(d) | 3.36 | 3.59 | 3.13 | 3.41 | 3.98 | 2.68 |
| Simpson’s Index(D) | 0.24 | 0.22 | 0.17 | 0.15 | 0.23 | 0.22 |
| Shannon-Wiener Index(H) | 2.05 | 2.23 | 1.98 | 2.27 | 2.11 | 2.01 |
| Evenness Index(J) | 0.61 | 0.63 | 0.72 | 0.69 | 0.61 | 0.67 |
Conclusion
The present study indicated that summer is the most favourable season for the maximum abundance of zooplankton followed by post monsoon, winter and monsoon and their distribution was greatly influenced by different environmental factors and physico-chemical parameters viz; temperature, pH, dissolved oxygen, free carbondioxide, carbonates, bicarbonates, calcium, magnesium, chloride, nitrates, phosphates and sulphates. Moreover, the maximum abundance of Rotifera both qualitatively and quantitatively at all stations indicated the eutrophic status of the studied water body.
Acknowledgments
We are highly thankful to the Head of the Department of Zoology, University of Jammu for providing necessary lab facilities as well as transport facilities to carry out this research work.
References
- Adoni, A.D. Workbook on limnology. Pratibha Publishers, C-10, Gour Nagar Sagar-470003, India: 216, 1985.
- Ahmed, T., Paul, N. and Sharma, A.K. Seasonal variations of zooplankton and phytoplankton density in Gomti river and ponds of Lucknow. , 2010; 11(2): 207-213.
- Ahmed, U., Parveen, S., Khan, A.A., Kabir, H.A., Mola, H.R.A. and Ganai, A.H. Zooplankton population in relation to physicochemical factors of sewage fed Pond of Aligarh (UP), India. Biology and Medicine, 2011; 3: 336-341.
- Ahwange, B.A., Agbaji, E.B. and Gimba, E.C. Impact assessment of human activities and seasonal variation in river Benue, within Makwdi Metropolis. International Journal of Science and Technology, 2012; 2(5): 248- 254.
- APHA Standard methods for the examination of water and waste matter. American Public Health Association, American Water Works Association and Water Pollution Control. Federation, Washington, D.C. 1198 pp, 1985.
- Bera, A., Dutta, T.K., Patra, B.C. and Sar, U.K. Correlation Study on Zooplankton availability and Physico-Chemical Parameters of Kangsabati Reservoir, West Bengal, India. International Research Journal of Environment Sciences, 2014; 3(12): 28-32.
- Bharama, D.L. and Korgaonkar, D.S. Temperature variation and its influence on pH, dissolved oxygen (DO) and free carbon dioxide (CO2) of Nissan pond at Vengurla, Sindhudurg District, (MS). Biolife, (2015); 3(1):243-248.
- Bottrell, H.H., Duncan, A., Gliwicz, Z.M., Herzig, A., Hillbricht-Ilkowska, A., Kurasawa, H., Larsson, P. and Weglenska, T. A review of some problems in zooplankton production studies. J. Zool., 1976; 24: 419-456.
- Bozkurt, A. and Guven, S.E. Zooplankton composition and distribution in vegetated and unvegetated area in three reservoirs in Hatay, Turkey. Animal Veter. Advan., 2009; 8(5): 984-994.
- Breitburg, D.L., Sanders, J.G., Gilmour, C.C., Matfield, C.A., Osman, R.W., Riedel, G.P., Seitzinger, S.P. and Sellner, K.G. Variability in responses to nutrients and trace elements and transmission of stressor effects through an estuarine food web, Oceanogr., 1999;44(3-2):837-863.
- Burks, R.L., Mulderij, G., Gross, E., Jones, I., Jacobsen, L., Van donk, E. and Jeppesen, E. Center stage: the crucial role of macrophytes in regulating trophic interactions in shallow lake wetlands. In: Wetlands: functioning, biodiversity conservation, and restoration. Ecological studies. 191 (R. Bobbink, R. Beltman, J.T.A. Verhoeven & D.F. Whigham, eds), pp. 37–59. Springer-Verlag, Berlin Heidelberg, 2006.
- Cazzanelli, M., Warming, T.P. and Christoffersen, K.S. Emergent and floating – leaved macrophytes as refuge for zooplankton in a eutrophic temperate lake without submerged vegetation. Hydrobiologia, 2008;605(1): 113-122.
- Chopra, S.L. and Kanwar, J.S. Analytical agricultural chemistry. 4th edition, Kalyani Publishers, New Delhi (1991).
- Chourasia, S.K. and Adoni, A.D. Zooplankton dynamics in a shallow Eutrophic lake, Proc.Nat. Symp. Pure Appl. Limnology Bot. Soc., Sagar (MP), India, 1985, 32: 30-39.
- Chowdhary, S. Diversity of macro benthic fauna in some water bodies of Jammu. Ph. D Thesis, University of Jammu, Jammu (2011).
- Crowder, L.B. and Cooper, W.E. Habitat structural complexity and the interaction between bluegills and their prey. Ecology, 1982; 63: 1802-1813.
- Dede, A.N. and Deshmukh, A.L. Study on zooplankton composition and seasonal variation in Bhima river near Ramvadi village, Solapur district (Maharashtra), India. International Journal of Current Microbiology and Applied Sciences, 2015; 4(3):297-306.
- El-Sherbiny, M.M., Al-Aidaroos, A.M. and Gab-Alla, A. Seasonal composition and population density of zooplankton in Lake Timsah, Suez Canal, Egypt. Oceanologia, 2011; 53(3): 837-859.
- George, M.G. Comparative plankton ecology of five fish tanks in Delhi, India. Hydrobiologia, 1966; 27(1-2): 81-108.
- Gerristen, J., Carlson, R.E., Dycus, D.L., Faulkner, C., Gibson, G.R., Harcum, J. and Marcowitz, S.A. Lake and reservoir bioassessment and bacteria. Technical Guidance Document, US Environment, Protection Agency, 1998.
- Godhantaraman, N. Seasonal variations in taxonomic composition, abundance and food web relationship of microzooplankton in estuarine and mangrove waters, Parangi pettai region, southeast coast of India. Indian Journal of Marine Sciences, 2001; 30:151-160.
- Golmarvi, D., Kapourchali, M.F., Moradi, A.M., Fatemi, M., Nadoshan, R.M. Influence of Physico-chemical factors, zooplankton species biodiversity and seasonal abundance in Anzali International Wetland, Iran. Open Journal of Marine Science, 2017; 7, 91-99.
- Harney, N.V., Dhamani, A.A. and Andrew, R.J. Seasonal variations in the physico-chemical parameters of Pindavani Pond of Central India. Weekly Science,2013; 1(6):1-8.
- Hazarika, L.P. Diversity indices of macro invertebrates in the Satajan Wetland of Lakhimpur District, Assam. Annals of Biological Research, 2013; 4 (8):68-72.
- Jakhar, P. Role of phytoplankton and zooplankton as health indicators of aquatic ecosystem: A review. International Journal of Innovation Research Study, 2013; 2 (12):489–500.
- Jeppesen, E., Lauridsen, T.L., Kairesalo, T. and Perrow, M.R. Impact of submerged macrophytes on fish- zooplankton interactions in lakes. In: The structuring role of submerged macrophytes in lakes. E. Jeppesen, M. Sondergaard, K. Christofferson. Ecol. Stud.Ser. 1998; 131: 91-114.
- Jose, R. and Sanal, K.M.G. Seasonal variation in the zooplankton diversity of River Achencovil, J. Sci. Res. Publ., 2012; 2(11):1-5.
- Kadam, C.P., Dandolia, H.S., Kausik, S., Saksena, D.N. and Shrotriy, V.P. Biodiversity of zooplankton in Pillowa reservoir district Morena, Madhya Pradesh, India. Int. J. of Life Sciences, 2014; 2(3): 263-267.
- Karuthapandi, M., Rao, D.V. and Xavier, B. Zooplankton composition and diversity of Umdasagar, Hyderabad. International Journal for Life Sciences and Educational Research., 2013;1(1): 21-26.
- Koli, K.B. and Muley, D.V. Study of zooplanktondiversity and seasonal variation with special reference to physicochemical parameters in Tulshi Reservoir of Kolhapur district (M. S.), India. Sci. Res. Journal, 2012; 4(1), 38– 46.
- Krebs, C.J. Ecology: The Experimental analysis of distribution and abundance. 4th edition, Herper Collins, New York, 705-706,1994.
- Kumar, P., Wanganeo, A., Wanganeo, R. and Sonaullah, F. Seasonal variations in zooplankton diversity of Railway Pond, Sasaram, Bihar. International Journal of Environmental Sciences, 2011; 2(2):1007-1016.
- Kumar, S. Limnology of Kunjwani Pond, Jammu with references to Plankton and macrophytes. M. Phil Dissertation, submitted to University of Jammu, 1990.
- Manjare, S.A. Qualitative and Quantitative study of zooplankton from freshwater tanks of Kolhapur district, (Maharashtra). Research Journal of Life Sciences, Bio informatics, Pharmaceutical and Chemical Sciences, 2015; 1(1): 54-61.
- Mishra A., Mukherjee, A. and Tripathi, B.D. Seasonal and temporal variations in physico chemical and bacteriological characteristics of river Ganga in Varanasi, J. Environ. Res., 2009; 3(3): 395-402.
- Moreira, R.A., Mansano, A.S. and Rocha, O. Life cycle traits of philodina roseola Ehrenberg, 1830 (Rotifera, Bdelloidea), a model organism for bioassays. Acad. Bras.Cienc., 88:1 Rio de Janeiro, 2016.
- Naik, G., Rashid, M. and Balkhi, M.H. Changes in Physico-chemical parameters at different sites of Manasbal Lake of Kashmir, India. Fish Aquatic , 2015; 6:148.
- Pandit, B.P. and Solanki, H.A. Drinking water quality and technology for recharging urban water system for the industrial city of Gujarat, India. Innovation modelling of urban water system. James Willium (Ed), Canada, 2004.
- Patil, N.N., Quadros, G., Somani, V.U., Kurve, P.N. and Athalye, R.P. Study of zooplankton distribution from Ulhas river estuary and Thane creek. In: G. Thane Quadros (Ed.) Proceedings of the National Seminar on Creeks, Estuaries and Mangroves Pollution and Conservation, 28th to 30th November, 2002, Thane, India. p. 109 – 115.
- Pennak, R.W. Freshwater Invertebrates of the United States, 2rd John Wiley and Sons, New York, pp: 810; 1978.
- Pradhan, V.P. Zooplankton diversity in fresh water Wunna lake. J. of Life Sciences, 2014; 2(3): 268-272.
- Rathod, R.P., Chavan, B.R. and Pai, R.K. Zooplankton diversity indices and seasonal variations in Kadwai Reservoir, Ratnagiri District, Maharashtra, India. International Journal of Tropical Agriculture, 2016; 34(3): 785-790.
- Reynolds, C.S. The response of phytoplankton communities to changing lake environment. Schweiz Z Hydrol., 1987; 49:220-236.
- Russell, J., Shiel, A., Justin, F., Costelloe, B.T.,Julian, R.W., Reid, A.C., Peter Hudson, A., Powling, J. Zooplankton diversity and assemblage in Aride zone river of lake Eyre Basin, Australia. Mar. Freshwater Res., 2006; 57: 49 60.
- Sarma, S.S.S., Espinosa, L.R.O., Acosta, C.R.A. and Nandini, S. Seasonal variation in zooplankton abundances in the Iturbide reservoir (Isidro Fabela, State of Mexico, Mexixo). Journal of Environmental Biology, 2011;32:473-480.
- Sawhney, N. Limnology of Ban-Ganga with special reference to some consumers inhabiting the stream. M. Phil. Dissertation, University of Jammu, Jammu, (2004).
- Sharma, R. Biomonitoring of Behlol nullah (a tributary of river Tawi) in Jammu. Ph. D. Thesis, University of Jammu,2013.
- Sharma, S. Sudies on the impact of anthropogenic influences on the ecology of Gharana Wetland, Jammu. Ph.D Thesis, University of Jammu, 2002.
- Sharmila, R. J. and Rajeswari, R. A Study on Physico-Chemical Characteristics of Selected Ground Water Samples of Chennai City, Tamil Nadu. J. Inn. Res. Sci. Eng.Tech., 2015; 4(1): 95-100.
- Shinde, S.E., Pathan, T.S., Raut, K.S. and Sonawane, D.L. Studies on the physico-chemical properties and correlation coefficient of Harsool-Svangi Dam, Aurangabad, India. Middle –East Journal of Scientific Research, 2011; 8(3): 544-554.
- Shivashankar, P. and Venkataramana, G.V. Zooplankton Diversity and their Seasonal Variations of Bhadra Reservoir, Karnataka, India. International Research Journal of Environment Sciences, 2013; 2(5): 87-91.
- Singh, B.K. Biodiversity, conservation and management. Mangal deep Publications, Jaipur, India, (2004).
- Singh, M.R. and Gupta, A. Seasonal variations in certain physico–chemical parameters of Imphal, Irial and Thoubai Rivers from Manipur system, India. Env. Cons., 2010; 16(2): 197-207.
- Singh, H.P., Mahaver, L.R. and Mishra, J.P. Limnological characteristics of River Ghagra in UP. Inland Fish. Soc. India, 1999; 31: 28-32.
- Sivalingam, P., Swamy, M. and Ravinder, R. T. Zooplankton composition correlation with physico chemical parameters bangal lake, Nirmal, Adilabad district Telangana state. Journal of Pharmacy and Pharmaceutical Sciences, 2016; 5(5), 897-904.
- Sunkad BN and Patil HS. Water quality assessment of fort lake of Belgaum (Karnataka) with special reference to zooplankton. Journal of Environmental Biology, 2004; 25: 99-102.
- Thirupathaiah, M., Samatha, C.H. and Sammaiah, C.Analysis of water quality using physico-chemical parameters in lower manair reservoir of Karimnagar district, Andhra Pradesh. International Journal of Environmental Sciences, 2012; 3: 172-180.
- Tidame, S.K. and Shinde, S.S. Report on correlation of zooplankton with physico chemical factors from freshwater temple pond. Journal of Experimental Science, 2012; 3(7): 13-16.
- Vasanthkumar, B., Kapsikar, G.B. and Deshpande, S.P. Diversity of zooplankton in some lentic water bodies of Karwar. J.Life Sciences, 2015; 3(1):43-48.
- Viroux, L. Seasonal and longitudinal aspects of microcrustacean(Cladocera, Copepoda) dynamics in a lowland river. Journal of Plankton Research, 2002; 24(4): 281-292.
- Walsh, E.J. Habitat specific predation susceptibilities of a littoral rotifer to two invertebrate predators. Hydrobiologia, 1995; 313(1):205 -211.
- Ward, H.D. and Whipple, G.C. Freshwater biology. 2nd John wiley and Sons. Inc., New York, 1248; 1959.
- Welch, P.S. Limnology: Mc Graw hill Book Company, New York, Toronto and London (2nd edition), 538, 1952.
- Wetzel RG. Limnology: Lake and River Ecosystems. 3rd Ed. Academic Press, San Diego, 2001.

This work is licensed under a Creative Commons Attribution 4.0 International License.


