

Manuscript accepted on : 7-Mar-2019
Published online on: 26-03-2019
Plagiarism Check: Yes
Rayasam Vijay1 and Kumar Tarika2*
1Department of Biotechnology, REVA University, Rukmini Knowledge Park, Kattigenahalli, Bangalore- 560064, India.
2Parul Institute of Applied Sciences (PIAS), Parul University, Post Limda, Vadodara, Waghodia, Gujarat- 391760, India.
Corresponding Author E-mail: tarika.kumar@gmail.com
DOI : http://dx.doi.org/10.13005/bbra/2733

ABSTRACT: It is a well-known fact that Polyhydroxyalkanoates (PHAs) have the potential to replace petrochemical based plastics. The purpose of our study is to devise a method to reduce substrate cost and produce PHA from our own microbial isolates selected after isolation from polluted environments. A comparative study was done with the reference bacterium Cupriavidus necator. Fourteen bacterial strains were isolated from Polluted Landfills and Effluent Treatment Plant. Four bacterial isolates having the ability to produce PHA were selected. Orange peel and Onion peel were substituted for carbon source in the medium and all the bacterial isolates along with the reference strain were studied for the maximum ability to produce PHA from these wastes respectively. The reference strain Cupriavidus necator yielded 82% PHA in 1:1 C:N ratio utilizing onion peel and 64% in 4:1 C:N ratio utilizing orange peel at 96h of incubation respectively. The best results obtained on onion peels as carbon source were by the isolate Bacillus subtilis JCM 1465 with 89% in 3:1 at 48h of incubation. Maximum PHA production obtained by bacterial isolate Bacillus siamensis PD- A10 using orange peel as carbon source was upto 82% in 1:1 at 24h of incubation.
KEYWORDS: Biodegradable; Bioplastics; Biopolymers; Microbial Polysaccharides; Polyhydroxyalkanoates; Zero Wastage
Download this article as:| Copy the following to cite this article: Vijay R, Tarika K. Microbial Production of Polyhydroxyalkanoates (Phas) Using Kitchen Waste as an Inexpensive Carbon Source. Biosci Biotech Res Asia 2019;16(1). |
| Copy the following to cite this URL: Vijay R, Tarika K. Microbial Production of Polyhydroxyalkanoates (Phas) Using Kitchen Waste as an Inexpensive Carbon Source. Biosci Biotech Res Asia 2019;16(1). Available from: https://bit.ly/2YjMRFv |
Introduction
The petrochemical based plastics find a wide range of applications such as packaging film, containers, household, agricultural, marine, medical surgical pins, sutures and bone replacement but these synthetic polymers are a havoc to the environment as they are non-degradable.1,2 Bio-based plastics has received tremendous attention in recent years because of their high molecular weight, biodegradability, non-toxicity, thermo plasticity, biocompatibility, elastomeric properties and its production from renewable carbon sources. Wide variety of Gram-positive and Gram-negative bacteria and members of family Halobacteriaceae of the Archaea are known to produce Polyhydroxyalkanoate which is a simple macromolecule.3 Polyhydroxyalkanoates are biodegradable polymers that belong to family of bio-polyesters that occur naturally and their physical properties depend upon the type of monomer in the polymer.4 Naturally existing microbes in soil have the ability to degrade PHB by enzymatic action of depolymerase.5 Micro-organisms produce polyhydroxyalkanoates as storage food reserve under unfavorable growth condition such as oxygen, nitrogen or phosphate limitation or in non-optimal pH of the culture medium and excess carbon source. PHAs have the mechanical properties similar to that of the synthetic plastics like polypropylene, polyethylene, etc. with added advantage of getting completely mineralized into carbon dioxide and water by the action of microorganisms. Some of the best-known representatives of PHA family are Polyhydroxybutyrate (PHB), Polyhydroxybutyrate-co-hydroxyvalerate (PHBV).6 At present 140 constituent monomers, are traditionally classified as short chain length (C4 and C5) and medium chain length (C6) hydroxyalkanoates. Depending upon the polymeric composition, the PHAs with different properties yield from a wide variety of monomers.7,8 In many bacteria it is found as a cell inclusion which is accumulated up to 80% of dry cell weight. Though most common type of polymer found in microbial cells are Polyhydroxybutyrate (PHB), Polyhydroxyvalerate (PHV), the composition of these PHAs vary according to the nature of microorganisms, different physiochemical properties such as short, medium or long chain fatty acids or nature of carbon sources provided allowing the formation of new polymers. These polymers can then be made into different plastic materials which have similar properties to that of synthetic plastics.9 Extensive studies have been carried out on production of PHAs to reduce the cost of production by using inexpensive carbon sources or by improving the yield by applying genetic engineering.10 Our approach to reduce the effective cost of PHAs is to utilize the kitchen waste such as onion peels and orange peels as carbon source and reduce the substrate cost to almost nil.
Materials and Methods
Isolation of Bacteria
Collection of Samples
Bacteria were isolated from polluted soil which was collected from polluted land fill site in Kalyan (Maharashtra, India). Ten grams of dry soil was collected using spatula, into sterile container using medical gloves. Soil was digged below the old debris present on the site. Secondly, 100ml water sample was collected in 250ml sterile container, from Effluent Water Treatment Plant in the REVA University Campus, Bangalore (Karnataka, India).
Isolation of Bacteria
One g of polluted soil sample and 1ml of polluted water sample were used for isolating bacteria. Both the samples were serially diluted individually and processed further with spread plate technique. Sterile nutrient agar media at pH 7.0 was used. From three higher dilutions, 0.1ml of both the samples were spread plated onto the sterile nutrient agar plates. The plates were incubated at 37°C for 24h. After incubation, the colonies having different morphologies were selected based on Bergey’s Manual of Systemic Bacteriology. These selected bacterial isolates were maintained on nutrient agar slants for further studies and were sub-cultured time to time to maintain viability.
Screening of PHA Producers
In order to screen the isolates for their ability to produce PHA, Sudan Black B staining method (0.3% in 70% ethanol) was employed.11,12 All the bacterial isolates were inoculated onto sterile nutrient agar media containing 0.5% Peptone, 0.3% Yeast extract 0.5% NaCl, 1.5% Agar and 1% glucose. After overnight incubation, ethanolic Sudan Black B stain was poured onto the colonies and kept undisturbed for 30minutes. Later, the stain was drained off and the media was washed with ethanol to remove the excess stain. The bacterial isolates with the ability to accumulate PHA showed dark blue coloration. Out of 14 isolates, 4 bacterial isolates were found to be positive for PHA accumulation. Same staining procedure was repeated using minimal agar media and concordant results were obtained authenticating those 4 isolates as PHA producers. Composition for minimal agar media is as follows- 1%, Na2HPO4– 6.0g; KH2PO4– 3.0g; NaCl- 0.5g; NH4Cl- 1.0g; (1M) MgSO4– 1ml; (0.1M) CaCl2– 1ml; pH- 7.0 and Distilled water- 1000ml13.
Biochemical Testing
The selected bacterial isolates were subjected to biochemical testing.14,15,16 All the studies performed hereafter were done on those selected four isolates only.
Catalase test, Indole test, Simmon’s Citrate Agar test, Triple Sugar Iron Agar test and Methyl Red Voges Proskauer test were performed as per standard procedures.
Growth Optimization
Effect of different parameters on the growth of bacterial isolates was investigated using nutrient broth. UV visible spectrophotometry was used for determining the turbidity at 600nm.17,18,19
Effect of Incubation Time
The growth pattern of all the selected isolates were studied at 24h, 48h, 72h and 96h intervals keeping rest of the parameters as constant like incubation temperature- 37°C; pH- 7; carbon source- glucose and nitrogen source- yeast extract.
Effect of Incubation Temperature
Variation in incubation temperature was done to study the growth pattern of all the selected PHA producers at 25°C, 35°C, 45°C and 55°C keeping rest of the parameters constant as mentioned above.
Effect of pH
Effect of pH was studied by varying pH at pH 5, 6, 7, 8 and 9 keeping rest of the parameters constant as mentioned above.
Effect of Different Carbon Sources
The growth pattern of all the selected isolates was studied using glucose, lactose, sucrose or maltose as sole source of carbon, keeping rest of the parameters constant as mentioned above.
Effect of Different Nitrogen Sources
The growth pattern of all the selected isolates was studied using ammonium chloride, potassium nitrate; peptone or yeast extract as Nitrogen sources, keeping rest of the parameters constant as mentioned above.
Carbohydrate Estimation of the Raw Materials
The inexpensive raw materials used as a carbon source in our study are onion peels and orange peels. Total carbohydrate estimation of selected raw material was done using Phenol sulphuric acid method.20,21
C:N Ratios
Onion peels and orange peels were used as a substitute for glucose as a carbon source respectively with yeast extract as nitrogen supplement. Amount of PHA production was calculated using different ratios of C:N (1:1, 2:1, 3:1 and 4:1) at different incubation periods (24h, 48h, 72h and 96h).13
Preparation of Media for Obtaining the Dry Cellular Weight (DCW) and PHA Production
Nutrient broth was prepared containing all the components except the carbon source. The raw material (either onion peel or orange peel as per ratio) was added with yeast extract as the nitrogen source. The reference bacterium Cupriavidus necator was procured from MTCC Chandigarh, India. The isolate was provided with same parameters as our own isolates. Hundred ml of media was prepared for each ratio with the desired pH for particular bacterial isolate and autoclaved. Inoculum was prepared and actively growing bacterial cells were transferred to the corresponding flask and incubated for 4days. The amount of biomass obtained, PHA production and PHA accumulation were studied after sample withdrawal at the interval of every 24hrs till 96hrs. The first step involved centrifugation of culture media to obtain the biomass as a precipitate. This biomass was dried completely and weighed to obtain the amount of cell growth in grams/L.
Extraction of PHA
Extraction of PHA was performed using chloroform extraction method. The bacterial cells were centrifuged at 5000 (rpm) for 10mins to obtain the pellet which was dried to obtain the Dry Cell Weight (g/L). Later the pellet was suspended in 4% sodium hypochlorite solution and incubated at 37°C for 2hrs for complete digestion of cell components except PHA. The mixture was centrifuged to collect PHA granules and supernatant was discarded. Mixture was washed twice with 10ml distilled water and centrifuged. Granules in the sediment were washed twice with acetone, methanol, diethyl ether (1:1:1) respectively. Further, the polymer granules were dissolved in boiling chloroform and was evaporated by air drying, to yield dry powder of PHA which was then weighed to obtain the amount of extracted PHA (g/L).22,23,24,25,26,27
Quantification of PHA
Quantification of the percentage PHA accumulation was calculated by applying the following formula.28,29
Residual Biomass (g/L) = Dry Cell weight (g/L) – Dry weight of extracted PHA (g/L).
PCR Amplification and 16s rRNA Gene Sequence Details
Genomic DNA was isolated from the culture using Norgen DNA isolation kit. Using the consensus primers, ~1.5kb; 16s rRNA gene was amplified using Taq DNA Polymerase. PCR was performed in 50µl of reaction volume, containing ~155ng of template DNA, 1X of 10X assay buffer 5A, 100ng of universal forward and reverse primers each, 1.0µl of dNTPs mixture (2.5mM each) and 3U of XT-5 Polymerase. PCR conditions consisted of denaturation at 94°C for 30sec, primer annealing at 56°C for 30sec and primer extension at 72°C for 1.30sec. PCR was carried out for 35cycles which also included initial denaturation at 94°C for 5mins and a final elongation at 72°C for 10mins.30 The PCR products were loaded onto 1.0% agarose gel along with StepUpTM 1kb DNA ladder. The sequence of the DNA was compared with that of the existing sequences in NCBI database using the Blast N program. The best found matches for all the bacterial isolates are given in the table. A high score and low expect value indicate greatest homology.
Results
Selection and Screening of Bacteria
Out of the 14 different bacterial isolates, 4 isolates showed the ability to produce PHA using Sudan Black B staining procedure on nutrient agar and also on minimal agar media.
Biochemical Testing
All the bacterial isolates were positive for Catalase enzyme and Simmon’s Citrate test and negative for Indole test, Methyl Red and Voges-Proskauer test. In Triple Sugar Iron test, Bacillus subtilis JCM 1465, Bacillus siamensis PD- A10 and Geobacillus stearothermophillus R-35646 fermented glucose in the media and only Bacillus subtilis JCM 1465 produced H2S which precipitated in the form of black deposits. No crack or fracture was observed in any of the above bacteria. Staphylococcus aureus JH1 showed utilized both the sugars glucose and lactose in the media. The cracks in the agar indicated hydrogen production and the black precipitate was also observed.
Growth Optimization
Different temperature, pH, carbon, nitrogen sources and times of incubation (as mentioned in the materials and methods) were provided to all the bacterial isolates before deciding the optimum growth conditions. It was observed that Bacillus subtilis JCM 1465 grows best at 96hours, 25°C and pH 8. Bacillus siamensis PD- A10 grew best at 72hours, 35°C and pH 7 where as Staphylococcus aureus JH1 showed optimum growth at 48hour, 35°C and pH 8. Optimum growth for Geobacillus stearothermophillus R-35646 was obtained at 48hour, 25°C and pH 9. For all the isolates yeast extract was found to be the optimum nitrogen source and glucose was the best carbon source for all the isolates except Staphylococcus aureus JH1 which grew better in sucrose.
Carbohydrate Estimation of the Raw Materials
The Total Carbon Content of the onion peels and orange peels were analyzed in order to determine carbon content to be provided to the bacterial isolates as per C:N ratio. It was found that the total carbohydrate content in Onion peel and Orange peel was 9.5% and 20% respectively.
Biomass and PHA Production Obtained Using Both the Raw Materials Carbon Source
All the bacterial cultures were grown in media containing the peels and nitrogen source in respective ratios to estimate biomass and PHA production. Significant results are mentioned hereafter. With onion peel-based media (2:1 C:N ratio at 24h of incubation), Bacillus subtilis JCM 1465 produced 12.69g/L of biomass out of which 9.06g/L was converted to PHA (Table 1) and in orange peel-based media the bacterium produced 15.96g/L and 1.4g/L of biomass and PHA respectively in 4:1 C:N ratio at 48h of incubation (Table 2). Bacillus siamensis PD- A10, in onion peel-based media resulted in huge amount of biomass of 90.86g/L out of which 67.56g/L was converted into PHA in 3:1 C:N ratio at 48h of incubation (Table 3). Same bacterium yielded 9.86g/L biomass out of which only 0.79g/L was converted to PHA in orange peel-based media (3:1 C:N ratio at 48h of incubation) (Table 4). With onion peel-based media, Staphylococcus aureus JH1 produced 42.63g/L of biomass and 5.09g/L of PHA in 4:1 C:N ratio at 96h of incubation (Table 5) and the same isolate on orange peel-based media produced 16.79g/L and 3.39g/L of biomass and PHA respectively in 3:1 C:N ratio at 72h of incubation (Table 6). Geobacillus stearothermophillus R-35646, on onion peel-based media resulted 19.20g/L of biomass and 1.63g/L of PHA production in 3:1 C:N ratio at 24h of incubation (Table 7) and on orange peel-based media it could yield 25.56g/L and 10.6g/L of biomass and PHA production respectively [2:1 C:N ratio at 96h of incubation (Table 8)]. The reference bacterium, Cupriavidus necator resulted 11.93g/L and 1.96g/L of biomass and PHA production respectively in 4:1 C:N ratio at 48h of incubation in onion peel-based media (Table 9) and on orange peel-based media it produced 7.29g/L and 0.86g/L of biomass and PHA respectively in 2:1 C:N ratio at 72h of incubation (Table 10).
Table 1: PHA accumulation by Bacillus subtilis JCM 1465 using Onion peel (Values are based on two sets of experiments. SD was less than 5%).
| Hours of incubation | Dry cellular weight (g/L) | PHA production (g/L) | PHA accumulation (%) | Onion peel | ||||||||
| 0.042361 | 0.084028 | 0.125694 | 0.167361 | 0.042361 | 0.084028 | 0.125694 | 0.167361 | 0.042361 | 0.084028 | 0.125694 | 0.167361 | |
| 24 | 4.66 | 12.69 | 5.33 | 5.89 | 1.46 | 9.06 | 2.16 | 3.23 | 31 | 71 | 41 | 55 |
| 48 | 1.26 | 2.63 | 3.33 | 3.1 | 0.79 | 1.13 | 2.93 | 1.63 | 64 | 43 | 89 | 53 |
| 72 | 6.39 | 8.96 | 10.79 | 7.99 | 1.53 | 7.43 | 8.99 | 6.7 | 23 | 83 | 85 | 84 |
| 96 | 7.19 | 9.29 | 4.83 | 5.69 | 5.53 | 6.6 | 3.66 | 3.36 | 75 | 71 | 76 | 59 |
Table 2: PHA accumulation by Bacillus subtilis JCM 1465 using Orange peel (Values are based on two sets of experiments. SD was less than 5%).
| Hours of incubation | Dry cellular weight (g/L) | PHA production (g/L) | PHA accumulation (%) | Orange peel | ||||||||
| 1:01 | 2:01 | 3:01 | 4:01 | 1:01 | 2:01 | 3:01 | 4:01 | 1:01 | 2:01 | 3:01 | 4:01 | |
| 24 | 8.89 | 12.86 | 11.73 | 13.09 | 0.63 | 0.46 | 0.43 | 0.43 | 7 | 4 | 13 | 8 |
| 48 | 8.29 | 14.76 | 12.96 | 15.96 | 0.46 | 0.83 | 1.16 | 1.4 | 7 | 5 | 15 | 8 |
| 72 | 7.23 | 10.86 | 10.16 | 13.23 | 0.46 | 1.76 | 3.6 | 2.09 | 6 | 16 | 29 | 14 |
| 96 | 0.99 | 1.29 | 2.62 | 3.46 | 0.73 | 0.86 | 1.09 | 0.99 | 75 | 68 | 43 | 33 |
Extraction and Quantification of PHA
Before the extraction procedure, each bacterial isolate was provided the optimized growth conditions along with the two types of peels as carbon source. The PHA production in different C:N ratios was analyzed for 4 days with intermittent withdrawal of the sample at 24hrs interval. The Dry cell weight obtained and the PHA so produced were used to quantify the percentage of PHA accumulation by each isolate.
The best results obtained on onion peel-based media are as follows: Bacillus subtilis JCM 1465 could produce 89% of PHA at 48h of incubation in 3:1 C:N ratio (Table 1). Bacillus siamensis PD- A10 accumulated 78% of PHA at 48h of incubation in C:N ratio of 4:1 (Table 3). Staphylococcus aureus JH1 could accumulate PHA up to 83% which is also the highest among all the other bacterial isolates at 96h of incubation in C:N ratio of 1:1 (Table 5). Geobacillus stearothermophillus R-35646 registered the least amount of PHA accumulation of 54% at 96h of incubation in 4:1 C:N ratio (Table 7).
Table 3: PHA accumulation by Bacillus siamensis PD- A10 using Onion peel (Values are based on two sets of experiments. SD was less than 5%).
| Hours of incubation | Dry cellular weight (g/L) | PHA production (g/L) | PHA accumulation (%) | Onion peel | ||||||||
| 1:01 | 2:01 | 3:01 | 4:01 | 1:01 | 2:01 | 3:01 | 4:01 | 1:01 | 2:01 | 3:01 | 4:01 | |
| 24 | 6.66 | 7.66 | 8.39 | 5.46 | 4.23 | 1.63 | 2.43 | 1.73 | 63 | 21 | 29 | 31 |
| 48 | 3.5 | 6.03 | 90.86 | 5.59 | 1.03 | 1.79 | 67.56 | 4.36 | 28 | 29 | 75 | 78 |
| 72 | 3.5 | 7.33 | 10.86 | 10.73 | 1 | 2.69 | 5.29 | 1.89 | 28 | 37 | 49 | 18 |
| 96 | 8.99 | 4.33 | 3.76 | 8.59 | 5.06 | 3.29 | 2.29 | 5.39 | 56 | 75 | 61 | 63 |
Table 4: PHA accumulation by Bacillus siamensis PD- A10 using Orange peel (Values are based on two sets of experiments. SD was less than 5%).
| Hours of incubation | Dry cellular weight (g/L) | PHA production (g/L) | PHA accumulation (%) | Orange peel | ||||||||
| 1:01 | 2:01 | 3:01 | 4:01 | 1:01 | 2:01 | 3:01 | 4:01 | 1:01 | 2:01 | 3:01 | 4:01 | |
| 24 | 2.66 | 2.49 | 3.49 | 1.96 | 2.16 | 1.33 | 1.53 | 0.43 | 82 | 54 | 44 | 22 |
| 48 | 4.4 | 6.09 | 9.86 | 4.19 | 0.3 | 0.16 | 0.79 | 0.39 | 7 | 3 | 8 | 10 |
| 72 | 2.76 | 3.59 | 7.46 | 6.53 | 0.13 | 0.33 | 0.29 | 0.39 | 5 | 9 | 4 | 6 |
| 96 | 5.46 | 8.13 | 7.26 | 7.43 | 1.43 | 1.16 | 1.1 | 3.03 | 26 | 14 | 15 | 41 |
Table 5: PHA accumulation by Staphylococcus aureus JH-1 using Onion peel (Values are based on two sets of experiments. SD was less than 5%).
| Hours of incubation | Dry cellular weight (g/L) | PHA production (g/L) | PHA accumulation (%) | Onion peel | ||||||||
| 1:01 | 2:01 | 3:01 | 4:01 | 1:01 | 2:01 | 3:01 | 4:01 | 1:01 | 2:01 | 3:01 | 4:01 | |
| 24 | 7.63 | 10.43 | 21.23 | 36.66 | 2.36 | 1.3 | 2.53 | 2.8 | 31 | 12 | 12 | 7 |
| 48 | 4.53 | 6.06 | 14.86 | 27.29 | 1.8 | 1.43 | 2.66 | 4.49 | 49 | 24 | 18 | 17 |
| 72 | 5.66 | 10.83 | 21.86 | 41.29 | 1.23 | 1.33 | 2.06 | 6.23 | 21 | 13 | 10 | 15 |
| 96 | 1.56 | 8.03 | 16.09 | 42.63 | 1.29 | 2.53 | 2.4 | 5.09 | 83 | 31 | 15 | 12 |
The best results obtained on orange peel-based media can be summarized as follows: Bacillus subtilis JCM 1465 could produce 75% of PHA in 1:1 C:N ratio at 96h of incubation (Table 2). Bacillus siamensis PD- A10 accumulated 82% of PHA in 1:1 C:N ratio at 24h of incubation (Table 4). Staphylococcus aureus JH1 registered the least amount of PHA accumulation of about 38% at 3:1 C:N ratio at 96h of incubation (Table 6). Geobacillus stearothermophillus R-35646 resulted in 62% of PHA in 1:1 C:N ratio at 24h of incubation (Table 8).
Table 6: PHA accumulation by Staphylococcus aureus JH- 1 using Orange peel (Values are based on two sets of experiments. SD was less than 5%).
| Hours of incubation | Dry cellular weight (g/L) | PHA production (g/L) | PHA accumulation (%) | Orange peel | ||||||||
| 1:01 | 2:01 | 3:01 | 4:01 | 1:01 | 2:01 | 3:01 | 4:01 | 1:01 | 2:01 | 3:01 | 4:01 | |
| 24 | 7.03 | 8.16 | 7.29 | 2.93 | 0.69 | 0.53 | 0.79 | 0.49 | 10 | 7 | 11 | 16 |
| 48 | 9.39 | 10.33 | 14.09 | 9.76 | 0.09 | 0.49 | 0.23 | 0.4 | 1 | 4 | 2 | 4 |
| 72 | 9.1 | 8.23 | 16.79 | 8.13 | 0.53 | 0.53 | 3.39 | 0.79 | 6 | 6 | 23 | 10 |
| 96 | 10 | 6.76 | 16.56 | 12.43 | 2.06 | 1.09 | 6.36 | 1.93 | 21 | 16 | 38 | 15 |
Table 7: PHA accumulation by Geobacillus stearothermophillus R-35646 using Onion peel (Values are based on two sets of experiments. SD was less than 5%).
| Hours of incubation | Dry cellular weight (g/L) | PHA production (g/L) | PHA accumulation (%) | Onion peel | ||||||||
| 1:01 | 2:01 | 3:01 | 4:01 | 1:01 | 2:01 | 3:01 | 4:01 | 1:01 | 2:01 | 3:01 | 4:01 | |
| 24 | 8.69 | 11.93 | 19.2 | 8.26 | 1.19 | 2.23 | 1.63 | 2.16 | 14 | 19 | 9 | 26 |
| 48 | 6.99 | 10.13 | 17.69 | 6.66 | 0.99 | 2.3 | 4.73 | 2.53 | 14 | 22 | 27 | 38 |
| 72 | 5.96 | 9.33 | 11.09 | 6.03 | 0.96 | 1.69 | 1.43 | 1.66 | 16 | 18 | 13 | 27 |
| 96 | 2.39 | 6.66 | 3.29 | 2.56 | 0.73 | 3.53 | 1.46 | 1.36 | 31 | 53 | 44 | 54 |
Table 8: PHA accumulation by Geobacillus stearothermophillus R-35646 using Orange peel (Values are based on two sets of experiments. SD was less than 5%).
| Hours of incubation | Dry cellular weight (g/L) | PHA production (g/L) | PHA accumulation (%) | Orange peel | ||||||||
| 1:01 | 2:01 | 3:01 | 4:01 | 1:01 | 2:01 | 3:01 | 4:01 | 1:01 | 2:01 | 3:01 | 4:01 | |
| 24 | 9.29 | 14.56 | 14.96 | 14.26 | 3.53 | 2.4 | 1.29 | 1 | 62 | 14 | 8 | 7 |
| 48 | 7.46 | 14.53 | 11.76 | 15.33 | 0.36 | 1.06 | 0.66 | 1.86 | 30 | 9 | 6 | 12 |
| 72 | 5.73 | 11.36 | 9.09 | 9.26 | 1.13 | 2.13 | 2.46 | 2.93 | 31 | 22 | 32 | 30 |
| 96 | 15.5 | 25.56 | 21.33 | 23.99 | 2.69 | 10.6 | 8.39 | 4.83 | 17 | 42 | 39 | 20 |
Extraction and Quantification of PHA by Cupriavidus Necator
For Cupriavidus necator, maximum accumulation of PHA (82%) was observed at 96 h in C:N ratio of 1:1 using onion peel-based media (Table 9) and 64% PHA on orange peel-based media was observed in 4:1 C:N ratio at 96h of incubation (Table 10).
Table 9: PHA accumulation by Cupriavidus necator using Onion peel (Values are based on two sets of experiments. SD was less than 5%).
| Hours of incubation | Dry cellular weight (g/L) | PHA production (g/L) | PHA accumulation (%) | Onion peel | ||||||||
| 1:01 | 2:01 | 3:01 | 4:01 | 1:01 | 2:01 | 3:01 | 4:01 | 1:01 | 2:01 | 3:01 | 4:01 | |
| 24 | 2.26 | 5.06 | 4.36 | 6.13 | 1.46 | 1.09 | 1.46 | 1.66 | 66 | 21 | 34 | 27 |
| 48 | 5.49 | 10.13 | 10.13 | 11.93 | 1.23 | 1.86 | 1.76 | 1.96 | 22 | 18 | 18 | 16 |
| 72 | 1.53 | 1.99 | 2.83 | 3.36 | 0.63 | 1.16 | 1.13 | 1.39 | 40 | 58 | 39 | 41 |
| 96 | 1.76 | 3.89 | 3.19 | 5.36 | 1.43 | 2.83 | 2.29 | 3.26 | 82 | 72 | 72 | 61 |
Table 10: PHA accumulation by Cupriavidus necator using Orange peel (Values are based on two sets of experiments. SD was less than 5%.
| Hours of incubation | Dry cellular weight (g/L) | PHA production (g/L) | PHA accumulation (%) | Orange peel | ||||||||
| 1:01 | 2:01 | 3:01 | 4:01 | 1:01 | 2:01 | 3:01 | 4:01 | 1:01 | 2:01 | 3:01 | 4:01 | |
| 24 | 1.86 | 2.03 | 3.7 | 1.49 | 0.5 | 0.83 | 1.66 | 0.79 | 27 | 41 | 45 | 52 |
| 48 | 2.56 | 5.09 | 2.86 | 2.03 | 0.76 | 0.79 | 0.99 | 0.86 | 29 | 16 | 34 | 42 |
| 72 | 2.59 | 7.29 | 4.53 | 5.53 | 0.73 | 0.86 | 0.99 | 0.93 | 28 | 12 | 22 | 17 |
| 96 | 2.53 | 1.39 | 1.59 | 1.63 | 0.93 | 0.86 | 0.93 | 1.03 | 36 | 61 | 60 | 64 |
The comparison of the best results obtained by the selected bacterial isolates and that of the reference bacterium using the two waste peels is mentioned below (Figure 1).
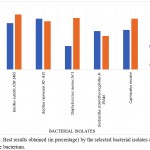 |
Figure 1: Best results obtained (in percentage) by the selected bacterial isolates and the reference bacterium.
|
16s rRNA Details
Bacterial Isolate 1: Bacillus subtilis JCM 1465 (1799bp) with the GenBank Accession Number NR_113265.1 was found having 99% of homology to Bacillus subtilis strain NBRC 13719 (GenBank Accession Number: NR_112629.1) and Bacillus subtilis subsp. spizizenii strain NBRC 101239 (GenBank Accession Number: NR_112686.1).
Bacterial Isolate 2: Bacillus siamensis PD- A10 (1525bp) with the GenBank Accession Number NR_117274.1 was found having 99% of homology to Bacillus Amyloliquefaciens subsp. plantarum strain FZB42 (GenBank Accession Number: NR_075005.1) and Bacillus subtilis strain 168 (GenBank Accession Number: NR_102783.1).
Bacterial Isolate 3: Staphylococcus aureus JH1 (2277bp) with the GenBank Accession Number NR_074925.1 was found having 96% of homology to Staphylococcus aureus strain NBRC 100910 (GenBank Accession Number: NR_113956.1) and Staphylococcus aureus subsp. aureus N315 strain (GenBank Accession Number: NR_075000.1).
Bacterial Isolate 4: Geobacillus stearothermophillus R-35646 (1978bp) with the GenBank Accession Number NR_116987.1 was found having 98% of homology to Geobacillus stearothermophillus strain NBRC 12550 (GenBank Accession Number: NR_112640.1) and Geobacillus stearothermophillus strain BGSC 9A20 (GenBank Accession Number: NR_115284.1).
Discussion
Polyhydroxyalkanoates are known to be produced by many gram-positive, gram-negative bacteria31,32 and Archaea when these microorganisms are subjected to environmentally stressful conditions like limited nutrients.33 In one of the studies, with Corn oil and waste vegetable oil as substrate, bacteria were found to accumulate 37% (w/w) and 23% (w/w) of PHA respectively.34 In earlier research reported, starch was used as the carbon source, Bacillus thuringiensis accumulated up to 72.05%.35,36 In similar studies on different Bacillus strains, the highest amount of PHA accumulation with glucose as carbon source was reported to be 66% by Bacillus cereus EGU3.37 Another finding claimed that addition of 6% molasses to the media triggered the accumulation of PHA in Bacillus subtilis from 54% to 62%. Supplementation with 1% ethanol and ammonium sulphate and ammonium nitrate as nitrogen sources was done which resulted in an overall expensive final product.9 In one of the studies on Ralstonia eutropha, maximum recovery of PHA obtained was 91% on large scale (50L) with carbon source as sodium gluconate and sodium hypochlorite method as extraction procedure.38 In another study it was reported that Bacillus sps.256 yielded copolymers of P (HB-co-HV) with higher HB content when malic acid was used as a carbon source. Fermentation strategies resulted 54% and 2.7g/L of PHA content and yield respectively. The same bacterium produced 52% of PHA and 2.5g/L of yield in media containing sucrose as carbon source.39,40
Use of different waste materials like starch, whey, fermented mash, wheat and rice straw, molasses, tallow, bean curd waste, waste frying oils, spent mash, spent coffee grounds and Sugarcane bagasse and vinasse could yield PHA content from 8% to as high as 89.10%.41
A detailed discussion about our results and the two types of peels as raw materials for our bacterial isolates is described below.
Bacillus Subtilis JCM 1465
On onion peel-based media, the bacterium resulted 89% of PHA in 3:1 C:N ratio at 48h of incubation and resulted in DCW and PHA production of 3.33g/L and 2.93g/L respectively. On orange peel-based media, the same bacterium accumulated 75% of PHA in 1:1 C:N ratio at 96hof incubation. The amount of DCW and PHA production obtained were 0.99g/L and 0.73g/L respectively. On onion peel-based media, the maximum amount of DCW was obtained during 24h of incubation in 2:1 C:N ratio of about 12.69g/L and the PHA production and accumulation obtained were 9.06g/L and 71% respectively. Under same parameters, on orange peel-based media the bacterium resulted in 12.86g/L of DCW, 0.46g/L of PHA production and only 4% of PHA accumulation. Therefore, it should be noted that the bacteria could convert much of DCW into PHA in onion peel-based media in these parameters. Moreover, on orange peel-based media the maximum amount of DCW obtained was 15.96g/L at 48h of incubation in 4:1 C:N ratio during which the PHA production were 1.4g/L (8%). Under same parameters, on onion peel-based media, even if the DCW and PHA production obtained were low (3.10g/L and 1.63g/L), the PHA accumulation obtained was 53% which was higher than that obtained in orange peel-based media. Thus, for this bacterium, onion peel-based media proved to be the better among the two as a carbon source.
Bacillus Siamensis PD- A10
On onion peel-based media, the maximum PHA accumulation obtained was 78% in 4:1 C:N ratio at 48h of incubation and with 5.59g/L DCW and 4.36g/L PHA production respectively. Similarly, on orange peel-based media, the maximum amount of PHA obtainable was 82% with DCW (2.66g/L) and PHA production (2.16g/L) respectively in 1:1 C:N ratio at 24h of incubation. Maximum amount of DCW and PHA production obtained by the bacterium in onion peel-based media was 90.86g/L and 67.56g/L respectively, which amounts to 75% PHA in 3:1 C:N ratio at 48h of incubation. Under same parameters, on orange peel-based media, the bacterium resulted in 9.86g/L of DCW and 0.79g/l of PHA production and only 8% of PHA accumulation. As per our comparative results, orange peel was found to be the ideal carbon source for this bacterium.
Staphylococcus Aureus JH1
In onion peel-based media, maximum amount of PHA accumulation by the bacterium observed was 83% in 1:1 C:N ratio at 96h of incubation during which the DCW and PHA production obtained were 1.56g/L and 1.29g/L respectively. On orange peel-based media the bacterium resulted in 38% PHA accumulation in 3:1 C:N ratio at 96h of incubation with DCW and PHA production of 16.56g/L and 6.36g/L respectively. At 96h of incubation in 4:1 C:N ratio of onion peel-based media, high amount of DCW (42.63g/L) was noted but the PHA production obtained was 5.09g/L (12%). Under same parameters, on orange peel-based media, the DCW was found out to be12.43g/L and PHA production was also low [1.93g/L (15%)]. The bacterium produced high amount of DCW in orange peel-based media in 3:1 C:N ratio at 72h of incubation of about 16.79g/L with the PHA production 3.39g/L (23%). In 4:1 C:N ratio at 72h of incubation on onion peel-based media, the bacterium produced 6.23g/L of PHA, 41.29g/L of DCW and 15% of PHA accumulation. Hence, we could infer from our results that for this bacterium onion peel-based media is better of the two.
Geobacillus Stearothermophillus R-35646
This thermophile could accumulate 54% PHA in 4:1 C:N ratio at 96h of incubation and 62% in 1:1 C:N ratio at 24h of incubation in onion peel-based media and orange peel-based media respectively. The DCW and PHA production obtained under above parameters were low. The highest amount of DCW obtained was 19.20g/L on onion peel-based media in 3:1 C:N ratio at 24h of incubation with PHA production 1.63g/L (9%). On orange peel-based media under similar conditions the bacterium could produce 14.96g/L of DCW, 1.29g/L of PHA with 8% of PHA accumulation. On orange peel-based media, in 2:1 C:N ratio at 96h of incubation, the bacterium produced very high amount of DCW of about 25.56g/L and could convert 42% of it in to PHA. On the contrary, on onion peel-based media, with above parameters, the bacterium showed very less DCW of about 6.66g/L but could convert 53% of it into PHA. Therefore, according to observations, onion peel was found to be better substrate than orange peel.
Cupriavidus Necator
The reference bacterium accumulated 82% of PHA on onion peel-based media in 1:1 C:N ratio at 96h of incubation but the DCW and PHA production obtained under these parameters were comparatively low. Staphylococcus aureus JH1 could produce 83% of PHA with much less DCW and PHA production when compared to reference strain. The percentage of PHA was much higher in Bacillus subtilis JCM 1465 which was 89% with 3.33g/L of DCW in 3:1 C:N ratio at 48h of incubation. On orange peel-based media, the reference strain accumulated 64% of PHA from 1.63g/L of DCW in 4:1 C:N ratio at 96h of incubation. During 96h of incubation in 1:1 C:N ratio, Bacillus subtilis JCM 1465 registered higher accumulation of PHA (75%) and in 1:1 C:N ratio at 24h of incubation whereas, Bacillus siamensis PD-A 10 gave 82% of PHA accumulation, both of which were higher than that obtained by the reference strain under the same conditions. In a similar study, biowaste used was banana peel. Cupriavidus necator, the reference bacterium, accumulated 79.73% of PHA in C:N ratio 3:1 at 96h. Among other bacterial isolates, Geobacillus stearothermophilus R35646 accumulated 84.63% of PHA, Bacillus siamensis PD- A 10 produced 77.55% of PHA, Bacillus subtilis JCM 1465 yielded 71.78% of PHA and Staphylococcus aureus could produce about 70.02% of PHA.42
Conclusion
Hence from the datapoints obtained from our study, it can be surely inferred that our isolates could accumulate better PHA than the reference strain using both the peels as carbon source. This further proves that these bacterial cultures are capable of utilizing the kitchen waste as carbon source for the production of polyhydroxyalkanoates.
Acknowledgments
We are thankful to Dr. P. Shyama Raju, The Founder and Hon’ble Chancellor of Reva Univeristy; Dr. N. Ramesh, The Dean- Training, Placement and Planning and Dr. M. Dhanamjaya, The Registrar of Reva University, Bangalore for constant support and encouragement. We are grateful to Sateesh. G. Muttagi, CEO; Dr. Siddalingeshwar. K. G, Quality Manager and Mr. Babu. S, Business Development Head of Scientific and Industrial Research Center (NABL) Laboratories, Bangalore for providing the lab facilities and for their constant support and assistance. We are grateful to Dr Devanshu Patel, President, Parul University; Dr M.N. Patel, Provost, Parul University and Dr H.S. Vijayakumar, Registrar, Parul University for encouragement.
Conflict of Interest
There is no conflict of Interest.
References
- Zaid M., Jamil N. Production and In-vitro Evaluation of Bioplastics produced by bacteria using Bagasse, International Conference on Chemical, Food and Environmental Engineering (ICCFEE), Dubai (UAE). 2015;115051:11-12. http://dx.doi.org/10.17758/IAAST. A0
- Hawas J. M. E., El-Banna T. E. S., Belal E. B.A., El-Aziz A. A. A. Production of Bioplastics from some selected Bacterial strains. Int. J. Curr. Microbiol. App. Sci. 2016;5(1):10-22.
- Prabhu N. N., Santimano M. C., Mavinkurve S., Bhosle S. N., Garg S. Native granule associated short chain length polyhydroxyalkanoate synthase from marine derived Bacillus sp. NQ-11/A2. Antonie Van Leeuwenhoek. 2010;97:41-50.
- Tembadmani K., Shankar A., D’Souza S., Narvekar M., Rao P. Microbial production of Polyhydroxyalkanoates (PHA) from novel sources: A Review. J. Res. Biosciences. 2015;4(4):16-28.
- Aburas M. M. A. Production of poly β-hydroxybutyrate from Pseudomonas putida MAO12 isolated from waste water sample. Am. Sci. 2016;12(5):107-112.
- Kumari P., Dhingra K. Isolation and Characterization of PHB producing micro-organisms isolated from Root nodules of Leguminous Plants. Int. Quarterly. J. L. Sci. 2013;8(1):109-113.
- Aldor S. I., Keasling D. J. Process design for microbial plastic factories: metabolic engineering of Polyhydroxyalkanoates. Opin. Biotechnol. 2003;14:475-483.
- Bhubalan K., Kam Y. C., Yong K. H., Sudesh K. Cloning and expression of PHA synthase gene from a locally isolated Chromobacterium sp. USM2. J. Microbiol. 2010;6(1):81-90.
- Gomaa E. Z. Prodcution of polyhydroxyalkanoates (PHAs) by Bacillus subtilis and Escherichia coli Grown on Cane Molasses Fortified with ethanol. Arch. Biol. Tech. 2014;51(1):145-154.
- Chanprateep S. Current trends in biodegradable Polyhydroxyalkanoates. J Biosci Bioeng. 2010;110(6):621-632.
- Aly M. M., Albureikan M. O., Rabey H. E., Kabli S. A. Effects of culture conditions on growth and poly β-hydroxybutyric acid production by Bacillus cereus MM7 isolated from soil samples from Saudi Arabia. Sci. J. 2013;10(4):1884-1891.
- Gowdhaman D., Charen T., Vaishali P., Kaushalya M., Amutha K., Ponnusami V. Isolation and Identification of Polyhydroxybutyrate producing bacterial strains (Bacillus thuringiensis GVP) from chlorine contaminated soil. J. ChemTech. Res. 2014;6(5):3197-3202.
- Kumar., Singh M., Purohit H. J., Kalia V. C. Potential of Bacillus sp. to produce Polyhydroxybutyrate from biowastes. J. Appl. Microbiol. 2009;106:2017-2023.
- Dhingra H. K., Priya K. Physiological and molecular identification of Polyhydroxybutyrates (PHBs) producing micro-organisms isolated from root nodules of leguminous plants. J. Microbiol. Res. 2013;7(30):3960-3967.
- Bhuwal A. K., Singh G., Aggarwal N. K., Goyal V., Yadav A. Poly-β-hydroxybutyrate production and management of cardboard industry effluent by new Bacillus sp. NA-10. Bioprocess. 2014;1(9):01-11.
- Rameshwari R., Meenakshisundaram M. A Review on Downstream Processing of Bacterial Thermoplastic- Polyhydroxyalkanoates. J. Pure Appl. Biosci. 2014;2(2):68-80.
- Berlanga M., Montero T., Borrell H. J., Guerrero R. Rapid spectrofluorometric screening of polyhydroxyalkanoate producing bacteria from microbial mats. Int. Microbiol. 2006;9:95-102.
- Chaudhry W. N., Jamil N., Ali I., Ayaz M. H., Hasnain S. Screening for Polyhydroxyalkanoates producing bacterial strains and comparison or polyhydroxyalkanoate production from various inexpensive carbon substrates. Microbiol. 2010. doi: 10.1007/s13213-010-0181-6.
- Sav R. A., Mittal K. A., Thorat A. A., Dubey S., Banerjee U. C. A comparative study on the production of PHA by three different Pseudomonas sp. J. Curr. Microbiol. Appl. Sci. 2014;3(10):940-954.
- Dubois M., Gilles K. A., Hamilton J. K., Rebers P. A., Smith F. Colorimetric Method for Determination of sugars and Related Substances. Chem. 1956;28(3):350-356.
- Krishnaveni S., Balasubramanian T., Sadasivam S. Sugar Distribution in Sweet Stalk Sorghum. Food Chem. 1984;15:229-232.
- Jacquel N., Lo C. W., Wei H., Wu H. S., Wang S. S. Isolation and Purification of Bacterial Poly (3-hydroxyalkanoates). Biochem. Eng. J. 2008;39:15-27.
- Chee J. Y., Yoga S. S., Lau N. S., Ling S. C., Abed R. M. M., Sudesh K. Bacterially produced Polyhydroxyalkanoates (PHAs): Converting Renewable Resources into Bioplastics. In: Applied Microbiology and Microbial Biotechnology (A. Mendez- Vilas, ed). Universiti Sains Penang: Malaysia, Formatex. 2010;395-1404.
- Santhanam A., Sasidharan S. Microbial Production of Polyhydroxyalkanoates (PHA) from Alcaligens spp. and Pseudomonas oleovorans using Different Carbon Sources. J. Biotechnol. 2010;9(21):3144-3150.
- Marjadi D., Dharaiya N. Isolation, Screening and Characterization of Polyhydroxyalkanoates Producing Bacteria Utilizing Edible Oil as Carbon Sources. Env. Res. Dev. 2011;5(3):764-772.
- Shivakumar S. Accumulation of Poly (3-hydroxybutyrate) by Microbacterium barkeri DSM 20145. J. Biol. 2012;36:225-232.
- Chaitanya., Mahmood S. K., Rana K., Sunil K. N. Biotechnological production of Polyhydroxyalkanoates by Various Isolates: A Review. Int J Pharm Sci Invent. 2014;3(9):01-11.
- Du G.,Chen J.,Yu J., Lun S. Continuous production of Poly-3-hydroxybutyrate by Ralstonia eutropha in a two-staged culture system. J. Biotechnol. 2001;88:59-65.
- Preethi R., Sasikala P., Aravind J. Microbial Production and Polyhydroxyalkanoate (PHA) Utilizing Fruit Waste as a Substrate. Biotechnol. 2012;3(1):61-69.
- Girija D., Deepa K., Xavier F., Antony I., Shidhi P. R. Analysis of cow dung microbiota- A metagenomic approach. J. Biotechnol. 2013;12:372-378.
- Srilakshmi S., Rao V. S. C. R. Studies on screening, isolation and molecular characterization of PHB producing Staphylococcus spp. J. Int Sci. Inn. Tech. Sec. B. 2012;1(5):24-31.
- Godoy F., Vancanneyt M., Martinez M., Steinbüchel A., Swings J., Rehm B. H. Sphingopyxis chilensis nov, a chlorophenol-degrading bacterium that accumulates polyhydroxyalkanoates and transfer of Sphingomonas alaskensis to Sphingopyxis alaskensis comb. nov. Int. J. Syst. Evol. Microbiol. 2003;53:473-477.
- Fernandez- Castillo R., Rodriguez- Valera F., Gonalez- Ramos J., Ruiz- Berraquero F. Accumulation of Poly (β- hydroxybutyrate) by Halobacteria. Env. Microbiol. 1986;51(1):214-216.
- Hwan J., Jeon O. C., Choi H. M., Yoon C. S., Park W. Polyhydroxyalkanoates (PHA) production using waste vegetable oil by Pseudomonas sp. Strain DR2. J. Microbio. Biotechnol. 2008;18(8):1408-1415.
- Yao J., Zhang G., Wu Q., Chen G.Q., Zhang R. Production of Polyhydroxyalkanoates by Pseudomonas nitroreducens. Antonie Van Leeuwenhoek. 1999;75:345-349.
- Gowda V., Shivakumar S. Agrowaste-based Polyhydroxyalkanoate (PHA) Production using Hydrolytic Potential of Bacillus thuringiensis IAM12077. Arch. Biol. Technol. 2014;57(1):55-61.
- Porwal S., Kumar T., Lal S., Rani A., Kumar S., Cheema S., Purohit J. H., Sharma R., Patel S. K. S., Kalia C. V. Hydrogen and Polyhydroxybutyrate producing abilities of microbes from diverse habitats by dark fermentative process. Technol. 2008;99: 5444-5451.
- Heinrich D., Madkour M. H., Al-Ghamdi M. A., Shabbaj I. I. Large scale extraction of poly (3-hydroxybutyrate) from Ralstonia eutropha H16 using sodium hypochlorite. AMB express. 2012;2(59):1-6.
- Vijay R., Tarika K. Production of Polyhydroxyalkanoates (PHAs) using Synthetic Biology and Metabolic Engineering Approaches. J. Biotechnol. 2018;13(1):99-109.
- Kumar P. K. A., Shamala T. R., Kshama L., Prakash M. H., Joshi G. J., Chandrashekar A., Kumari K. S. L., Divyashree M. S. Bacterial synthesis of poly (hydroxybutyrate-co- hydroxyvalerate) using carbohydrate- rich Mahua (sps) flowers. J. Appl. Microbiol. 2007;103:204-209.
- Raza Z. A., Abid S., Banat M. I. Polyhydroxyalkanoates: Characteristics, production, recent developments and applications. Biodeterior. Biodegradation. 2018;126:45-56.
- Vijay R., Tarika K. Banana peel as an inexpensive carbon source for microbial polyhydroxyalkanoates (PHA) production. Int. Res. J. Env. Sci. 2018;7(1):1-8.

This work is licensed under a Creative Commons Attribution 4.0 International License.


