

Manuscript accepted on : 10-April-2019
Published online on: 31-03-2019
Plagiarism Check: Yes
Assessment of Genetic Diversity in Castor (Ricinus Communis L.) Using Microsatellite Markers
Bharat A. Chaudhary1, Manubhai P. Patel1, Darshan T. Dharajiya1,2 and Kapil K. Tiwari1,3
1Department of Genetics and Plant Breeding, C. P. College of Agriculture, Sardarkrushinagar Dantiwada Agricultural University (SDAU), Sardarkrushinagar-385506, Gujarat, India.
2Department of Biotechnology, Mehsana Urban Institute of Sciences, Ganpat University, Ganpat Vidyanagar-384012, Mehsana, Gujarat, India.
3Central Instrumentation Laboratory, SDAU, Sardarkrushinagar-385506, Gujarat, India.
Corresponding Author E-mail: darshanbiotech1@gmail.com
DOI : http://dx.doi.org/10.13005/bbra/2721

ABSTRACT: Due to expanded usage and a primary raw material for various industrial applications and biofuel production, variability is necessity to develop high yielding castor (Ricinus communis L.) genotypes. Therefore, it is essential to document the germplasm of this important crop to increase its production. With this view, a study was conducted with 15 diverse castor genotypes to evaluate diversity using 14 microsatellite/simple sequence repeats (SSRs) markers. In SSR analysis, 14 primers generated a total of 31 amplicons with mean number of 2.21 polymorphic amplicons per primer. The range of molecular weight of these amplicond/bands was from 120 to 300 bp. The polymorphic information content (PIC) ranged from 0.231 (SSR-8) to 0.684 (SSR-10) with an average of 0.413. The primers SSR-7 and SSR-10 possess higher PIC value above 0.6. The highest genetic similarity was noticed between the genotypes, GEETA and 48-1 whereas; least genetic similarity was reported between the genotypes namely, JI-96 and SH-72. Clustering pattern of dendrogram generated by pooled SSR data showed two main clusters. The cluster A was the largest with eight genotypes and cluster B contained seven genotypes. Accessions, JI-96 and SH-72 were identified as highly diverse based on molecular studies and can be exploited to develop biparental mapping populations as well as in castor improvement program to wider the genetic background of various castor genotypes.
KEYWORDS: Genetic Diversity; Microsatellite Markers; Ricinus Communis L.; SSR
Download this article as:| Copy the following to cite this article: Chaudhary B. A, Patel M. P, Dharajiya D. T, Tiwari K. K. Assessment of Genetic Diversity in Castor (Ricinus Communis L.) Using Microsatellite Markers. Biosci Biotech Res Asia 2019;16(1). |
| Copy the following to cite this URL: Chaudhary B. A, Patel M. P, Dharajiya D. T, Tiwari K. K. Assessment of Genetic Diversity in Castor (Ricinus Communis L.) Using Microsatellite Markers. Biosci Biotech Res Asia 2019;16(1). Available from: https://bit.ly/2UXEbWh |
Introduction
Castor (Ricinus communis L.) with chromosome number 2n = 2X = 20, resides one of the most important non-edible oilseed crop which is found across all the tropical and semi-tropical areas of the world. It belongs to mono-specific genus Ricinus of Euphorbiaceae family. It has cross pollination up to the extent of 50 per cent due to its monoecious nature.1 It is believed that castor’s center of origin of should be Ethiopian-East African region as Ethiopia has maximum diversity of castor.2 It is a major source of ricinoleic acid which is an unusual hydroxyl fatty acid found in castor seeds.3 Castor oil is mainly used as a laxative, but it is also used for the production of several industrial products like plasticizers, grease, paints, lubricants, drying oil, cosmetics, lipsticks, plastics, surfactants, insulators etc.4 Due to its high demand, castor is a commercial crop in various countries like India, China, Brazil, Russia, Philippines and Thailand and it has around 19% of the total area in the global oilseed scenarios and 9% of the total phyto-oil production.5 Globally, India is leading producer and exporter of castor seed oil with export of 80% of its total castor oil. Even though, the castor is important export product of agriculture sector, it is grown merely on 1.5 million ha to a limited level. By considering the stable demand for castor oil in numerous industries, there is crucial need to prominently improve the area, production and yield of castor crop.6
Knowledge of the genetic diversity and relationship among the varieties are very useful in recognition of gene pools, identification of germplasm and its management strategies. Identification of genetic diversity using DNA markers can provide insights into the genetic structure and diversity among varieties from different geographical origins. When the magnitude and nature of genetic diversity is estimated in advance, a suitable selection strategy is planned to accord with heritability of genetic traits. A combination of passport data and genetic diversity information from molecular markers would therefore enhance the formation of germplasm stocks.7 Among the various DNA-based markers, SSR (microsatellite) is a class of genetic marker that has proven to be abundant and well distributed throughout the genome of plants.8 The simple sequence repeats markers require only small amounts of DNA sample without involving radioactive labels and are simpler as well as faster. Moreover, SSR markers have ability to discriminate genotypes into homozygotes and heterozygotes due to co-dominant nature, high level of polymorphism as compared to most of the molecular markers,9 robustness, multi-allelic in nature, highly reproducible, hyper-variability, high information containing and amenability to automation.10 Microsatellite/SSR markers can be used as a powerful tool for genotyping and diversity study. Hence, the present research was carried out to assess the genetic diversity among diverse genotypes of castor using SSR markers.
Materials and Methods
Genomic DNA Extraction
A set of 15 genotypes of castor having diverse morphological qualitative characters (Table 1) was procured from Main Castor-Mustard Research Station, S. D. Agricultural University, Sardarkrushinagar, Gujarat, India was used for the assessment of genetic diversity using SSR markers in the present study. Genomic DNA of 15 castor genotypes was isolated from bulked fresh leaf tissues with modified CTAB method.11 The integrity and quality of extracted DNA was confirmed on 0.8% agarose gel followed by quantification of DNA using spectrophotometer (BioSpectrometer, Eppendorf, Germany). Finally, each DNA sample was diluted to a working concentration of 20 ng/µl and kept at 4°C.
Table 1: Castor genotypes used in present study.
| Sr. No. | Genotypes | Qualitative characters | ||||||||
| Stem color | Bloom | Capsule type | Types of internodes | Leaf shape | Spike type | Inflorescence spike types | Plant type | Seed shape | ||
| 1 | VP-1 | Green | Triple | Spiny | Condensed | Deep cup | Compact | Pistillate | Dwarf | Oval |
| 2 | GEETA | Red | Double | Non-spiny | Elongated | Flat | Loose | Pistillate | Tall | Round |
| 3 | JP-65 | Red | Zero | Spiny | Elongated | Flat | Compact | Pistillate | Medium | Oval |
| 4 | SKP-84 | Mahogany | Triple | Spiny | Condensed | Deep cup | Semi-compact | Pistillate | Dwarf | Oval |
| 5 | VI-9 | Green | Double | Spiny | Elongated | Flat | Compact | Monoecious | Medium | Oval |
| 6 | JI-35 | Green | Double | Spiny | Elongated | Flat | Compact | Interspersed | Tall | Round |
| 7 | 48-1 | Red | Double | Non-spiny | Elongated | Flat | Loose | Interspersed | Tall | Oval |
| 8 | SH-72 | Green | Double | Spiny | Elongated | Flat | Compact | Interspersed | Tall | Oval |
| 9 | JI-96 | Mahogany | Triple | Spiny | Elongated | Flat | Loose | Monoecious | Tall | Oval |
| 10 | SKI-215 | Mahogany | Double | Non-spiny | Elongated | Flat | Semi-compact | Interspersed | Tall | Oval |
| 11 | SKI-352 | Mahogany | Triple | Spiny | Elongated | Flat | Compact | Interspersed | Medium | Oval |
| 12 | SKI-370 | Mahogany | Triple | Spiny | Elongated | Flat | Compact | Interspersed | Medium | Oval |
| 13 | SKI-372 | Mahogany | Triple | Spiny | Elongated | Flat | Semi-loose | Interspersed | Medium | Oval |
| 14 | SKI-373 | Mahogany | Double | Spiny | Elongated | Flat | Semi-loose | Interspersed | Medium | Oval |
| 15 | DCS-94 | Green | Triple | Spiny | Elongated | Flat | Semi-loose | Interspersed | Medium | Oval |
PCR Amplification and Electrophoresis
Total 14 SSR primers, developed at SDAU12 were used for PCR amplification in the present study (Table 2). The PCR was carried out in 15 µl reaction mixture which contained 1.0 µl template DNA, 1.5 µl 10X PCR buffer, 2.0 µl primer (reverse and forward), 1.5 µl Taq polymerase, 1.2 µl dNTPs (2.5 mM each), 1.2 µl 25 mM MgCl2 and 6.6 µl sterile nuclease free water. The PCR reaction was carried out by following cycling conditions: an initial denaturation at 94°C for 5 min., followed by 35 cycles of denaturation at 94°C for 1 min., primer annealing at Tm − 2°C (primer specific) for 30 sec., amplification at 72°C for 1:30 min., and a final extension at 72°C for 7 min.in (Eppendorf, Germany). For the separation of amplified SSR products, electrophoresis was performed in 3.0% agarose gel.13 After electrophoresis, the gel was carefully taken out from unit and photographed using FluroChem FC2 gel documentation system (Alpha Innotech Corporation, USA).
Table 2: Particulars of polymorphic SSR primer pairs used in the study.
| Sr. No. | Primer Name | Sequence | Tm (°C) | TA | PA | % P | PIC | Range of MW (bp) | |
| 1 | Castor_SSR_1 | FP | CGTAATGGGTCCGAGTCATC | 58 | 02 | 02 | 100 | 0.408 | 185 to 191 |
| RP | AGAAACTCGGTGGTCTTCCA | 58 | |||||||
| 2 | Castor_SSR_2 | FP | TTTTGTTGCATTTCGTTTGC | 52 | 02 | 02 | 100 | 0.391 | 254 to 278 |
| RP | TGATGGGCTTCTCAATGATG | 54 | |||||||
| 3 | Castor_SSR_3 | FP | TACCTCCAGGTCCTCCTCCT | 62 | 02 | 02 | 100 | 0.337 | 127 to 151 |
| RP | ATTGTGCCACATGGTTGAGA | 56 | |||||||
| 4 | Castor_SSR_4 | FP | AAGTAAAATTTGCAAACACATGC | 52 | 02 | 02 | 100 | 0.320 | 251 to 266 |
| RP | GCACGTGAAACATATGGCTG | 57 | |||||||
| 5 | Castor_SSR_5 | FP | TCGCAAATGGAAATTACGTG | 53 | 02 | 02 | 100 | 0.459 | 262 to 274 |
| RP | CAGAACGGCTAGCAATGAAA | 55 | |||||||
| 6 | Castor_SSR_6 | FP | CCGAGACTAAGAATGGACCAA | 56 | 02 | 02 | 100 | 0.495 | 221 to 259 |
| RP | TCAAACTCAGCGAGTAGGCA | 58 | |||||||
| 7 | Castor_SSR_7 | FP | GGTTGCAGAAGCTCCAAAAA | 56 | 03 | 03 | 100 | 0.665 | 217 to 249 |
| RP | TAATACGCGGATGCAGACAG | 57 | |||||||
| 8 | Castor_SSR_8 | FP | GTGCCGTTGAAGGATCAGTT | 58 | 02 | 02 | 100 | 0.231 | 165 to 193 |
| RP | GGCTTTGGTGAAGGTTTTGA | 55 | |||||||
| 9 | Castor_SSR_9
|
FP | TGCAACAGGCAACCATCTAC | 58 | 02 | 02 | 100 | 0.320 | 120 to 136 |
| RP | TCCATCTTTGTCTCTTCCTTCA | 55 | |||||||
| 10 | Castor_SSR_10
|
FP | GAATTTGCAACGATGGCTTT | 54 | 04 | 04 | 100 | 0.684 | 136 to 158 |
| RP | TGGGACCTTGGTCAAGTGAT | 58 | |||||||
| 11 | Castor_SSR_11
|
FP | TCCTTATGAACAAAGTGGAGAATG | 54 | 02 | 02 | 100 | 0.391 | 261 to 297 |
| RP | CAGCTTGAGGGGGAGTGTTA | 59 | |||||||
| 12 | Castor_SSR_12 | FP | CACATGCTTGGCTTCTTTCA | 55 | 02 | 02 | 100 | 0.492 | 167 to 184 |
| RP | CGAGCATCACCAGAGTGTTT | 57 | |||||||
| 13 | Castor_SSR_13 | FP | CAGAGCCCATGGTGATTTCT | 57 | 02 | 02 | 100 | 0.337 | 234 to 288 |
| RP | CCACAAAAAGCAGCCAAATC | 55 | |||||||
| 14 | Castor_SSR_14 | FP | GGACACGTGTGTTGCTGTAAG | 59 | 02 | 02 | 100 | 0.245 | 271 to 300 |
| RP | TGGGAGCTATACCAAAGAAACAA | 55 | |||||||
| Total | 31 | 31 | – | – | – | ||||
| Mean | 02.21 | 02.21 | 100 | 0.413 | – | ||||
| Range | 02-04 | 02-04 | – | 0.231 to 0.684 | 120 to 300 | ||||
FP: Forward Primer; RP: Reverse Primer; Tm: Melting Temperature; TA: Number of Total Alleles; PA: Number of Polymorphic Alleles; %P: Per cent Polymorphism; PIC: Polymorphism Information Content; MW: Molecular Weight; bp: Base Pairs.
Scoring and Analysis of Data
Data were scored for computer analysis on the basis of the presence or absence of the PCR products. If a product was present in a genotype, it was designated as ‘1’ and if absent it was designated as ‘0’. The genetic association between genotypes evaluated was made by calculating the Jaccard’s similarity coefficient for pair wise comparisons based on the proportions of shared bands produced by the primers.14 The similarity coefficients were used for cluster analysis using the Un-weighted Pair Group Method with Arithmetic Mean (UPGMA) and Principal Component Analysis (PCA) were performed with a bootstrap frequency of n=500 in software PAST version 3.18.15 The software program AlphaEase FC version 6.0.0 was used to determine the molecular weight of bands separated on the gel. The Polymorphism Information Content (PIC) value was calculated on the basis of allele frequency by the given formula.16 The polymorphism percentage was calculated by the following formula. Polymorphism (%) = (Number of polymorphic bands/Total number of bands) × 100.
Result and Discussion
The inherent problem of genotype × environment interaction associated phenotype based variability can be easily conquered through DNA markers.17 In the present study, out of 14 SSR primers, all the fourteen primers were polymorphic. The molecular weight of the amplicons produced by SSR primers ranged from 120 bp (SSR-9) to 300 bp (SSR-14). A total of 31 alleles were amplified and average number of allele was 2.21 with a range of 2 to 4 alleles/amplicons per primer (Table 2). The past reports showed 1.8,18 2.30,19 3.0,20 3.14,6 3.18, 214.9,22 5.523 and 6.724 mean numbers of alleles per primer.
The PIC for SSRs used in the present study ranged from 0.231 (SSR-8) to 0.684 (SSR-10) with an average of 0.413 (Table 2, Fig. 1). Some of the past reports on the utilization of SSR markers for the genetic diversity analysis in castor contained lower PIC values viz., 0.2621 and 0.37.25 However, some reports have higher PIC values as compared to present study like, 0.43,6 0.43,20 0.51,19 0.70,23 0.76,22 0.8124 and 0.87.18 It is important to be mentioned that most of the past studies having higher PIC values were carried out using less number of primers as compared to the present study. Overall, the PIC values found in the present study are appropriate to assess the genetic diversity among castor genotypes.
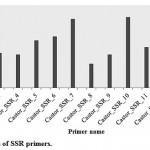 |
Figure 1: PIC values of SSR primers.
|
The genetic similarity coefficient ranged from 0.143 to 0.882. The highest similarity coefficient (0.882) was noticed between the genotypes GEETA and 48-1 indicating that they are genetically more similar as compared to other genotypes, whereas the lowest similarity (0.143) was noticed between the genotypes namely, JI-96 and SH-72 showing that these two genotypes had least genetic similarity (Table 3). According to the similarity coefficients, genotypes used in the present study possessed higher variation among the set of genotypes as compared to few previous studies which had range of similarity coefficients from 0.57 to 1.0018 and 0.44 to 0.8826 and less variation as compared to the results of some other reports viz., 0.07 to 1.0,23 0.26 to 1.019 and 0.05 to 0.96.21 According to the SSR analysis, GEETA and 48-1 were most similar genotypes which is also supported by the qualitative morphological characters which are similar in both of these genotypes viz., red stem, double bloom, non-spiny spike, elongated internodes, flat leaf shape, loose spike, tall plant type and oval seed shape. The little variation present between GEETA and 48-1 might be due to few different characters like GEETA contains pistillate inflorescence whereas 48-1 possesses interspersed type of inflorescence. JI-96 and SH-72 genotypes were most diverse genotypes revealed by SSR amplification which might be due to presence of variations in morphological characters viz., JI-96 has green stem whereas SH-72 has green stem color, JI-96 has triple bloom whereas SH-72 has double bloom, JI-96 has loose spike whereas SH-72 has compact spike and JI-96 has monocious inflorescence spike whereas SH-72 has interspersed inflorescence spike.
Table 3: Jaccard’s similarity coefficients for castor genotypes based on SSR markers.
| Genotype | VP-1 | GEETA | JP-65 | SKP-84 | VI-9 | JI-35 | 48-1 | SH-72 | JI-96 | SKI-215 | SKI-352 | SKI-370 | SKI-372 | SKI-373 | DCS-94 |
| VP-1 | 1.000 | ||||||||||||||
| GEETA | 0.476 | 1.000 | |||||||||||||
| JP-65 | 0.579 | 0.476 | 1.000 | ||||||||||||
| SKP-84 | 0.632 | 0.455 | 0.476 | 1.000 | |||||||||||
| VI-9 | 0.450 | 0.429 | 0.318 | 0.364 | 1.000 | ||||||||||
| JI-35 | 0.318 | 0.304 | 0.450 | 0.250 | 0.474 | 1.000 | |||||||||
| 48-1 | 0.550 | 0.882 | 0.550 | 0.391 | 0.500 | 0.364 | 1.000 | ||||||||
| SH-72 | 0.304 | 0.476 | 0.304 | 0.292 | 0.611 | 0.706 | 0.550 | 1.000 | |||||||
| JI-96 | 0.600 | 0.333 | 0.455 | 0.455 | 0.231 | 0.231 | 0.333 | 0.143 | 1.000 | ||||||
| SKI-215 | 0.364 | 0.632 | 0.500 | 0.240 | 0.450 | 0.526 | 0.722 | 0.579 | 0.231 | 1.000 | |||||
| SKI-352 | 0.563 | 0.471 | 0.563 | 0.389 | 0.333 | 0.600 | 0.563 | 0.600 | 0.556 | 0.412 | 1.000 | ||||
| SKI-370 | 0.364 | 0.476 | 0.500 | 0.292 | 0.381 | 0.261 | 0.550 | 0.364 | 0.231 | 0.364 | 0.389 | 1.000 | |||
| SKI-372 | 0.429 | 0.292 | 0.429 | 0.550 | 0.261 | 0.208 | 0.348 | 0.250 | 0.455 | 0.200 | 0.412 | 0.500 | 1.000 | ||
| SKI-373 | 0.550 | 0.524 | 0.409 | 0.391 | 0.364 | 0.250 | 0.600 | 0.348 | 0.545 | 0.409 | 0.471 | 0.476 | 0.550 | 1.000 | |
| DCS-94 | 0.450 | 0.304 | 0.318 | 0.364 | 0.333 | 0.400 | 0.364 | 0.381 | 0.455 | 0.261 | 0.412 | 0.381 | 0.450 | 0.364 | 1.000 |
The dendrogram was prepared based on UPGMA by using Jaccard’s similarity co-efficients through PAST (version 3.18) (Fig. 2). The dendrogram (Jaccard’s distance, paired-group) clustered with the data generated by all primers and their amplicons grouped the 15 castor genotypes into two major clusters i.e., cluster A and cluster B as shown in fig. 2. Among the two major clusters, the cluster A contained eight genotype and the cluster B contained seven genotypes. The cluster A was further divided into two sub-clusters viz., A1 and A2. The sub-cluster A1 contained seven genotypes viz., SKI-370, SKI-372, SKI-373, SKP-84, JI-96, VP-1 and JP-65, while sub-cluster A2 contained only one genotype namely, DCS-94. The cluster B also further divided into two sub-clusters B1 and B2. The sub-cluster B1 contained four genotypes viz., VI-9, JI-35, SH-72 and SKI-352, whereas sub-cluster B2 containing three genotypes namely, SKI-215, GEETA and 48-1. Similarly, grouping of the genotypes in two major clusters were observed in the past studies.21-26 Further, more number of genotypes can be used for the diversity assessment in castor using more number of polymorphic primers for more accurate estimation of diversity and population structure analysis. Recently, this kind of works have been published.27,28
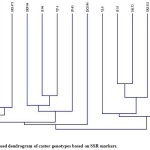 |
Figure 2: UPGMA based dendrogram of castor genotypes based on SSR markers.
|
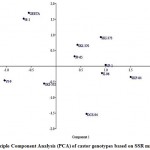 |
Figure 3: 2-D plot of Principle Component Analysis (PCA) of castor genotypes based on SSR markers.
|
The 2-D PCA plot was derived from the two major components after analyzing SSR genotyping data. In the PCA plot, it can be observed that GEETA followed by JI-35 were placed farthest in the 2nd component (Y- axis), while SKI-372 and SH-72 were placed farthest in the 1st component (X- axis) (Fig. 3). This grouping pattern of 2-D PCA plot matched with the dendrogram obtained through UPGMA based cluster analysis. The genotypes scattered throughout the 2-D plot. The genotypes namely, GEETA and JI-35 contained round seed shape hence, they might be placed far from other genotypes on 2-D PCA plot. This grouping pattern of PCA matched with the dendrogram obtained through UPGMA based cluster analysis.
Conclusion
Castor is important industrial crop which exhibits outstanding diversity in the India. Our study shows that there is amazing genetic variation existing among castor genotypes, however this is primitive effort, the study exhibited potential of SSR marker for elucidation of genetic diversity. Hence, result from the present study will help breeders for the assessment the diversity at molecular and better utilization of germplasm for the variety development. Among all the genotypes used in the study, JI-96 and SH-72 were most diverse genotypes which can be utilized for further breeding experiments.
Acknowledgements
All the authors are thankful to the authorities of SDAU, Sardarkrushinagar, Gujarat, India, for providing necessities to conduct the research work.
References
- Severino L. S., Auld D. L., Baldanzi M., Cândido M. J., Chen G., Crosby W., Tan D., He X., Lakshmamma P., Lavanya C., Machado O. L. A review on the challenges for increased production of castor. J. 2012;104(4):853-80.
- Foster J. T., Allan G. J., Chan A. P., Rabinowicz P. D., Ravel J., Jackson P. J., Keim P. Single nucleotide polymorphisms for assessing genetic diversity in castor bean (Ricinus communis). BMC Plant Biol. 2010;10(1):13.
CrossRef - Jeong G. T., Park D. H. Optimization of biodiesel production from castor oil using response surface methodology. Biochem. Biotechnol. 2009,156:431-41.
CrossRef - Suhail A. H., Sakure A. A., Bharose A. A., Umale A. A., Sushil K., Subhash N. Identification and characterization of low and high ricin containing castor (Ricinus communis) Genotypes. Vegetos. 2015;28(3):92-7.
CrossRef - Manjunath K. G., Sannappa B. Identification of castor (Ricinus communis) ecotypes through molecular characterization in the selected regions of the western ghats of karnataka, India. Int. J. Bioassays. 2014;3(11):3492-8.
- Rukhsar S., Patel M. P., Parmar D. J., Kalola A. D., Kumar S. Morphological and molecular diversity patterns in castor germplasm accessions. Crops Prod. 2017;97:316-23.
CrossRef - Akkale C.,Yildirim C. A., Yildirim M. B., Kaya C., Öztürk G., Tanyolaç B. Assessing genetic diversity of some potato (Solanum tuberosum) genotypes grown in Turkey using the AFLP marker technique. Turk. J. Field Crops. 2010;15(1):73-8.
- Wu M., Jia X., Tian L., Lv B. Rapid and reliable purity identification of F1 hybrids of Maize (Zea mays) using SSR markers. Maize Genomics and Genetics. 2010;30:1.
- Powell W., Morgante M., Andre C., Hanafey M., Vogel J., Tingey S., Rafalski A. The comparison of RFLP, RAPD, AFLP and SSR (microsatellite) markers for germplasm analysis. Breed. 1996;2(3):225-38.
CrossRef - Barvaliya P., Singh N. K., Dharajiya D., Pachchigar K. Elucidation of genetic diversity among ashwagandha [Withania somnifera (L.) Dunal] genotypes using EST-SSR markers. J. Biotechnol. 2018;13(10):52-9.
- Doyle J. J. Isolation of plant DNA from fresh tissue. Focus. 1990;12:13-5.
- Anonymous Castor Annual Report 2016-17. Agriculture Research Council of S. D. Agricultural University, Sardarkrushinagar, Gujarat, India. 2017.
- Dharajiya D. T., Khadia S. M., Pagi N. K., Khatrani T. J., Jasani H. V., Khunt A. D., Ravindrababu Y. Modified method of high quality genomic DNA extraction from mungbean [Vigna radiata (L.) Wilczek] suitable for PCR based amplification. Ind. J. Sci. Technol. 2017;10(20):1-7.
CrossRef - Jaccard P. Nouvelles recherches sur la distribution florale. Soc. Vaud. Sci. Nat. 1908;44:223-70.
- Hammer Ø., Harper D. A., Ryan P. D. PAleontological STatistics software: package for education and data analysis. Electron. 2001;4(1):1-9.
- Prevost A., Wilkinson M.J. A new system of comparing PCR primers applied to ISSR fingerprinting of potato cultivars. Appl. Genet. 1999, 98(1):107-12.
CrossRef - Boghara M. C., Dhaduk H. L., Kumar S., Parekh M. J., Patel N. J., Sharma R. Genetic divergence, path analysis and molecular diversity analysis in cluster bean (Cyamopsis tetragonoloba Taub.). Ind. Crops Prod. 2016;89:468-77.
CrossRef - Dhingani R. M., Tomar R. S., Parakhia M. V., Patel S. V., Golakiya B. A. Analysis of genetic diversity among different Ricinus communis genotypes for macrophomina root rot through RAPD and microsatellite markers. J. Plant Prot. 2012;5:1-7.
- Rao P. V., Shankar V. G., Pavani J. V., Rajesh V., Reddy A. V. Genetic diversity analysis for drought tolerance in castor using EST SSR markers. Crops Res. 2012;44:152-5.
- Usha K. B., Paandian S. S., Lavanya C. Diagnostic set of SSR markers for molecular fingerprinting of parental lines and hybrid purity testing in castor (Ricinus communis ). Int. J. Pure and Appl. Biosci. 2017;5(6):1608-15.
CrossRef - Seo K. I., Lee G. A., Ma K. H., Hyun D. Y., Park Y. J., Jung J. W., Lee S. Y., Gwag J. G., Kim C. K., Lee M. C. Isolation and characterization of 28 polymorphic SSR loci from castor bean (Ricinus communis). J. Crop Sci. Biotechnol. 2011;14(2):97-103.
CrossRef - Kinjal K., Talati J. G. Molecular characterization of castor (Ricinus communis) genotypes through SSR and ISSR markers. Ind. J. Agric. Biochem. 2014;27(1):20-4.
- Quintero P., Lopez J. L. A., Colin C. A. N., Colmenero A. Z., Garcia N. M., Bonilla J. L. S., Rangel M. R. A. Assessing the genetic diversity of castor bean from Chiapas, Mexico using SSR and AFLP markers. Ind. Crops Prod. 2013;41:134-43.
CrossRef - Gálová Z., Vivodík M., Balážová Ž., Hlozáková T. K. Identification and differentiation of Ricinus communis using SSR markers. Potravinarstvo Slovak J. Food Sci. 2015;9(1):556-61.
CrossRef - Meena K., Kammili A., Betha U. K., Vivekananda K. Agro-morphological and Molecular Diversity in Castor (Ricinus communis) Germplasm Collected from Andaman and Nicobar Islands, India. Czech J. Genet. Plant Breed. 2015;51(3):96–109.
- Sakure A. A., Dhaduk H. L., Mehta D. R., Madaria R. B. Discrimination of castor (Ricinus communis) genotypes through SSR marker. Asian J. Bio Sci. 2012;7(1):71-6.
- Senthilvel S., Shaik M., Anjani K., Shaw R. K., Kumari P., Sarada C., Kiran B. U. Genetic variability and population structure in a collection of inbred lines derived from a core germplasm of castor. J Plant Biochem. Biotechnol. 2017;26(1):27-34.
CrossRef - Dharajiya D., Shah A., Tiwari K. K., Patel M. P., Patel C. J., Patel D. K., Desai A. G. PS I – 14: Identification of diversity pools among castor genotypes using microsatellite markers. 1st National Genetics Congress (NGC) on Genetics for Sustainable Food Security, Health and Nutrition. 14th – 16th December, IARI, New Delhi. 2018;53.

This work is licensed under a Creative Commons Attribution 4.0 International License.


