

Manuscript accepted on : 24-Dec-2018
Published online on: 27-12-2018
Plagiarism Check: Yes
Spectral Characterization and Antibacterial Activity of Synthesis Graphene Oxide Nanosheets
Adi M. Abdul Hussien, Russel R. Ghanim and M. R. Mohammad
Department of Applied Science, University of Technology, Baghdad-Iraq.
Correspondence Author E-mail: russull.rushdi@gmail.com
DOI : http://dx.doi.org/10.13005/bbra/2711

ABSTRACT: Graphene based materials have wide potential applications in biology, biomedical, agriculture environmental and biotechnology. Graphene Oxide (GO) is one of those substances and has a promising material as antimicrobial agents. In this work, the GO nanosheets have been synthesized by novel, easy, and efficient technique is simplified Hummer's method. The spectral properties of the synthesis GO nanosheets were characterized by using Raman, FTIR, and UV-Vis techniques. The Raman spectroscopy has been used to measure number of layers (sheets), grain size, and to identify the ordered and disordered structure of GO nanosheets. Fourier Transform-Infrared spectroscopy (FTIR) has confirmed the presence of the oxygen containing functional groups of the GO nanosheets. The Ultraviolet-Visible (UV-Vis) absorption spectrum shows two peaks, one in the UV region and the other band in visible region. The purpose of this work is to inspect the antibacterial activities of GO nanosheets, which has been synthesized by this novel way (simplified Hummer's method). It was tested against two microorganisms, Escherichia coli (E. coli) and Staphylococcus aureus (S. aureus) as model of Gram-negative bacteria and Gram-positive bacteria, respectively. Bacteriological studies were achieved by minimum inhibitory concentration (MIC), and cell viability analysis. The MIC showed the lowest concentration inhibits the bacterial growth of GO nanosheets, which is observed for E. coli was 125 μg/ml and 62.5 μg/ml for S. aureus. The cell viability analysis measured by florescent microscope has been confirmed the damage, which has been occurred on bacterial nucleic acid for the two types of bacteria.
KEYWORDS: Cell Viability Analysis; FTIR; Graphene Oxide; MIC; Raman; UV-Vis
Download this article as:| Copy the following to cite this article: Hussien A. M. A, Ghanim R. R, Mohammad M. R. Spectral Characterization and Antibacterial Activity of Synthesis Graphene Oxide Nanosheets. Biosci Biotech Res Asia 2018;15(4). |
| Copy the following to cite this URL: Hussien A. M. A, Ghanim R. R, Mohammad M. R. Spectral Characterization and Antibacterial Activity of Synthesis Graphene Oxide Nanosheets. Biosci Biotech Res Asia 2018;15(4). Available from: https://www.biotech-asia.org/?p=32380 |
Introduction
Infectious diseases involved by pathogens bacteria continue to be one of the greatest health problems worldwide, afflicting millions of people yearly. E. coli and S. aureus are main bacterial pathogens that can cause life threatening human diseases. Herein, antibacterial substances are widely used to target pathogens bacteria in daily life and effectively protect the public health.1 The study of carbon nanostructures is widely spread due to their unique properties and various applications. This is to say, among the numerous types of carbon, graphene is considered one of the most dealt within the present decade due to its excellent properties.2-5 Graphene Based Materials involve few layer graphene, graphene nanosheets, GO and reduced graphene oxide (RGO).6 Graphene, which consists of a single atomic layer of sp2 two dimensional (2D) hybridized carbon atoms arranged as a honeycomb structure, is a basic building block for all graphitic forms, 0D (nanodots) fullerenes; 1D nanotubes and 3D graphite are all derived from 2D graphene. Actually, GO has been more intensively studied than graphene. Although, graphene has been given more attention by researchers before GO,7-9 the GO has lately emerged as a new carbon based nanoscale material that provides an alternative path to graphene. The 2D GO is also a single atomic layered material made of oxidizing graphite crystals which are available in large quantities with low costs.10 The GO has a very similar structure to a graphene sheet with its base having oxygen containing groups such as hydroxyl, carbonyl, carboxylic and epoxy groups. Since these groups possess a high affinity to water molecules i.e. hydrophilic can be easily dissolved in water and may be other solvents, which allows it to be informally deposited on spacious range of substrates to form thin films.11 Several researches have demonstrated the strong antimicrobial properties of GO against a different types of microorganisms, involving Gram-positive and Gram-negative bacterial pathogens, phytopathogens, and biofilm forming microorganisms. The antibacterial activities of graphene, in particular GO, is related to its unique spectral and electrical, mechanical and thermal properties, such as facile surface modification, high mechanical strength, good water dispersibility, and photoluminescence. Owing to these outstanding antibacterial properties, GO has been exploited for biomedical and environmental management applications and successfully used in food package, medical disinfection and water disfection.6,12,13 The application of the prepared GO nanosheets have been studied the antibacterial activity by using well diffusion method and the morphological changes depending on the SEM technique for the two types pathogens E. coli and S. aureus.14 However, this work is deal with the antibacterial application for the above species by using MIC and cell viability analysis by using florescent microscope. The E. coli and S. aureus are the common bacterial forms and the major cause of infectious diseases in humans and animals.15 Therefore, it is important to look for new antibacterial materials as alternative of antibiotics for therapy these bacterial strains.
Experimental Detailas
Synthesis of Graphene Oxide
In the current study, the GO nanosheets have been prepared by a novel way, which is a simplified Hummer’s method. Briefly, 1 g of graphite powder (212 μm mesh) was reacted with 100 ml of a strong oxidant agent high concentrated sulfuric acid (95-97% H2SO4) under constant stirring. Actually, the reaction was continuing for about 3 days to fully oxidize graphite to graphite oxide after adding 3 g of potassium permanganate (99% KMnO4) gradually to the above solution while the solution temperature has been kept less than 20 ºC in order to prevent over heat and explosion. Then, 10 ml of hydrogen peroxide (37% H2O2 (5% v/v)) were added into the suspensionin order to terminate the oxidation process and hence destroying the excess KMnO4. For purification, the suspension was washed by rinsing and centrifugation [Gemmy Industrial Corporation (Taiwan)] with speed 8000 rpm for 20 minutes several times with 1 M of HCl solution to remove the metal ions. Then, it was washed repeatedly with deionized water to remove the acids in the product. Ultrasonic apparatus model (1740QT) supplied by VGT Company (China) has been used for 20 minutes to convert graphite oxide to GO.9 Finally, the GO product was dried at 80 °C in vacuum oven (VO-27) supplied by Hysc Company (Korea), in order to obtain GO as a powder.
Characterizations
Raman spectra of the drop of GO, dried on glass slides samples were recorded by Bruker, Germany at λ=532 nm (second harmonic generation of Nd-Yag laser) of power 1.7 mW. The FTIR spectra of suspension sample have been recorded by using Shimadzu IRAffinity-1 (Japan) spectrophotometer using the wavenumber range of 4000-400 cm-1. These spectra of liquid sample of 0.1 mm thickness were obtained by using NaCl cell. At the same time, the UV-Vis spectra of the suspension samples have been recorded by using Schimadzu (S. Korea) model (DZ47-63) spectrophotometer, 220-240 V AC, 50-60 Hz. Quartz cell of dimension (1x1x4.5) cm has been used for UV-Vis measurements.
Antibacterial Activity Tests
Microorganisms and Required Materials
An E. coli isolates has been supplied by the (medical microbiology laboratory, branch of biotechnology, department of Applied Science, University of Technology, Baghdad – IRAQ) and S. aureus has been provided by Nanotechnology Center (Microbiological Laboratory, University of Technology, Baghdad – IRAQ).
The used materials for antibacterial activities of GO were nutrient broth has been supplied by Himedia, India. Resazurin has been supplied by Himedia, India. Acridine orange (AO) and Ethidium bromide (EtBr) have been supplied by Sigma Aldrich, USA.
Experimental Techniques
MIC and cell viability analysis by using fluorescent microscope were tested for antibacterial activity of GO nanosheets.
Determination of Minimum Inhibitory Concentrations
The MIC of different GO nanosheets concentrations has been evaluated by using microplate bioassay. 96-wells plate was prepared by placing 100 μl of nutrient broth (1.3 g in 100 ml of distilled water (D.W.) has been prepared in universal tube and sterilized) inoculated with the bacteria into each well. A 100 μl aliquot of each concentration of GO nanosheets were added into the wells. Various concentrations of GO nanosheets were used in this experiment ranging from 1000 μg/ml to 1.95 μg/ml in the wells. Plate was covered and incubated for 24 h in ambient air at 37 °C. The antibacterial activities were confirmed employing colorimetric method by the addition of 20 μl of resazurin to each well. The MIC was defined as the lowest concentration at which an antimicrobial agent will inhibit the growth of a microorganism. The determination of the MIC for each isolate was achieved in triplicate, and the results were taken when there was an agreement in at least two of the three MIC results. The controls of experiments were performed with bacteria in the medium as control positive and medium without bacteria as control negative.
Cell Viability Analysis
Fluorescent microscope has been used to test the antibacterial action of GO nanosheets on E.coli and S. aureus. For discrimination of live from dead cells on the basis of membrane integrity, AO with green fluorescence has been used to stain viable cell whereas EtBr with red fluorescence has been employed to stain dead cells. Briefly, 20 μl of bacteria after and before GO nanaosheets treatment were placed in Eppendorf tube and centrifuged for 10 min at 3000 rpm and washing with phosphate buffer saline (PBS) three times. 5 μl of AO/EtBr were added and left for 5 min, and then a thin smear of treated bacteria has been spread on a glass slide and has been examined under Fluorescent microscope immediately.
Results and Discussion
Raman Analysis
Raman spectroscopy is a high speed and convenient nondestructive technique that is widely employed to get structural information about carbon based materials. The major features in the Raman spectra of graphitic carbon based materials are shown in figure (1). The fundamental bands arising from the stretching vibrations of C-O, and C=O which are centered at 1354.5 and 1598.5 cm-1, respectively. However, the bands centered at 2686.5 and 2882.5 cm-1 are assigned as the first overtone (2ύC-O) of the fundamental band and the combination band (ύC-O + ύC=O), respectively. The intensity of the ύC-O band (1354.5 cm-1) compared with the intensity of the ύC=O band (1598.5 cm-1) could be used to determine the crystallite size (La) of GO nanosheets material from the following equation16;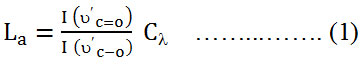
where
Cλ the pre-factor for 514.5 nm laser, which is equal to 4.4 nm. However, this pre-factor has been calculated to be 4.55 nm for 532 nm laser. The ratio of I (ύC=O) /I (ύC-O) of GO is equal to 0.82. By applying equation (1), the crystallite size is found to be 3.7 nm.
The number of layers, also, could be calculated from Raman band intensities, especially from the ratio of I (ύC=O) /I (2ύC-O). It has been found that the ratio of I (ύC=O) /I (2ύC-O) of GO is about 5. The intensities of the ύC=O, ύC-O, and 2ύC-O bands were estimated by fitting the intensities of the Raman bands of figure (1).
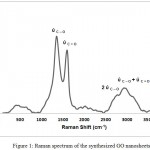 |
Figure 1: Raman spectrum of the synthesized GO nanosheets. |
The Fourier Transform – Infrared Spectrum
As illustrated in figure (2) of FTIR transmittance spectrum of the synthesized GO, the peak at 1092 and 1036 cm-1 are due to the symmetric and asymmetric stretching vibrations of C-O respectively. The characteristics peak, belonging to the C=O of the carboxylic group of the GO, is observed at 1570 cm-1, while the characteristics peak of, C=C of the aromatic cyclic, is centered at 1800 cm-1. It should be noted that the stretching vibration of C-O has not appeared in IR spectrum because this vibration does not show a change in dipole moment, although it shows a change in polarizability tensor.17 Moreover, the spectrum of GO suspension shows two peaks around 2396 and 2336 cm-1 are due to symmetric and asymmetric stretching vibrations of H-C-Hgroup respectively. However peaks centered at 2936 and 2876 cm-1 are corresponding to symmetric and asymmetric stretching of C-H vibrations respectively. These two last vibrations are related and represent an indication of the existence of epoxide group. The absorption peak in the range of 3300–3500 cm-1 is due to the O-H stretching vibration of the water arising from hydroxyl groups. Therefore, the presence of these vibration bands verified the successful attachment of functional groups (hydroxyl, carbonyl, epoxide, and carboxyl).
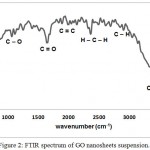 |
Figure 2: FTIR spectrum of GO nanosheets suspension. |
The Ultraviolet-Visible Spectra
The UV-Vis absorption spectrum of GO suspension nano sheets is shown in figure (3). The main absorption peak at 232 nm is attributed to the π→π* transition of aromatic C=C bond. There is some height at 325 nm due to the grating change of the UV-visible instrument, while the shoulder at about 650 nm has been assigned to the n→π* transitions (an excitation of one of anti-bounded electrons to overlap the excited multi bounded).
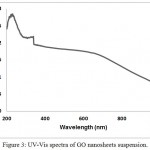 |
Figure 3: UV-Vis spectra of GO nanosheets suspension. |
Minimum Inhibitory Concentration
The antimicrobial properties of GO nanosheets were investigated against Gram-negative and Gram-positive bacteria. The MIC values for two bacterial strains are shown as follow. The obtained results of MICs show that two species of bacteria were susceptible to the GO nanosheets in the concentration ranges of 1000 μg/ml – 1.95 μg/ml. The MIC of GO nanosheets on E. coli at concentration 125 μg/ml that the color of resazurin begins to alter into pink color due to the activity of bacteria, whereas the MIC for S. aureus was at 62.5 μg/ml as shown in figure (4).
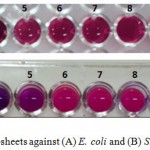 |
Figure 4: The MICs of GO nanosheets against (A) E. coli and (B) S. aureus. |
(1) 1000 μg.ml-1 (2) 500 μg.ml-1 (3) 250 μg.ml-1 (4) 125 μg.ml-1 (5) 62.5 μg.ml-1 (6) 31.25 μg.ml-1 (7) 15.625 μg.ml-1 (8) 7.8125 μg.ml-1 (9) 3.90625 μg.ml-1 , (10) 1.953125 μg.ml-1 (11) control positive (with bacterial cell) (12) control negative (without bacterial cell).
Cell Viability Analysis
The effect of GO nanosheets on the viability of E.coliand S. aureus strains has been studied by using AO/EtBr staining fluorescent microscope. The results from the dual staining have been suggested that GO nanosheets show high influence on the cell wall membrane of bacterial strains, which means that most of exhibited cell in red color due to the losing of membrane integrity and react with damage nucleic acid as illustrated in figure (5).
In this process, the cell membrane appears to be a primary target of the cytotoxicity of GO nanosheets. Membrane damage in GO nanosheets exposed bacteria was identified by morphological changes in the cell structure, leakage of nucleic acid and intracellular electrolytes, uptake of membrane-impermeable dyes, and changes in the transmembrane potential.
Membrane damage may be caused by the atomically sharp edges of graphene, which could penetrate the cell membrane and physically disrupt its integrity. Membrane damage may also be mediated via lipid peroxidation induced by the oxidative nature of GO nanosheets. Oxidative stress was proposed to be a major component of the antimicrobial activity for bacterial cells exposed to GO [12].
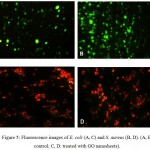 |
Figure 5: Fluorescence images of E. coli (A, C) and S. aureus (B, D). (A, B: control; C, D: treated with GO nanosheets). |
Conclusions
In the current study, the GO nanosheets have been prepared by oxidizing graphite by using novel simplified Hummer’s method successfully and the spectral characterization results emphasize the GO formation.
The grain size and the number of layers of the prepared GO nanosheets calculated from intensities of Raman technique. Furthermore, bands have been assigned to hydroxyl, carbonyl, epoxide, and carboxyl functional groups of GO nanosheets have appeared in the FTIR spectrum. The UV-Vis spectrum of GOnanosheets shows π→π* and n→π* transitions in UV and visible regions respectively.
The antibacterial effect has been tested of the synthesis GO nanosheets against two species of bacterial. The GO nano material exhibits antibacterial properties, and the obtained data allowed to formulate the conclusion that nano-GO may inhibit bacterial growth. MIC has indicated the lowest inhibition concentration for two species of microorganisms. Cell viability in GO–bacterial aggregates was determined by live/dead (AO/EtBr) fluorescent staining. The cell viability analysis has confirmed the damage of nucleic acid, which occurred for two types of bacteria.
From obtained results, one can predict that GO nanosheets will ensure its importance as a potential antibacterial agent in the development of future nanomedicine.
Acknowledgments
The authors would like to thank the Department of Applied Sciences at University of Technology for facilities that it progressed. Also we express our thanks to Assist. Prof. Dr. Majid S. Jabir for his useful help.
Conflict of Interest
The corresponding author states that there is no conflict of interest, financial or otherwise.
References
- Li H.,Chen Q., Zhao J and Urmila K. Enhancing the antimicrobial activity of natural extraction using the synthetic ultrasmall metal nanoparticles. Sci. Rep. 2015;5:1-13.
- Wang Y., Wei H.,Lu Y., Wei S., Wujcik E. K and Guo Z. Multi functional Carbon Nanostructures for Advanced Energy Storage Applications. Nanomaterials. 2015;5:755-777.
- Shahriary L and Athawale A. A. Graphene Oxide Synthesized by using Modified Hummers Approach. Int. J. Renew. Energy Environ. Eng. 2014;2(1):58-63.
- LiQiang C., PingPing H., Li Z., SiZhou H., LingFei L and ChengZhi H. Toxicity of graphene oxide and multi-walled carbon nanotubes against human cells and zebrafish. Sci. China Chem. 2012;55(10):2209–2216.
- Alam S. N., Sharma N and Kumar L. Synthesis of Graphene Oxide (GO) by Modified Hummers Method and Its Thermal Reduction to Obtain Reduced Graphene Oxide (rGO). Scientific Research Publishing. 2017;6:1-18.
- Al-Thani R. F., Patan N. K and Al-Maadeed M. A. Graphene Oxide as Antimicrobial against Two Gram-positive and Two Gram-negative Bacteria in Addition to One Fungus. Online j. biol. sci. 2014;14(3):230-239.
- Javed S. I and Hussain Z. Covalently Functionalized Graphene Oxide – Characterization and Its Electrochemical Performance. Int. J. Electrochem. Sc. 2015;10:9475–9487.
- Gupta R. K., Alahmed Z. A and Yakuphanoglu F. Graphene oxide based low cost battery. Materials Letters (Elsevier). 2013;112:75-77.
- Li J., Zeng X., Ren T and Heide E. v. d. The Preparation of Graphene Oxide and Its Derivatives and Their Application in Bio-Tribological Systems. Lubricants. 2014;2:137-161.
- Bykkam S., Venkateswara R. K., shilpa C. C. H and Thunugunta T. Synthesis and Characterization of Graphene Oxide and its Antimicrobial Activity Against Klebseilla and Staphylococus. Int. J. Adv. Biotechnol. Res. 2013;4(1):142-146.
- Gupta D. K., Rajaura R. S and Sharma K. Synthesis and Characterization of Graphene Oxide Nanoparticles and their Antibacterial Activity. Int. J. Environ. Sci. Technol. 2015;1(1):16-24.
- Franc-ois P., de Faria A. F., Nejati S and Elimelech M. Antimicrobial Properties of Graphene Oxide Nanosheets: Why Size Matters. ACS NANO. 2015;9(7):7226–7236.
- Chen J.,Peng H.,Wang X., Shao F., Yuan Z and Han H. Graphene Oxide Exhibits Broad-spectrum Antimicrobial Activity against Bacterial Phytopathogens and Fungal Conidia by Intertwining and Membrane Perturbation. Nanoscale. 2014;6:1879–1889.
- Ghanim R. R., Mohammad M. R and Hussien A. M. A. Antibacterial Activity and Morphological Characterization of Synthesis Graphene Oxide Nanosheets by Simplified Hummer’s Method. Biosci., Biotech. Res. Asia. 2018;15(3):627-633.
- Bannerman D. D.,Paape M. J.,Lee J. W., Zhao X., Hope J. C and Rainard P. Escherichia coli and Staphylococcus aureus Elicit Differential Innate Immune Responses Following Intramammary Infection. Clin. Diagn. Lab Immunol. 2004;11(3):463-472.
- Wahab H. S., Ali S. H and Hussein A. M. A. Synthesis and Characterization of Graphene by Raman Spectroscopy. J. Mater. Sci. App. 2015;1(3):130-135.
- Herzberg G. Infrared and Raman Spectra. Van Nostrand Reinhold Company, New York. 1945.

This work is licensed under a Creative Commons Attribution 4.0 International License.


