

Manuscript accepted on : 22-Dec-2018
Published online on: 30-12-2018
Plagiarism Check: Yes
Genetic Diversity Analysis of Sorghum (Sorghum Bicolor L. Moench) Genotypes Using Rapd Markers
Sumita Zinzala1, Bharat K. Davda2, K. G. Modha1, Ritesh K. Patel1 and Vipul Baldaniya1
1Department of Genetics and Plant Breeding, N. M. College of Agriculture, Navsari Agricultural University, Navsari-396450, Gujarat, India.
2Main Sorghum Research Station, Navsari Agricultural University, Surat, Gujarat, India.
Corresponding Author E-mail: bharatkdavda@gmail.com
DOI : http://dx.doi.org/10.13005/bbra/2692

ABSTRACT: Genetic diversity among 24 genotypes of sorghum was studied by using 20 random primers. The total number of amplified PCR bands was 591 of which 495 (83.75%) were polymorphic displaying PIC values ranging from 0.27 to 0.69 with an average of 0.52. Similarity coefficients among the genotypes were ranged from 0.33 to 0.89. The similarity coefficient was used to construct a UPGMA based dendrogram using average linkage between groups. The analysis illustrates considerable potential of RAPD markers for estimating genetic diversity among 24 genotypes of sorghum.
KEYWORDS: Cluster Analysis; Dendrogram; Diversity; Molecular Markers; Similarity Coefficient; Sorghum
Download this article as:| Copy the following to cite this article: Zinzala S, Davda B. K, Modha K. G, Patel R. K, Baldaniya V. Genetic Diversity Analysis of Sorghum (Sorghum Bicolor L. Moench) Genotypes Using Rapd Markers. Biosci Biotech Res Asia 2018;15(4). |
| Copy the following to cite this URL: Zinzala S, Davda B. K, Modha K. G, Patel R. K, Baldaniya V. Genetic Diversity Analysis of Sorghum (Sorghum Bicolor L. Moench) Genotypes Using Rapd Markers. Biosci Biotech Res Asia 2018;15(4). Available from: https://www.biotech-asia.org/?p=32629 |
Introduction
Sorghum (Sorghum bicolor L. Moench; Poaceae) is the staple food for millions of poor people in the semi-arid tropics of Africa and Asia and is the fifth most important cereal grain crop. Sorghum is well recognized as a highly productive, drought-tolerant, C4 cereal which provides humans with food, feed, fuel, fiber, and energy. Sorghum evolved across a wide range of environments, due to that it exhibits a wide range of phenotypic and genotypic diversity. Genomic analysis of diverse populations can reveal the extent of genetic diversity and genetic basis of complex traits. The understanding of sorghum genomic diversity can be used for crop improvement. Diverse, trait-specific promising accessions may be used in breeding programs for developing improved sorghum genotypes with a broad genetic base. The various yield attributing characters, viz. panicle width, panicle weight, panicle length, and grain yield per panicle can be typically optimized for agricultural purposes. DNA-based molecular markers are more efficient to analyze genotypic diversity than morphological markers. Among polymerase chain reaction (PCR) based markers, random amplified polymorphic DNA (RAPD) markers are convenient and does not require prior knowledge of the DNA sequence to be amplified1. Thus, the use of RAPD markers for taxonomic and systematic analyses of plants2 as well as in the study of genetic relationships has increased3. There are many advantages of RAPD over other markers are its simplicity, rapidity, requirement for only a small quantity of DNA, and the ability to generate numerous polymorphisms4 with good coverage of the entire genome5. The information obtained through germplasm characterization using RAPD is extensively used for the identification of germplasm, screening of duplicates, assessing genetic diversity and monitoring the genetic stability of conserved germplasm. The aim of this study was to determine the extent of diversity in sorghum genotypes for their best utilization in breeding programs.
Material and Methods
Plant Material
Twenty four distinct genotypes of sorghum shown in the table 1 were used in the current study. Seedlings of genotypes were grown at greenhouse, Department of Genetics and Plant Breeding, NMCA, Navsari in polythene covers and fresh, young leaves of seedlings were collected and stored in deep freezer till DNA extraction.
Table 1: List of 24 sorghum genotypes used in the experiment.
| Sr. No | Name of Genotypes | Sr. No | Name of Genotypes |
| 1 | GJ-36 | 13 | SR-2958 |
| 2 | GJ-41 | 14 | GJ-38 |
| 3 | NIZER GOTI | 15 | SR-2812 |
| 4 | GJ-35 | 16 | SR-2949 |
| 5 | SR-2970 | 17 | SR-2972 |
| 6 | SR-2973 | 18 | SR-2960 |
| 7 | SR-2914 | 19 | GJ-39 |
| 8 | SR-2957 | 20 | SR-2975 |
| 9 | GJ-40 | 21 | ICSR-13008 |
| 10 | SR-2987 | 22 | BP-53 |
| 11 | SURAT LOCAL | 23 | RS-627 |
| 12 | GJ-42 | 24 | SR-2872 |
DNA Extraction
Total genomic DNA was extracted from the 30 days mature leaves by Cetyl Trimethyl Ammonium Bromide (CTAB) method6 with some modifications.
Randomly Amplified Polymorphic DNA (RAPD) Marker
PCR amplification was performed, according to Williams et al. (1990)7 with some modifications.
PCR Components
The PCR were performed in a final volume of 25 µl, consisting of 1x PCR reaction buffer, 1 µl primer, 2 µl dNTP mix, 2.5 µl Taq buffer (10X) with MgCl2, 0.3 µl Taq polymerase, 18.2 µl sterile distilled water and about 1 µl of genomic DNA. The amplifications were carried out using a Thermocycler (BIO-RAD, USA). The amplifications were programmed for 5 min at 94°C for initial denaturation, followed by 45 cycles of 30 sec at 94°C; 30 sec at 36°C for annealing and 2 min at 72°C for extension, using the fastest possible transition times between each temperature. A final extension was programmed for 7 minutes at 72°C followed by halt at 4°C until samples were collected. Amplification products were resolved by in 2% agarose gel run in 1x TAE (10 mM Tris-HC1 and 1 mM EDTA) buffer, pH 8.0 for 2 hr at 80 voltage. The gel was stained with ethidium bromide (10 mg/ml) and DNA fragments were documented by gel documentation system (BIO-RAD, USA). The size of each band was estimated by comparing with the 100 bp DNA size marker. The bands were scored as present (1) or absent (0).
Data Analysis
Pair wise comparison of genotypes, based on the presence (1) or absence (0) of unique and shared band positions, was used to generate Jaccard’s similarity coefficient by NT-SYS-pc version 2.02 software. An UPGMA (Unweighted Pair Group Method with Arithmetic Mean) based dendrogram was generated based on Jaccard’s similarity coefficient using the markers data for all sorghum genotypes. Polymorphism information content (PIC) values were calculated as in Anderson et al. (1993)8. PIC for a locus was calculated as:
PIC = 1- ΣP2ij
Where, Pij is the relative frequency of the jth allele of the ith locus, summed over all the alleles for individual marker locus over all lines. A marker with a PIC value of more than 0.5 was considered as highly informative, between 0.25 and 0.5 as informative and less than 0.25 as slightly informative9. The genetic diversity was estimated by similarity indices calculated from band sharing data of each pair of DNA fingerprints.
Results and Discussion
The genetic diversity among the twenty four sorghum genotypes was studied in an initial screening using twenty RAPD primers presented in table 2. Nine of the twenty primers produced informative, polymorphic products resolvable by agarose gel electrophoresis. Figure 1 shows the PCR products of three RAPD primers namely, OPA-10, OPA-11 and OPA-12. The total number of amplified PCR bands was 591, of which 495 (83.75%) were polymorphic displaying PIC values ranging from 0.27 to 0.69 with an average of 0.52 (Table 3). The number of bands per primer ranged from 29 to 101 with an average of 65.66 bands per primer. The number of bands per primer varied from 16 to 89 with an average of 55 bands per primer. In earlier study, Agrama and Tuinstra (2003)10 reported a moderate level of polymorphism (58.7%) among 22 accessions of sorghum from Ethiopia, China and USA using RAPD markers, whereas, Ayana et al. (2000)11 reported a maximum of 94% polymorphism within the adapted zone (Ethiopia) sorghum cultivars. High level of polymorphism were also shown by RAPD markers in sorghum in earlier studies12,13,14,15,16,17,18,19,20.
Table 2: Total number of bands, polymorphic bands and percentage of polymorphisms using nine RAPD primers in 24 sorghum genotypes.
| Primer | Total number of bands | Number of polymorphic bands | Percentage of polymorphisms | PIC |
| OPA3 | 79 | 79 | 100 | 0.58 |
| OPA4 | 68 | 44 | 64.70 | 0.42 |
| OPA7 | 63 | 63 | 100 | 0.53 |
| OPA8 | 40 | 16 | 40 | 0.69 |
| OPA10 | 58 | 34 | 58.62 | 0.53 |
| OPA11 | 101 | 77 | 76.23 | 0.27 |
| OPA12 | 89 | 89 | 100 | 0.55 |
| OPA13 | 29 | 29 | 100 | 0.50 |
| OPA18 | 64 | 64 | 100 | 0.62 |
| Total | 591 | 495 | 83.75 | – |
| Average | 65.66 | 55 | 83.75 | 0.52 |
A dendrogram based on the similarity coefficient was constructed using UPGMA based cluster analysis which is shown in figure 1. The similarity coefficient among the genotypes ranged from 0.33 to 0.89. The genetic similarity obtained in present study is in agreement with previously reported results i.e., 0.19% to 0.95% reported by Kachapur et al. (2009)18 and 0.36% to 0.92% reported by Iqbal et al. (2010)16, Akram et al. (2011)13, Zhan et al. (2012)20, Khaled et al. (2014)19 and Bafeel (2015)21 while moderate to high genetic similarity was reported by Chauhan et al. (2015)14. It is also evident that genotypes GJ-35 and SR 2987 are the most closely related genotypes with highest similarity index of 0.89, while the genotypes SR 2949 and SR 2872 showed lowest similarity index (0.33) therefore considered as distantly related (Table 3).
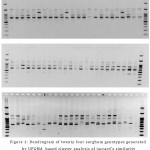 |
Figure 1: Dendrogram of twenty four sorghum genotypes generated by UPGMA based cluster analysis of jaccard’s similarity coefficient using RAPD marker data.
|
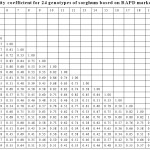 |
Table 3: Jaccard’s similarity coefficient for 24 genotypes of sorghum based on RAPD marker.
|
The phylogenetic tree (dendrogram) categorized twenty four sorghum genotypes into two major clusters (Fig. 2). The first major cluster contained two sub-clusters. Sub cluster I was the largest with 19 genotypes in nine groups followed by cluster II with 4 genotypes in two groups. Group one comprised of GJ-36, GJ-41, GJ-35 and SR 2987 with a genetic similarity of 70 per cent. Group two consisted of SR 2970 and GJ-39 with a genetic similarity of 85 per cent. Group three contained GJ-42 and SR 2812 with a genetic similarity of 82 per cent. Group four comprised genotypes SR 2914, SR 2972 and SR 2960 with a genetic similarity of 76.5 per cent. Group five contained only one genotype SR 2975 with a high genetic similarity of 72.1% to group four. Group six contained only GJ-38 with a genetic similarity of 64.8% to group five. Group seven comprised the genotype NIZER GOTI with a genetic similarity of 62.2% to group six. Group eight consisted of SURAT LOCAL and SR 2958 which had a genetic similarity of 63 per cent. Group nine included three genotypes SR 2973, GJ-40 and SR 2957 with a genetic similarity of 73.5 per cent.
Sub cluster II has four genotypes ICSR 13008, BP 53, RS 627 and SR 2872 with a genetic similarity of 57 per cent. Cluster II comprised only one genotype SR 2949 with a genetic similarity of 49% to cluster I (Fig. 2).
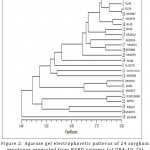 |
Figure 2: Agarose gel electrophoretic patterns of 24 sorghum genotypes generated from RAPD primers (a) OPA-10, (b) OPA-11, (c) OPA-12; M is 100 bp DNA ladder.
|
The data obtained in this study confirmed the efficacy of the RAPD technique as a valuable DNA marker for determination and estimation of genetic diversity among different sorghum genotypes. RAPD analysis showed good potential to determine genetic diversity among 24 genotypes. These genetic distances between sorghum genotypes could help in identification of parents for performing heterotic crosses and acheiving maximum heterosis in hybridization programs. Present study identified polymorphic RAPD markers that can be used to determine the phylogenetic relationships between cultivars. It is speculated that cultivars with the most distinct DNA profiles were likely to contain the greatest number of novel genes.
Refereces
- Weder J. K. P. Influence of experimental conditions on the reproducibility of RAPD-PCR identification of legumes and cereals. Wiss. Technol. 2002;35:233-238.
- Bartish I. V., Garkava L. P., Rumpunen K., Nybom H. Phylogenetic relationship and differentiation among and within population of Chaenomeles Lindl. (Rosaceae) estimated with RAPDs and isozyme. Appl. Genet. 2000;101:554-563.
- Ranade S. A., Farooqui N., Bhattacharya E., Verma A. Gene tagging with random amplified polymorphic DNA (RAPD) marker for molecular breeding in plants. Rev. Plant Sci. 2001;20:251-275.
- Cheng K. T., Chang H. C., Su C. H., Hsu F. L. Identification of dried rhizomes of Coptis species using random amplified polymorphic DNA. Bull. Acad. Sin. 1997;38:241-244.
- Melchinger A. B. Use of RFLP markers for analysis of genetic relationships among breeding materials and prediction of hybrid performance. In International crop science congress I. CSSA, Madison, WI (Ed). D.R. Buxton. 1993;621-628.
- Zidani S., Ferchichi A., Chaieb M. Genomic DNA extraction method from Pearl millet (Pennisetum glaucum) leaves. J. of Biotechnol. 2005;4(8):862-866.
- Williams J. G. K., Kubelik A. R., Livak K. J., Rafalski J. A., Tingey S. V. DNA polymorphisms amplified by arbitrary primers are useful as genetic markers. Nucleic Acids Res. 1990;18:6531-6535.
- Anderson J. A., Churchill G. A., Autrique J. E., Sorells M. E., Tanksley S. D. Optimizing parental selection for genetic linkage maps. Genome. 1993;36:181-186.
- Botstein D., White R. L., Skolnick M., Davis R.W. Construction of a genetic linkage map in man using restriction fragment length polymorphism. American J. Human Genet. 1990;32:314-331.
- Agrama H. A., Tuinstra M. R. Phylogenetic diversity and relationships among sorghum accessions using SSRs and RAPDs. African J. Biotechnol. 2003;2(10):334-340.
- Ayana A., Bekele E., Bryngelsson T. Genetic variation in wild sorghum (Surghum biculur ssp. verticillijlorum (L.) Moench) germplasm from ethiopia assessed by random amplified polymorphic DNA (RAPD). Hereditas. 2000;132:249-254.
- Akhare A. A., Sakhare S. B., Kulwal P. L., Dhumale D. B., Kharkar A. RAPD profile studies in Sorghum for identification of hybrids and their parents. Int J Integr Biol. 2008;3(1):18-24.
- Akram Z., Khan M. M., Shabbir G., Nasir F. Assessment of genetic variability in sorghum genotypes for drought tolerance based on RAPD analysis. Agric. Res. 2011;49(4):455-464.
- Chauhan R., Jasrai1 Y., Mankad1 A., Pandya H., Gami R., Tiwari K. Genetic diversity analysis of six major cereal crops cultivars through RAPD markers. Crop Sci. Tech. 2015;3(4):1-4.
- El-Amin H. K. A., Hamza N. B. Phylogenetic diversity of Sorghum bicolor (L.) Moench accessions from different regions in sudan. J. Biochem. Mol. Biol. 2013;127-134.
- Iqbal A., Sadia B., Khan A. I., Awan F. S., Kainth R. A., Sadaqat H. A. Biodiversity in the sorghum (Sorghum bicolor Moench) germplasm of Pakistan. Genet. Mol. Res. 2010;9(2):756-764.
- Jeya Prakash B. K. R., Gomez S. M., Murthy K. G., Chandra R. Genetic diversity analysis of sorghum (Sorghum bicolor Moench) accessions using RAPD markers. Indian J. Crop Sci. 2006;1(1-2):109-112.
- Kachapur R. M., Salimath P. M., Reddy B. V. S. Genetic diversity within sweet sorghum [Sorghum bicolor (L.) Monech] Accessions as revealed by RAPD Markers. Maharashtra organic.uni. 2009;34(1):038-042.
- Khaled A. G. A., Tag El-Din A. A., Hussein E. M. Correlation, path analysis and RAPD markers in sorghum (Sorghum bicolor (L.) Moench) genotypes. Assiut J. Agric. Sci. 2014;45(4):15-28.
- Zhan Q., Zhou L., Bi N., Wu H., Li J., Lu J., Lu J., Lin P. A Comprehensive analysis of genetic diversity and relationships of 13 sweet sorghum varieties as energy sources. Sustainable Bioenergy Systems. 2012;2:86-91.
- Bafeel S. O. Genetic diversity among different physiological traits of Sorghum bicolor cultivars of subtropical origin. Genet. Mol. Res. 2015;14(3):9974-9984.

This work is licensed under a Creative Commons Attribution 4.0 International License.


