

Manuscript accepted on : 07-Dec-2018
Published online on: 24-12-2018
Plagiarism Check: Yes
Luisa Mancuso1, Cristina Manis2, Antonio Murgia2, Michela Isola3, Andrea Salis4, Federica Piras5, Pierluigi Caboni2 and Giacomo Cao1
1Department of Mechanical, Chemical and Materials Engineering, University of Cagliari, Piazza d'Armi, Cagliari, Italy.
2Department of Life and Environmental Sciences, University of Cagliari, Via Ospedale, 72, Cagliari, Italy.
3Department of Biomedical Sciences, University Citadel of Monserrato - University of Cagliari, S.S. 554 - Bivio for Sestu, 09042-Monserrato-Cagliari- Italy.
4Department of Chemical and Geological Sciences, University Citadel of Monserrato - University of Cagliari -CSGI and CNBS, S.S. 554 - Bivio for Sestu, 09042-Monserrato-Cagliari- Italy.
5P.O. Armando Businco. Servizio di diagnistica citofluorimetrica e trattamento delle cellule staminali. SC Ematologia e Centro Trapianti Midollo Osseo; Via Edward Jenner 09121 Cagliari.
Corresponding Author E-mail: luisa_mancuso@yahoo.it
DOI : http://dx.doi.org/10.13005/bbra/2684

ABSTRACT: Despite the growing interest in nanoparticles (NPs), the evaluation of their safety use has to be deeply considered, but standardized procedures for the evaluation of their toxicity have not been defined. In vitro methods are ideal in toxicology research because they can rapidly provide reproducible results while preventing the use of animals. Primary cells are considered a better option as model systems for predicting toxicological behavior, although several cell types do not survive enough in culture and isolated cells can have substantial variability when obtained from different donors. Recently, a new test for acute toxicity based on the use of human bone marrow mesenchymal stem cells (hBMMSCs) has been developed and successfully tested in our laboratory following the ICCVAM (Interagency Coordinating Committee on the Validation of Alternative Methods) guidelines [1]. Along these lines, the aim of this study is to evaluate the acute cytotoxicity of ZnO nanoparticles using the new toxicity test based on hBMMSCs, while comparing their behavior with respect to the toxicity of ZnO micrometer ones. For this reason, we assessed the citotoxicity by performing Neutral Red assay, the cellular uptake by transmission electron microscopy and the effects on hBMMSCs cycle by FACS analysis. Furthermore, we also analyzed by means of GC-MS the polar metabolite profile of hBMMSCs samples treated with ZnO micro- and nanoparticles. Our results show that despite the slight differences in terms of cytotoxicity, nano and microparticles show a very different behavior with respect to their effects on hBMMSCs cycle, metabolite profile and cellular uptake.
KEYWORDS: Acute Toxicity; Cell Cycle; Human Mesenchymal Stem Cell; Metabolomic; Zinc Oxide Nanoparticles
Download this article as:| Copy the following to cite this article: Mancuso L, Manis C, Murgia A, Isola M, Salis A, Piras F, Caboni P, Cao G. Effect of Zno Nanoparticles on Human Bone Marrow Mesenchymal Stem Cells: Viability, Morphology, Particles Uptake, Cell Cycle and Metabolites. Biosci Biotech Res Asia 2018;15(4). |
| Copy the following to cite this URL: Mancuso L, Manis C, Murgia A, Isola M, Salis A, Piras F, Caboni P, Cao G. Effect of Zno Nanoparticles on Human Bone Marrow Mesenchymal Stem Cells: Viability, Morphology, Particles Uptake, Cell Cycle and Metabolites. Biosci Biotech Res Asia 2018;15(4). Available from: https://www.biotech-asia.org/?p=32144 |
Introduction
Nowadays, the nanotechnology factory is providing a strong impact to the worldwide with industrial evolution.2 Nanomaterials, shaped with a size spans range from 1 to 100 nm of nanoparticles (NPs),3 are used in manufacturing tires, stain-resistant clothes, cosmetics, electronics and mostly as diagnostic, imaging, and drug delivery tools in medicine.4 However, the evaluation of the safety use of these materials has to be deeply considered, due to their specific interaction properties with proteins, DNA, lipids, membranes, organelles, cells, tissues, and biological fluids. Thanks to the great success of NPs, their exposure is daily raising, thus aggravating health concerns NPs can be inhaled, absorbed through the skin or injected, and their metabolism inside the body has not yet been clarified. Recently, several work reported the NPs tendency to show toxic effects on various cells and organs.5,6
Zinc oxide (ZnO) is a metal oxide used in nanomaterial formulations thanks to its photocatalytic and photo-oxidizing ability against chemical and biological species.7 ZnO represents one of the most suitable material for nanoscale optoelectronics and piezoelectric nanogenerators thanks to the ability to generate a wide range of nanostructures.8 In April 2017, ZnO, together with four zinc compounds, has been recognized as safe by Food and Drug Administration (21CFR182.8991) and is still used for the treatment of zinc deficiency and as an antibacterial.9 On the other hand, ZnO nanoparticles have been recently associated with the T cells toxicity of a human neuroblastoma, while no cytotoxic effect on normal cells was found.10,11 Furthermore, in vitro studies have demonstrated that ZnO-NPs show greater adverse effects when compared to normal-scale particles.12 However, only a few studies have reported the effect of ZnO-NPs on human cells while their results seem to be conflicting. For example DeLouise13 and Meyer et al.14 reported that ZnO-NPs were nontoxic for cultured human dermal fibroblasts and toxic, respectively.
It is then apparent that biocompatible dispersion protocols and better understandings for the mechanism of specific cytotoxicity need to be resolved on the way to translate ZnO nanoparticles into medical use. Up to now, the experimental approaches proposed are quite diverse, thus making the corresponding comparison very difficult. Consequently, reliable toxicity test systems are strongly required.15
In vitro toxicology methods are useful for screening toxicity to provide reproducible results in a short time without distressful animal testing.16 In addition, in vitro to human in vivo translation is not always possible. On the other hand, in vitro tests are carried out with transformed, immortalized cell lines or primary cells readily available, easily maintained and keen to provide sufficient information to establish reproducible in vitro models. Indeed, primary cells are considered a better option as model systems for predicting toxicological behavior, although several cell types do not survive enough in culture and isolated cells can have substantial variability when obtained from different donors. In our previous work,17 CuO nano and microparticles toxicity has been evaluated using human bone marrow mesenchymal stem cells (hBMMSCs) due to their ability to differentiate into a variety of cell types and develop into organ systems. This ability may allow a replacement of transformed cell lines and primary cells for in vitro studies, thus eliminating potential limitations and improving the relevance of predictive assays.
For this reason, in the present study, we have investigated the effects of ZnO-NPs on human bone marrow mesenchymal stem cells, while comparing their behavior with respect to the toxicity of ZnO micrometer particles. For this reason, we assessed the citotoxicity by performing Neutral Red assay, the cellular uptake by transmission electron microscopy and the effects on hBMMSCs cycle by FACS analysis.
Furthermore, the metabolic pathways of a cell system can be easily studied coupling the vitro models with biochemical tools. In this context, metabolomics, a science based on the use of different hyphenated analytical techniques, i.e. mass spectrometry18 as well as nuclear magnetic resonance spectroscopy (NMR) to explore the profile of different biological matrices, represents a valuable approach to understand the toxicity mechanism in cell experiments. These techniques are often associated to a multivariate statistical analysis with the aim to extract useful information from complex models19,20 and thus understanding mechanism of action. In our previous work we used a GC–MS based method to study the toxicity of human bone marrow mesenchymal stem cell after the exposure to copper oxide, thus indicating a new approach to investigate the toxicity of micro and nanoparticles.21 In this work, along the same metabolomic approach, we also analyzed by means of GC-MS the polar metabolite profile of human bone marrow mesenchymal stem cell samples treated with ZnO micro- and nanoparticles.
Materials and Methods
Isolation of hBMMSCs
Samples of bone marrow consisting of 1.5 ml of aspirate were taken from the iliac crest of two human donors (a 28-year-old man and a 55-year-old woman) after obtaining informed consent. Samples were diluted with an equal volume of phosphate-buffered saline (PBS). Mononuclear cells were isolated using a Ficoll-Paque density gradient centrifugation (Hystopaque 1077, 30 min, 800 x g), as previously reported.1 Cells were used after two weeks expansion at passage 6. Chemicals were obtained from Sigma Aldrich (St. Louis, MO, USA).
Phenotypic characterization of stem cell cultures
Cells were harvested using 0.1% trypsin and 0.04% EDTA and fixed with 4% paraformaldehyde for 20 min, then washed with PBS, and resuspended with PBS containing 0.1% bovine serum albumin. Cells were characterized by flow cytometry as previously described.1
ZnO particles and their characterization
Two categories of Zinc oxide were tested. ZnO microparticles (< 5mm, purity 99,9%) and ZnO nanoparticles (< 50 nm, purity > 97%) were obtained from Sigma Aldrich (Cat. no. 205532 and Cat. no. 677450, respectively). Stock solutions at the concentration of 300 μg/ml were prepared in culture medium without supplements by sonication for 2 hours. To achieve the different concentration used in this study, the stock suspensions were diluted in complete culture medium supplemented with 5% fetal bovine serum, 1% penicillin/streptomycin and 2 mM L-glutamine before cell incubation. The particle size was analyzed using transmission electron microscopy (JEOL TEM-100S operating at 80–100 kV). A drop of stock suspension (30 µl) containing the particles was deposited on the TEM grids once covered by a 80–90 nm slice of EPON resin (Glycide Ether 100, Merk, Darmstadt Germany) in order to avoid the loss of particles through the mesh grids, and dried overnight at room temperature. TEM images were used to calculate the approximate particle size, by taking advantage of NIH ImageJ software (http://rsbweb.nih.gov/ij/download.htm). Data were collected by Microsoft Excel 2007 software.
Determination of the size and the ζ-potential of ZnO particles
The hydrodynamic diameter (size) and the z-potential of ZnO particles were determined by DLS (dynamic light scattering) and the ELS (electrophoretic light scattering) techniques, respectively, using a Malvern Zetasizer Nano ZSP. Before measurements, a mass of 1 mg of ZnO particles was suspended in 10 ml of either filtered (0.2 mm polypropylene filter, Whatman) milliQ water or the cell culture medium (aMEM, Sigma Aldrich ) and left in a ultrasonic bath for two hours.
DLS measurements. A volume of about 1.5 ml of the particle suspension was transferred into a clean square polystyrene cuvette (67–754, Sarstedt) which was inserted in the instrument. Once the sample was equilibrated at the temperature of 25°C for 120 s, 3-5 measurements were carried out (about 20 runs for each measurement).
ELS measurements. ζ-potential measurements were performed in a folded capillary cell (DTS 1061, Malvern Instruments Ltd, Worcestershire, UK), rinsed with 2-propanol and H2O before adding the particle suspension. A number of 3-5 measurements were carried out (up to 100 runs for each measurement) for each sample. For calculation of the z-potential from the initially acquired electrophoretic mobility, the Smoluchowski approximation (f(ka) = 1.5) was used.
Physical parameters. The evaluation of the size distribution and of the z-potential requires the knowledge of some physical parameters – that is, the refractive index (n), the viscosity (η), the dielectric constant (εr) – of both the dispersant medium and the particles. For the cell culture medium aMEM, supplemented with 5% FBS, the following values were used: n = 1.332, η [cP] = 0.8605, εr = 78.5. For distilled water n= 1.330, η [cP] = 0.8872, εr = 78.5 were used. For ZnO particles n = 2.58 22 and an approximated absorption coefficient = 0.922 were used.
hBMMSCs culture and treatment
hBMMSCs were seeded in 96-well microtiter plates at the concentration of 4.5×10³ cells/100µl/well in aMEM culture medium (supplemented with 20% FBS, 1% penicillin/streptomycin and 2 mM L-glutamine, Sigma), and then incubated (37°C / 5% CO2) for 24 h, to assure either adequate cell recovery and adherence. Then, cells were treated with 8 concentration levels of ZnO micro and nanoparticles (ranging from 26.1 to 100 μg/ml ). Their viability was evaluated by considering the Neutral Red Uptake as previously reported.17
Cellular uptake and morphology by Transmission Electron Microscopy
hBMMSCs were incubated with ZnO nano and microparticles concentrations corresponding to IC50 for 48h. Subsequently cells were trypsinized and centrifugated for 5 minutes at 800xg. The resulting pellets of control and treated cells were then prepared for electron microscopy observation. They were fixed in a mixture of glutaraldehyde 1.25% and paraformaldehyde 1% in cacodylate buffer 0.15 M (pH 7.2) for 2 h at room temperature. Then, the samples were post fixed with osmium 2% for 1 h, dehydrated, and embedded in Epoxy resin (Glycide Ether 100, Merk, Darmstadt, Germany). Semithin sections (2 µm), stained with Toluidine blue, were examined by light microscopy a Leica DMR HC, to check histological appearance. Ultrathin sections (90 nm) were observed and randomly photographed by a JEOL 100S TEM operated at 80 kV.
Cell cycle analysis
Cell cycle analysis was performed using the Click-iT EdU Alexa Fluor 488 kit (Invitrogen) according to manufacturer instructions. Briefly, hBMMSCs were incubated with the ZnO nano and microparticles concentrations corresponding to IC50 for 48h. Subsequently cells were exposed to EdU (10mm) for 45 minutes, so that their DNA incorporates 5-ethynyl-2′-deoxyuridine (EdU) nucleoside analog. At the end of incubation, cells were trypsinized, permeabilized, stained and then analyzed by citofluorimeter (BD FACSCalibur, BD Biosciences, Franklin Lakes, NJ, USA).
Sample extraction and derivatization
Sixty-three samples were obtained from treated cells at the corresponding IC50. Samples were divided into three classes: 12 samples from cells treated with nanoparticles, 12 samples treated with microparticles and lastly 8 samples per plate served as controls.
One-hundred µl of a solution (methanol:chloroform 9:1 v/v) were added to each well. Plates were then sonicated for 10 min. The content of the well was placed into an Eppendorf tube and 160 µl of methanol and 115 µl of chloroform were added. After 1 h, 380 µl of chloroform and 90 µl of potassium chloride 0.2 M were added. The solution was centrifuged at 12000 rpm for 10 min and the aqueous layer was transferred into a glass vial and dried. Samples were derivatizated using 50 μl of methoxamine hydrochloride prepared in pyridine at the concentration of 10 mg/ml. After 17 h, 50 µl of N-Methyl-N-(trimethylsilyl) trifluoroacetamide were added and 1 h later samples were re-suspended with 50 µL of hexane containing 2,2,3,3-d4-succinic acid at 5 mg/L. All chemicals were obtained from Sigma Aldrich (Milano, Italy).
GC-MS analysis
A 6850 gas-chromatograph coupled with a 5973 Network mass spectrometer (Agilent Technologies, Santa Clara, CA, USA) was used for the sample analysis. The volume injection was of 1 µl in the splitless mode. The injector temperature was set at 200°C. The gas flow rate was 1 ml/min. The column was a DB5-MS (0.25 μm, 30 m × 0.25 mm) (J&W scientific, Folsom, CA, USA). Initially, the oven temperature was set at 50°C and hold for 10 min. Then, it was increased to 300 at 10°C/min and hold at 300°C for 10 min. Ions were recorded at 1.6 scan/sec in the mass range m/z 50-550. Raw data files were exported into the Automatic Mass spectral Deconvolution and Identification System (AMDIS 2.1) for spectral deconvolution (Halket et al., 1999) and database search against the NIST Mass Spectral Database (2.0 a) and Golm and Fiehn metabolome database (Kopka et al., 2004). Confirmation of sample components was performed by: (a) comparison of their relative retention times and mass fragmentation with those of pure standards; and (b) computer matching against NIST, as well as retention indices as calculated according to Kovats, for alkanes C9-C36 (Table 1).
Table 1: DLS (size and polydispersity index) and ELS (z-potential) measurements of ZnO particles in water and culture medium.
| MilliQ water | Culture medium | |||
| sample | dH (nm) | z (mV) | dH (nm) | z (mV) |
| nanoP | 69±1 | -21.1±0.7 | 5.6±0.3 | -9.2±0.9 |
| microP | 498±33 | -22.2±0.3 | 5.7±0.6 | -8.8±0.9 |
Multivariate statistical data analysis and visualization tools
Through the processing of chromatograms and relatives mass spectra samples a X matrix (64 X 72) composed of sixty-four samples and seventy-two chromatographic peak areas. Matrix was at first normalized using the total sum of 100 and later mean centered and unit variance scaled. Principal Component Analysis (PCA), Partial Least Squares-Discriminant Analysis (PLS-DA) and, in the case of a diagonal separation, its orthogonal extension (OPLS-DA) were performed using SIMCA-P software. The prediction power of the PLS-DA models and the optimum number of principal components were verified based on the cumulative parameters i.e. classification power (R2Y) and the prediction power calculated in cross validation (Q2Y) and with a permutation test performed with 400 permutations. Combination of three analysis was used to identify the most discriminant metabolites. From the PLS-DA, the variable importance in the project (VIP) and the coefficient analysis were used to provide, respectively, the contribution of the components to the separation of sample groups and the expression of how strongly the variable class is correlated to the systematic part of each of the metabolites. Further, theses analyses were compared with the S-plot from the OPLS-DA that combines the modelled covariance and correlation in a scatter plot.23 The statistical significance of discriminating metabolites was verified by a Mann-Whitney U test taking in consideration only the metabolites with a resulting p<0.05.
Results
Phenotypic characterization of human bone marrow stem cells is considered first. Cells at 6th passage resulted to be negative for CD34 and CD45, and positive for CD44, CD105, CD90 and CD73 (data not shown). Based on these results, the adopted human bone marrow stem cells displayed a mesenchymal phenotype. Before evaluating the effect of ZnO particles, their approximate size was analyzed by TEM to confirm the manufacturer’s specifications. After 370 measurements in random fields of TEM view, the ZnO micro particles display a major diameter of 300± 9 nm and a minor diameter of 187±6 nm, while the ZnO nano particles display a major diameter of 110±4 nm and a minor diameter of 67±8 nm, as it may be seen from figure 1A and 1B, respectively.
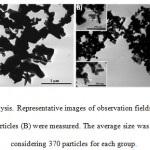 |
Figure 1: TEM analysis. Representative images of observation fields where ZnO micro (A) and nanoparticles (B) were measured. |
The average size was determined by considering 370 particles for each group.
To also define particle characteristics under cell culture conditions, the hydrodynamic diameter (dH) and z-potential were determined after suspending ZnO NPs in ultrapure milliQ water, and aMEM/FBS. As shown in Table 1, the size distribution in milliQ water was centered around the hydrodynamic diameter of 69 ± 1 nm and 498 ± 33 nm for ZnO nanoparticles and microparticles, respectively. There is hence an optimal agreement as for size values of ZnO NP obtained through TEM and DLS analysis. The larger size observed for ZnO microparticles with DLS as compared to TEM is likely due to the formation of small aggregates once particles are dispersed in aqueous solution. Another useful parameter for particles characterization in aqueous systems is the zeta potential (z), whose values measured in milliQ water were equal to −21.1±0.7 mV and −22.2±0.3 mV for ZnO nanoparticles and microparticles, respectively. Similar values (z = -15 mV) were found by Ali et al.,24 Rather than in pure water, more significant z values are those ones measured in the cell culture medium. It has been shown that once nanoparticles interact with the biological medium components protein molecules can be adsorbed thus forming a so called ‘protein corona’. This has the effect to deeply modify the surface composition and hence the behavior of the nanoparticles with respect to what is observed in pure water. Indeed, z and size (dH) measurements of ZnO nano- and micro-particles carried out in the cell culture medium showed very different values. The low values of dH (about 6 nm) and of z (about 9 mV) observed for both nano- and microparticles are not due to the particles but rather to the components of the cell medium. It is likely that is such medium the high electrolyte concentration results in the precipitation of the particles.
To assess the cytotoxicity of Zinc oxide nano and microparticles, hBMMSCs were exposed to eight different concentration (ranging from 26.1 to 100 μg/ml) of ZnO micro or nanopowders for 48 hours. These concentrations were chosen by performing a Range Finder Test, as required by ICCVAM Test Method Evaluation Report.25
The results reported in Figure 2 show that ZnO NPs are slightly more toxic as compared to micrometers ones. Indeed, the IC50 values calculated were equal to 58.02 ± 3.15 μg/ml and 67.09 ± 5.26 μg/ml for nano and microparticles, respectively.
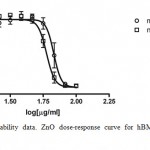 |
Figure 2: Cell viability data. ZnO dose-response curve for hBMMSCs after 48hr exposure.
|
The open circles represent ZnO microparticles data; the open squares represent ZnO nanoparticles ones. Points and error bars show the means ± SD, for the percent cell viability response of the 4 replicate wells at each of the 8 concentrations.
Results concerning cellular uptake and morphology after treatment are shown in Figure 3. The hBMMSCs used as controls (Fig. 3A) exhibited an ovaildal shape morphology with abundant cytoplasm and large and poli-lobated nuclei (N). The plasmalemma showed microvilli-like structures (m), thus implying that these cells might have stronger adhesive properties. Mitochondria (M), Golgi apparatus (G), rough endoplasmic reticulum, vesicles (V) and granules (G) were well represented, indicating that the cells were undergoing active metabolism and a strong secretory capacity. The morphology of cells treated with microparticles appeared unchanged with respect to controls (Fig. 3B). No micro-particles were observed inside the cells. On the other hand, cells treated with ZnO-NPs (Fig. 3C) exhibited more dilated vesicles (V) often associated with the nanoparticles (Fig. 3D). Nanoparticles were also observed in the nucleus (Fig. 3E). Furthermore, at the mere observation, in these cells the microvilli-like structures (m) and the vesicles appeared increased in number and size.
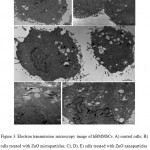 |
Figure 3: Electron transmission microscopy image of hBMMSCs. A) control cells; B) cells treated with ZnO microparticles; C), D), E) cells treated with ZnO nanoparticles. N) nucleus, M) mitochondria, G) Golgi apparatus, V) vesicles, m) microvilli-like structures. |
Despite the slight differences in terms of cytotoxicity, nano and microparticles show a very different behavior with respect to their effects on hBMMSCs cycle. As shown in Figure 4, control cells contain 12.8% of cell in S-phase, 68.2% in G0-G1-phases, and 5.8% in G2-M. On the other hand, the exposure to ZnO NPs caused a significant accumulation of the cells in S phase (75.1%), along with a decrease in the corresponding G0-G1 population (13.6%), while cell population presence in G2-M phase was not detected (0%). On the contrary, the exposure to microparticles caused an increment of cell population in G0-G1 phase (78.4%), with a little decrease on cell population in S (5.7%) and no variation in G2-M phases (5.7%).
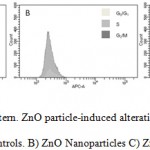 |
Figure 4: Cell cycle pattern. ZnO particle-induced alterations in the cell cycle of hBMMSCs. A) Controls. B) ZnO Nanoparticles C) ZnO microparticles. |
Compared with other analytical tools, GC-MS and LC-MS are considered with NMR as the most efficient, sensitive, and reliable for metabolomics studies. Moreover, GC-MS is able to provide reproducible molecular fragmentation patterns, thus making it an integral tool for metabolite identification. GC-MS hyphenated technique can be easily used in metabolomics research studies for the ability of the identification and quantification of the metabolites involved in the central pathways of cells metabolism such as mono and di-saccharides, amino acids, sugar alcohols, organic acids and amines.26 Samples resulting from the relative extraction and derivatization steps, described in the previous section, were analyzed by GC-MS. After samples mass spectra deconvolution, it has been possible to successfully identify 68 low molecular weight metabolites based on their spectral fingerprints and to confirm them with authentic standard and retention index matches. Representative chromatograms of human bone marrow mesenchymal stem cells treated with ZnO nanoparticles and microparticles compared to controls are reported in Figure 5. Measured metabolites were: sugars i.e. fructose, glucose, galactose and structurally correlated compounds, i.e. myo-inositol, sorbitol, disaccharides such as sucrose and lactose; as well as organic acids as lactate, acetate, oxalate, aminomalonate, succinate, glycerate, citrate, pyroglutamic acid and aminoacids such as Ala, Val, Gly, Leu, Ile, Ser, Asn, Gln and Phe. The remaining aminoacids were either absent in our mixtures or not derivatizable. A total of 24 metabolites were not identified as reported in Table 2 and thus were considered unknown.
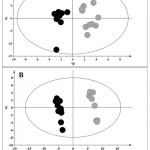 |
Figure 5: A) OPLS-DA of cells treated with ZnO microparticles (black) compared with control samples (grey).
|
Validation parameters were: R2Y=0.9 and Q2Y=0.6. For the permutation test R2X =0.6, and Q2= -0.2. B) OPLS-DA of the ZnO nanoparticles treatment, treated cells (black) vs controls (grey). Validation parameters were: R2Y=0.9 and Q2Y=0.9. For the permutation test R2X=0.4, and Q2=-0.2.
Table 2: GC-MS characteristics of hBMMSCs metabolites. Not identified compounds are reported as U.
| Compound | LRI | target, qualifier ion (m/z) | EI-MS, m/z (amu) (% relative ion abundances) | |||
| lactic acid | 1033 | 147 | 147 (99%) – 117 (59%) – 133 (85%) | |||
| valine | 1047 | 72 | 72 (92%) – 146 (87%) – 156 (56%) | |||
| alanine | 1052 | 116 | 116 (99%) – 147 (27%) – 190 (72%) | |||
| glycine | 1062 | 102 | 102 (99%) -147 (47) – 204 (11%) | |||
| oxalic acid | 1069 | 147 | 147 (99%) – 133 (33%) – 220 (22%) | |||
| U1 | 1076 | 86 | 86 (99%) – 75 (22%) – 188 (75%) | |||
| U2 | 1084 | 86 | 86 (99%) – 75 (22%) – 146 (56%) | |||
| U3 | 1091 | 147 | 147 (99%) – 172 (15%) – 188 (28%) | |||
| urea | 1236 | 147 | 147 (99%) – 189 (65%) – 171 (12%) | |||
| benzoic acid | 1246 | 179 | 179 (99%) – 105 (51%) – 135 (43%) | |||
| serine | 1253 | 116 | 116 (80%) -132 (85%) – 147 (32%) | |||
| isoleucine | 1272 | 158 | 158 (99%) – 147 (42%) – 205 (29%) | |||
| leucine | 1301 | 158 | 158 (99%) – 218 (22%) – 147 (11%) | |||
| succinic acid | 1319 | 147 | 147 (99%) – 75 (23%) – 247 (15%) | |||
| glyceric acid | 1327 | 147 | 147 (77%) – 189 (51%) – 292 (48%) | |||
| U4 | 1331 | 184 | 184 (99%) – 134 (64%) – 285 (51%) | |||
| methylbutyric acid | 1357 | 172 | 172 (61%) – 75 (52%) – 58 (27%) | |||
| threonine | 1366 | 218 | 218 (81%) – 117 (41%) – 291 (35%) | |||
| butanal | 1433 | 188 | 188 (99%) – 144 (92%) – 75 (35%) | |||
| butanol | 1434 | 217 | 217 (76%) – 147 (62%) – 205 (43%) | |||
| aspartic acid | 1443 | 232 | 232 (99%) – 218 (20%) – 147 (18%) | |||
| methionine | 1444 | 176 | 176 (99%) – 128 (37%) – 147 (19%) | |||
| pyroglutamic acid | 1447 | 156 | 156 (99%) – 147 (20%) – 157 (15%) | |||
| U5 | 1451 | 84 | 84 (92%) – 174 (90%) – 147 (70%) | |||
| aminoadipic acid | 1457 | 260 | 260 (99%) – 147 (57%) – 75 (25%) | |||
| thetronic acid | 1459 | 292 | 147 (62%) – 292 (58%) – 220 (27%) | |||
| U6 | 1468 | 202 | 202 (99%) – 158 (87%) – 75 (33%) | |||
| U7 | 1475 | 142 | 142 (99%) – 186 (95%) – 147 (27%) | |||
| heptanedioic acid | 1481 | 274 | 274 (99%) – 147 (42%) – 376 (13%) | |||
| glutamine | 1490 | 246 | 246 (99%) – 128 (20%) – 147 (18%) | |||
| phenylalanine | 1495 | 218 | 218 (99%) – 192 (70%) – 147 (17%) | |||
| U8 | 1599 | 117 | 117 (60%) – 147 (43%) – 335 (31%) | |||
| U9 | 1607 | 246 | 246 (54%) – 75 (43%) – 103 (31%) | |||
| asparagine | 1615 | 116 | 116 (71%) – 231 (65%) – 132 (36%) | |||
| U10 | 1516 | 320 | 147 (67%) – 320 (60%) – 422 (30%) | |||
| U11 | 1643 | 147 | 147 (71%) – 227 (59%) – 155 (40%) | |||
| ribonic acid | 1654 | 217 | 217 (52%) – 75 (40%) – 147 (35%) | |||
| ketogluconic acid | 1657 | 292 | 292 (58%) – 217 (43%) – 103 (24%) | |||
| U12 | 1680 | 217 | 217 (99%) – 437 (31%) – 147 (30%) | |||
| U13 | 1683 | 204 | 204 (99%) – 147 (41%) – 437 (37%) | |||
| citric acid | 1685 | 142 | 142 (71%) – 147 (46%) – 348 (45%) | |||
| N-acetylglucosamine | 1690 | 157 | 256 (99%) – 157 (95%) – 142 (45%) | |||
| altrose | 1694 | 217 | 217 (51%) – 147 (24%) – 218 (21%) | |||
| U14 | 1697 | 217 | 217 (81%) – 204 (48%) – 147 (35%) | |||
| fructose | 1908 | 217 | 217 (62%) – 103 (65%) – 307 (59%) | |||
| galactose | 1922 | 319 | 319 (97%) – 204 (61%) – 147 (51%) | |||
| glucose | 1926 | 205 | 205 (99%) – 147 (38%) – 179 (29%) | |||
| lysine | 1937 | 174 | 174 (99%) – 317 (87%) – 156 (36%) | |||
| mannitol | 1940 | 319 | 319 (97%) – 205 (63%) – 147 (53%) | |||
| tyrosine | 1947 | 218 | 218 (99%) – 280 (15%) – 100 (5%) | |||
| U15 | 1962 | 204 | 204 (99%) – 191 (50%) – 147 (32%) | |||
| U16 | 1977 | 200 | 200 (76%) – 147 (56%) – 84 (45%) | |||
| U17 | 1985 | 204 | 204 (99%) – 147 (47%) – 217 (32%) | |||
| palmitic acid | 2001 | 313 | 313 (99%) – 117 (70%) – 129 (36%) | |||
| U18 | 2012 | 147 | 147 (72%) – 156 (43%) – 361 (30%) | |||
| n-acetylglutamine | 2016 | 305 | 305 (99%) – 217 (86%) – 147 (64%) | |||
| tryptophan | 2083 | 202 | 202 (99%) – 179 (30%) – 308 (17%) | |||
| U19 | 2088 | 204 | 204 (99%) – 217 (45%) – 147 (35%) | |||
| stearic acid | 2097 | 341 | 341 (99%) – 117 (68%) – 132 (41%) | |||
| U20 | 2104 | 204 | 204 (99%) – 217 (45%) – 147 40%) | |||
| U21 | 2105 | 308 | 204 (99%) – 308 (50%) – 147 (35%) | |||
| U22 | 2155 | 392 | 392 (99%) – 302 (99%) – 147 (99%) | |||
| myristic acid | 2168 | 343 | 343 (66%) – 147 (42%) – 205 (27%) | |||
| U23 | 2177 | 239 | 239 (99%) – 207 (19%) – 357 (11%) | |||
| U24 | 2096 | 359 | 359 (99%) – 374 (50%) – 360 (31%) | |||
| U25 | 2408 | 359 | 359 (99%) – 374 (71%) – 105 (45%) | |||
| 2,3dihydroxhypalmitic acid | 2450 | 371 | 371 (99%) – 147 (26%) – 129 (13%) | |||
| 2,3dihydroxhystearic acid | 2617 | 399 | 399 (99%) – 147 (20%) – 129 (12%) | |||
Multivariate analysis
To observe samples and variable distribution in the multivariate space, an unsupervised PCA of GC-MS data was performed thus showing along the four principal components an R2X and a Q2 of 0.68 and 0.49, respectively (data not shown). Through the analysis of the T2 Hotelling’s and DmodX, no sample was considered as an outlier. With the aim to find possible differences between the treatment, two PLS-DA and its orthogonal extension were performed.
Micro-particles treatment
The OPLS-DA model showed a good classificatory power with R2Y = 0.92 and Q2Y= 0.64 and a permutation test with the following relatives values: R2X 0.63, Q2= -0.55 (Figure 5A). From the VIP analysis, compared with the coefficient plot and the S-Plot and after the Mann Whitney U test, we highlighted an increase of the following metabolites for treated samples: succinic acid, U23, U24, glucose and talose. On the other hand, decreased levels of glycine, methionine, pyroglutamic acid, n-acetylglucosamine, U15 and U22 were observed (Figure 6).
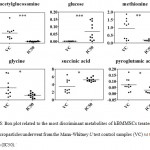 |
Figure 6: Box plot related to the most discriminant metabolites of hBMMSCs treated with ZnO microparticles underwent from the Mann-Whitney U test control samples (VC) vs treated samples (IC50). |
Variable intensities are shown in the y-axis. *, **, and *** indicates levels of significance with a p value of <0.05, <0.01, <0.001 respectively.
Nanoparticles treatment
The OPLS-DA showed a good classificatory power with statistical value of R2Y = 0.62 and a good prediction parameter, i.e. Q2 = 0.92 (Figure 5B). The permutation test parameters resulted respectively of: R2X 0.4. Q2=-0.2. As shown in Figure 7, decreased levels of valine, oxalic acid, glutamine, succinic acid and myristic acid were found in treated cells, while citric acid, lactic acid, n-acetylglucosamine and asparagine were increased.
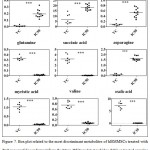 |
Figure 7: Box plot related to the most discriminant metabolites of hBMMSCs treated with ZnO nanoparticles underwent from the Mann-Whitney U test vehicles (VC) vs treated samples (IC50).
|
Variable intensities are shown in the y-axis. *, **, and *** indicates levels of significance with a p value of <0.05, <0.01, <0.001 respectively.
Discussion
Despite of the well known need and advantages of using nanotechnology, several studies indicate that nanoparticles may cause hazardous toxicity effects because of their unique physicochemical properties. Although the beneficial effects of ZnO NPs have attracted considerable attention in cosmetics and food industry, as well as nanomedicine, their interaction with biological systems is still unclear. In particular, data concerning toxic effects of ZnO nanoparticles on stem cells is still quite rare. Syama et al.27 found ZnO-NPs to induce oxidative stress in mouse BMMSCs, whereas Moratin et al.28 found that doses of 5, 10, and 15 µg/ml were all non-cytotoxic in hBMMSCs, although able to cause significant DNA damage already at the lowest concentration of 5 µg/ml. Similarly, our results showed that doses until 38,31 µg/ml had no cytotoxic effects. On the other hand, dose of 58.02 ± 3.15 μg/ml and 67.09 ± 5.26 μg/ml for nano and microparticles, respectively, caused death of 50% of hBMMSCs. These results are in agreement with those ones reported by Syama et al.27 that showed significantly decreased mouse BMMSCs viability was observed when the cells were exposed to ZnO NPs at a concentration of 50 and 70 μg/ml, respectively.
Concerning the effect on DNA, the influence of ZnO nano and microparticles on the cell cycle patterns of hBMMSCs has been investigated. The exposure to ZnO micro and nano particles did not cause the same effect on the cell cycle patterns of hBMMSCs. ZnO microparticles treated cells showed a cell cycle pattern similar to untreated cells, which was expected for continuously growing cells. On the contrary, the decrease of cell population in G0/G1 phase along with the increase in S-phase suggest that ZnO NPs induce cell cycle arrest at the S phase and inhibit the entrance of cells into the mitosis phase of the cell cycle (Figure 4), thus suggesting the DNA damage.29 Our results clearly demonstrated also a nuclear intake of ZnO NPs as shown by TEM analysis (Figure 3), in agreement with30 were the increment of cells in S-phase was considered to be caused by the incorporation of NPs into damaged DNA during the process of DNA replication. Correlation with the DNA damage was also found in the metabolomics analysis concerning the levels of N-acetylglucosamine (GlcNac). GlcNac is an enzyme which is naturally present in the human body that participates in the immune response, in the neurological system and in the cellular communication. Moreover, GlcNAc gives a protective response to stress, modulates the growth and the division of cells, and regulates the gene transcription.31 Chad Slawson et al, in 2005,32 demonstrated the importance of O-linked β-N-acetylglucosamine (O-GlcNAc) in the regulation of the cell cycle. In fact, delays in G2/M progression, altered mitotic phosphorylation and cyclin expression can cause an increase of O-GlcNAc. In the MPs treatment, we found decreased GlcNac levels and unaltered cell population in the G2-M phase. On the other hand, in the NPs treatment, levels of GlcNAc were increased while cell population in the G2-M phase was nil, thus highlighting the differences of hBMMSCs cycle behavior. In addition to the DNA damage, several changes in the metabolomics analysis were also observed. Various levels of metabolites were changed along the treated samples when compared with controls samples. Glycine, methionine and pyroglutamic acid were found to decrease in treated samples. Decreased levels of pyroglutamic acid and glycine are related to a strong oxidative insult, caused by the MPs, eventually leading to a remarked glutathione synthesis.33 The condition of a strong oxidative insult was also found in our previous work34 where hBMMSCs where treated with MPs and NPs of CuO. Furthermore, levels of methionine as well as glycine, pyroglutamic acid were found to decrease in treated samples thus suggesting a participation of methionine in the mechanism of redox regulation in response to the ROS activity.35 Additionally, levels of succinic acid were found to increase in treated samples. The latter metabolite, formed from the tricarboxylic acid cycle, confirmed a variation of the corresponding metabolic pathway that has been already found in our previous work when considering the CuO MPs treatment,34 i.e succinic and citric acid were found to decrease and increase, respectively. Correlations with the tricarboxylic acid cycle pathway were also found in the NPs treatments. In fact, lactic acid and citric acid levels were increased in treated samples while succinic acid levels where found to decrease. Considering the NPs treatment, decreased levels of valine was were observed in treated samples. Ganorkar et al36 confirmed the role of L-valine as surface modifier of calcined and uncalcined ZnO NPs resulting in a decrease of the diameter of the particles.
Moreover, low levels of glutamine in mesenchymal cells treated with ZnO NPs are associated with a strong oxidative insult of the latter ones, eventually leading to the consumption of whole cellular glutathione.37 These results are different from those ones found in our previous work where glutamine was found to increase in the CuO NPs samples.34 These findings suggest that ZnO micro and nanoparticles express their toxicity following different metabolic pathways. Our data demonstrate that exposure of ZnO NPs to hBMMSCs causes cytotoxicity, oxidative stress and cell cycle patterns alterations. Previous in vitro toxicity studies revealed that generation of reactive oxygen species (ROS), followed by ROS-induced oxidative stress, is the mechanism leading to the ZnO NP-mediated toxicity. The nanoparticles, as shown by TEM analysis, enter into the cells because of their size and induces ROS formation that can damage the cell structure and morphology. Furthermore, ZnO NPs, differently from microparticles, can enter into the nucleus, interact with DNA and cause its damage with alteration of cell cycle pattern. On the other hand, the ability to penetrate cells, and in particular to be localized in their nucleus, make ZnO NPs promising agents for cancer therapy and drug delivery. Indeed, several in vitro studies have reported that ZnO NPs show selective cytotoxicity towards cancer cells.38,39,40
Conclusion
This study is one of the few ones available in the literature where human mesenchymal stem cells are used for evaluating ZnO toxicity. Stem cells offers several advantages, reduces the use of in vivo test and their ability to differentiate into a variety of cell types allow them to replace transformed cell lines, thus improving the relevance of predictive assay.
Conflict of Interest
There is no conflict of interest.
Acknowledgements
The authors acknowledge the contribution of Dr. Marcella Arras for interesting discussion during the preparation of this manuscript.
References
- Scanu M., Mancuso L & Cao G. Evaluation of the use of human mesenchymal stem cells for acute toxicity tests. Toxicology in vitro. 2011;25(8):1989-1995.
CrossRef - Nel A., Xia T., Mädler L & Li N. Toxic potential of materials at the nanolevel. science. 2006;311(5761):622-627.
- ASTM International Standard terminology relating to nanotechnology. ASTM Standard E . American Society for Testing and Materials, West Conshohocken V. 2006;2456–06.
- Xia T., Kovochich M., Liong M., Mädler L., Gilbert B., Shi H., Yeh J. I., Zink J. I., Nel A. E. Comparison of the mechanism of toxicity of zinc oxide and cerium oxide nanoparticles based on dissolution and oxidative stress properties. ACS Nano. 2008;2:2121–2134.
CrossRef - Hussain S., Boland S., Baeza-Squiban A., Hamel R., Thomassen L. C., Martens J. A & Marano F.
Oxidative stress and proinflammatory effects of carbon black and titanium dioxide nano particles: role of particle surface area and internalized amount. Toxicology. 2009;260(1-3):142-149.
CrossRef - Sharifi S., Behzadi S., Laurent S., Forrest M. L., Stroeve P & Mahmoudi M. Toxicity of nano materials. Chemical Society Reviews. 2012;41(6):2323-2343.
CrossRef - Szabó T., Németh J & Dékány I. Zinc oxide nanoparticles incorporated in ultrathin layer silicate films and their photocatalytic properties. Colloids and Surfaces A: Physicochemical and Engineering Aspects. 2003;230(1-3):23-35.
CrossRef - Kuo Y. C & Chen H. H. Entrapment and release of saquinavir using novel cationic solid lipid nanoparticles. International journal of pharmaceutics. 2009;365(1-2):206-213.
CrossRef - Sawai J. Quantitative evaluation of antibacterial activities of metallic oxide powders (ZnO, MgO and CaO) by conductimetric assay. Journal of microbiological methods. 2003;54(2):177-182.
CrossRef - Rasmussen J. W., Martinez E., Louka P & Wingett D. G. Zinc oxide nanoparticles for selective destruction of tumor cells and potential for drug delivery applications. Expert opinion on drug delivery. 2010;7(9):1063-1077.
CrossRef - Taccola L., Raffa V., Riggio C., Vittorio O., Iorio M. C., Vanacore R & Cuschieri A. Zinc oxide nanoparticles as selective killers of proliferating cells. International journal of nanomedicine. 2011;6:1129.
- Oberdörster G., Oberdörster E & Oberdörster J. Nanotoxicology: an emerging discipline evolving from studies of ultrafine particles. Environmental health perspectives. 2005;113(7):823.
CrossRef - DeLouise L. A. Applications of nanotechnology in dermatology. Journal of Investigative Dermatology. 2012;132(3):964-975.
CrossRef - Meyer K., Rajanahalli P., Ahamed M., Rowe J. J & Hong Y. ZnO nanoparticles induce apoptosis in human dermal fibroblasts via p53 and p38 pathways. Toxicology in vitro. 2011;25(8):1721-1726.
CrossRef - Anderson M. E. Glutathione: an overview of biosynthesis and modulation. Chemico-biological interactions. 1998;111:1-14.
CrossRef - Sauer U. G. Political incentives towards replacing animal testing in nanotechnology? Altex. 2009;26(4):285.
CrossRef - Mancuso L & Cao G. Acute toxicity test of CuO nanoparticles using human mesenchymal stem cells. Toxicology mechanisms and methods. 2014;24(7):449-454.
CrossRef - Dessì A., Murgia A., Agostino R., Pattumelli M. G., Schirru A., Scano P & Caboni P. Exploring the role of different neonatal nutrition regimens during the first week of life by urinary GC-MS metabolomics. International journal of molecular sciences. 2016;17(2):265.
CrossRef - Scano P., Murgia A., Pirisi F. M & Caboni P. A gas chromatography-mass spectrometry-based metabolomic approach for the characterization of goat milk compared with cow milk. Journal of dairy science. 2014;97(10):6057-6066.
CrossRef - Pisano M. B., Scano P., Murgia A., Cosentino S & Caboni P. Metabolomics and microbiological profile of Italian mozzarella cheese produced with buffalo and cow milk. Food chemistry. 2016;192:618-624.
CrossRef - Murgia A., Mancuso L., Manis C., Caboni P & Cao G. GC-MS metabolomics analysis of mesenchymal stem cells treated with copper oxide nano particles. Toxicology mechanisms and methods. 2016;26(8):611-619.
CrossRef - Semisch A., Ohle J., Witt B., Hartwig A. Cytotoxicity and genotoxicity of nano – and microparticulate copper oxide: role of solubility and intracellular bioavailability. Part Fibre Toxicol. 2014;11:10. doi: 10.1186/1743-8977-11-10.
CrossRef - Eriksson L., Byrne T., Johansson E., Trygg J & Vikström C. Multi-and megavariate data analysis basic principles and applications. Umetrics Academy. 2013;1.
- Ali D., Alarifi S., Kumar S., Ahamed M., Siddiqui M. A. Oxidative stress and genotoxic effect of zinc oxide nanoparticles in freshwater snail Lymnaea luteola L. 2012;15;124-125:83-90.
CrossRef - ICCVAM. Background Review Document: in vitro basal cytotoxicity test methods for estimating acute oral systemic toxicity. Research Triangle Park, NC: National Institute for Environmental Health Sciences. 2006.
- Wang X., Zhang A., Wang P., Sun H., Wu G., Sun W & Liu L. Metabolomics coupled with proteomics advancing drug discovery toward more agile development of targeted combination therapies. Molecular & Cellular Proteomics. 2013;12(5):1226-1238.
CrossRef - Syama S., Sreekanth P. J., Varma H. K & Mohanan P. V. Zinc oxide nanoparticles induced oxidative stress in mouse bone marrow mesenchymal stem cells. Toxicology mechanisms and methods. 2014;24(9):644-653.
CrossRef - Moratin H., Scherzad A., Gehrke T., Ickrath P., Radeloff K., Kleinsasser N & Hackenberg S. Toxicological characterization of ZnO nanoparticles in malignant and nonmalignant cells. Environmental and molecular mutagenesis. 2017.
- Taylor W. R & Stark G. R. Regulation of the G2/M transition by. Oncogene. 2001;20(15):1803.53.
CrossRef - Moghaddam A. B., Moniri M., Azizi S., Rahim R. A., Ariff A. B., Navaderi M and Mohamad R. Eco-Friendly Formulated Zinc Oxide Nanoparticles: Induction of Cell Cycle Arrest and Apoptosis in the MCF-7 Cancer Cell Line. Genes (Basel). 2017;8(10):281.
- Slawson C., Housley M. P & Hart G. W. O-GlcNAc cycling: How a single sugar posttranslational modification is changing the Way We think about signaling networks. Journal of cellular biochemistry. 2006;97(1):71-83.
CrossRef - Slawson C., Zachara N. E., Vosseller K., Cheung W. D., Lane M. D & Hart G. W. Perturbations in O-linked β-N-acetylglucosamine protein modification cause severe defects in mitotic progression and cytokinesis. Journal of Biological Chemistry. 2005;280(38):32944-32956.
CrossRef - Vandebriel R. J & De Jong W. H. A review of mammalian toxicity of ZnO nanoparticles. Nanotechnology, science and applications. 2012;5:61.
CrossRef - Murgia A., Scano P., Contu M., Ibba I., Altea M., Bussu M & Caboni P. Characterization of donkey milk and metabolite profile comparison with human milk and formula milk. LWT-Food Science and Technology. 2016;74:427-433.
CrossRef - Luo S & Levine R. L. Methionine in proteins defends against oxidative stress. The FASEB Journal. 2009;23(2):464-472.
CrossRef - Ganorkar R. P., Kalkar K. P., Tamgadge Y. S. (Synthesis, structural and optical properties of L-valine modified ZnO nanoparticles). Int. J. Chem. Sci. 2015;13(4):2039-10.
- Amores-Sánchez M. I & Medina M. Á. Glutamine, as a precursor of glutathione and oxidative stress. Molecular genetics and metabolism. 1999;67(2):100-105.
CrossRef - Ostrovsky S., Kazimirsky G., Gedanken A., Brodie C. Selective cytotoxic effect of ZnO nano particles on glioma cells. Nano Research. 2009;2(11):882-90.
CrossRef - Akhtar M. J., Ahamed M., Kumar S., Khan M. M., Ahmad J., Alrokayan S. A. Zinc oxide nanoparticles selectively induce apoptosis in human cancer cells through reactive oxygen species. Int. J. Nanomedicine. 2012;7:845-57.
- Thurner A., Wingett D. G., Rasmussen J. W., Layne J., Johnson L., Tenne D. A., et al. Improving the selective cancer killing ability of ZnO nanoparticles using Fe doping. Nanotoxicology. 2012;6(4):440-52.
CrossRef

This work is licensed under a Creative Commons Attribution 4.0 International License.


