

Manuscript accepted on : 27 June 2018
Published online on: 29-06-2018
Mehdi Mahmoudi1, Habibollah Ghazvini2 and Ali Barati2
1Department of Agriculture, Science and Research Branch, Islamic Azad University.
2Seed and Plant Improvement Institute, Agricultural Research, Education and Extension Organization (AREEO), Karaj, Iran.
Corresponding Author E-mail: mehdimahmodi1196@gmail.com
DOI : http://dx.doi.org/10.13005/bbra/2630

ABSTRACT: The study of the relationships between the yield components can help to understand the physiological basis of crop yields. This research was conducted to investigate the genetic diversity of 168 Iranian wheat populations from the aspect of morpho-physiological characteristics in the Grain and Plant Improvement Institute research center in Karaj. In order to calculate the error and correct the collected data, four wheat cultivars of Sivand, Pishtaz, Pishgam, and Sirvan with three replications were used as control groups. The control group was cultivated based on augmented design and genotypes were placed in separate blocks among the control groups. The treatments and control groups were divided into three blocks and each block containing 60 plots which were planted on one-meter beds and the spacing between each plot from other plot was considered 62 cm. The necessary measurements and samples of the movement were collected systematically and by observationally method and sampling from the statistical population of each plot. Data analysis, statistical analyzes of multivariate data including cluster analysis based on multivariate analysis such as principal component analysis (PCA) and simple correlation analysis between characteristics (Pearson) are done using statistical software SPSS and SAS.
KEYWORDS: Genetic Diversity; Morpho-physiological Characteristics; Native Populations; Wheat
Download this article as:| Copy the following to cite this article: Mahmoudi M, Ghazvini H, Barati A. Evaluation of Genetic Diversity of Morpho-Physiological Characteristics Related to Yield and Yield Components in Some of Iranian Wheat Native Populations. Biosci Biotech Res Asia 2018;15(2). |
| Copy the following to cite this URL: Mahmoudi M, Ghazvini H, Barati A. Evaluation of Genetic Diversity of Morpho-Physiological Characteristics Related to Yield and Yield Components in Some of Iranian Wheat Native Populations. Biosci Biotech Res Asia 2018;15(2). Available from: https://www.biotech-asia.org/?p=30024 |
Introduction
Because of geological and climatic conditions, Iran has the proper situation to grow a wide range of plants. These plants are compatible with different areas and from the fundamental and practical research aspect; these plants are counted as the valuable genetic resources in the plant breeding (Mohammadi et al., 2014). Plant breeding provides an opportunity to adapt species with greater diversity, according to consumer demand (Salamaty et al., 2014). The ways of breeding plants are identification of important characteristics of plant species, which have the rule in yield, compatibility and quality, evaluation of the potential of these characteristics and also search the resources of the proper genes to use in the breeding program and transfer them to desired plants. One of the fundamental programs of the plant breeding is the cognition of the genetic diversity in order to a preliminary assessment of the plant populations that the basis of research on plant breeding is based on genetic diversity. In fact, without actually having access to such diversity, the breeder will not be successful in creating the new cultivars (Moghadam et al., 2013). Genetic diversity makes the breeding plant experts able to find or produce a population with high yield and more compatibility with environmental changes by using diversity through the choice of proper population and their use in breeding programs (Mohammadi et al., 2014). According to the role of genetic diversity in advancing and achievement of the breeding program and the role of native populations in this dimension, examination of native populations with functional morpho-physiological characteristics in yield is undoubtedly one of the appropriate methods for achieving selection criteria to improve the yield and to breed and introduce the commercial cultivar. It is essential to determine the appropriate choice criteria and related characteristics in performance enhancement programs. It is obvious that selection is mainly effective for traits and characteristics that have high heritability. Because the varied morphological characteristics related to the resistance or tolerance of genotypes of the native populations of the country are unknown under stress conditions, so its yield and yield components are still the most important criterion in most of the breeding programs for promoting compatible cultivars in tension (Sadeghzadeh et al., 2012). Natural variation in native populations is far more valuable than artificial diversity due to stable forms and many favorable genes. Local varieties contain a large number of genotypes that have been adapted to the natural conditions of their natural habitats, so these varieties can be used as a valuable breeding material, especially at the beginning of the corrective projects used (Sadeghzadeh et al., 2012). The exact identification of genotypes, lines, and plant cultivars, in addition to being of particular importance in the breeding, is very effective in the differentiate the commercial cultivars in order to protect the intellectual property of plant varieties and granting breeder’s rights to their owners. In the system of support for new vegetation cultivars, a cultivar can be registered which technically has three characteristics of distinction, uniformity, and sustainability. The limitation of the distinct morphological and physiological characteristics which are independent of environmental factors and low-level variations of many of them have made it difficult to distinguish the growing cultivars. So the use of cluster analysis is inevitable as a complementary tool in the registration system of plant varieties in the near future due to its advantages (Safaeian et al., 2014). Genetic diversity is the basis of breeding studies in plant species, but so far humankind has only been able to take an initial step to identify its broad potential. According to the surveys that have been done; only about 10% of the existing species have been evaluated by the scientific method. To use this massive capital, knowledge of the nature and extent of diversity in germplasm has great importance in breeding programs. Parents who are genetically different will produce hybrids with more heterocyst and increase the likelihood of obtaining superior distributed results (transgressive segregation). On the other hand, determination the characteristics and grouping of germplasm make it possible for breeders to avoid re-sampling of populations (Salamaty et al., 2014). The important factors in the effectiveness of a breeding program include identifying effective traits in adaptation, yield, quality of the products, genetic potential evaluation; search a source of genes and, ultimately, the transfer of desired genes.
Methodology
Measurement of chlorophyll
The level of leaf chlorophyll was measured in two stages. In the first stage, most of the plants were at the beginning of the stem elongation phase and this measurement was carried out at the highest leaf of the plant and in the second stage, most of the plants were in the flowering phase and chlorophyll measurement in flag leaf is done. The chlorophyll of flag leaf was measured in four leaves of 4 separate plants and in each leaf in the middle of the leaf and in the widest area of the leaf, the chlorophyll was measured three times and their average was recorded as the chlorophyll of the leaf (figure 1).
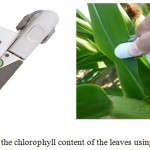 |
Figure 1: Measure the chlorophyll content of the leaves using a chlorophyll meter
|
Shrub height: shrub’s height was measured from the soil surface to the top of the spike included the rootlets of each spike by the meter and expressed in cm.
Spike height: from the top of the spike to the end of the spike, without counting rootlets is measured with the ruler and expressed in cm.
Harvest: plot harvesting was harvested from the middle of the cultivating lines by removing the small effect. The shrubs were placed in large bags and the characteristics related to the plot were pasted on each of these bags. Then the plants were transferred from the farm to the lab and the following traits were measured.
Number of grains per spike: number of grains per spike counted.
The yield of one shrub: the grains of a shrub were measured in grams with a digital scale with 0.001g (one-thousandth of a gram) accuracy.
The weight of one thousand grains: 1000 grains from grains of each plot were randomly separated and weighed with a digital scale with one-thousandth accuracy.
Grain performance: The spike of the harvested shrubs was pummeled and the grains were separated from the straw and these grains were measured with a digital scale with one thousandth accuracy in kilograms per square meter with moisture content of 14%.
The color of the grain: the colors of the grain were white and red and these colors were recorded.
Abscission of grain: the percent of abscission of grain is studied based on the resistance of the grain to abscission with observation and touching and the categorized in the sensitive, semi-sensitive and resistant levels.
Grain size: the size of a grain of each shrub is measured and recorded in millimeter and the amounts which are less than 0.5 and more than 0.5 and more than 1 cm were considered small, big and very big, respectively.
Statistical calculations
SAS and Minitab software were used to principal components analysis and factor analysis, and statistical methods such as regression analysis (linear) and Pearson correlation coefficient were used. At first, the data were analyzed with the help of the test for normalization and then regression analysis was used. Regression analysis is one of the statistical methods that is widely used for data analysis because it expresses the relationships between variables in a simple way and in a way with a concept. Generally, regression analysis is a set of techniques and methods which were used to help understand the relationship between variables. SPSS software was used to analyze linear regression. SAS software was used to calculate Pearson correlation coefficient and positive and negative relationships between measured traits were recorded.
Distribution of dispersion
The status of the yield variables of the native wheat populations studied and these variables were flowering date, yellowing of the peduncle, chlorophyll content, grain size, the percent of abscission of grain, number of florets, the weight of 1000 grains, height, spike length, spikelet number, spike weight and number of grains per spike. The sample size was 168 and control group included 12 samples and the results are given in Table 1.
Table 1: Distribution of dispersion of the status of the yield variables of the studied native wheat populations
| Variable | Frequency | Mean | Standard deviation | Skewness | Minimum | Maximum | Range of variations |
| Flowering date | 180 | 193 | 4.4 | 0.03 | 182 | 202 | 20 |
| Yellowing of the peduncle | 180 | 220.73 | 3.82 | 0.43 | 213 | 232 | 19 |
| Chlorophyll content | 180 | 45.48 | 4.68 | -0.4 | 30.1 | 55.9 | 25.8 |
| Grain size | 180 | 7.44 | 1.22 | -0.16 | 5 | 9 | 4 |
| Percent of abscission of grain | 180 | 1.62 | 0.68 | 0.65 | 1 | 3 | 2 |
| Number of florets | 180 | 6.8 | 1.07 | -0.004 | 5 | 8 | 3 |
| Weight of 1000 grains | 180 | 40.38 | 7.27 | -0.42 | 20 | 58 | 38 |
| Height | 180 | 127.26 | 10.32 | -1.24 | 91.67 | 151.33 | 59.67 |
| Rootlet length | 180 | 6.9 | 2.47 | 0.06 | 0 | 14.57 | 14.57 |
| Spike length | 180 | 9.1 | 1.49 | 0.07 | 5.9 | 13.08 | 7.18 |
| Spikelet number | 180 | 9.14 | 1.54 | 0.83 | 6 | 14.4 | 8.4 |
| Spike weight | 180 | 1.12 | 0.17 | 4.48 | 1.01 | 2.52 | 1.51 |
| Number of grains per spike | 180 | 16.92 | 2.44 | 3.69 | 12.4 | 38.2 | 25.8 |
According to Table 1, it is observed that the flowering date of 193 and standard deviation of 10.38 and skewness of 48.4 are the highest amounts.
Frequency distribution of color status of grain: The frequency distribution of the color of the grains of the studied genotypes is presented in Table 2
Table 2: Frequency distribution of color status of grain
| Variable | Color | Frequency | Percent |
| Color status of grain | Light | 103 | 57.2 |
| Dark | 77 | 42.8 | |
| Total | 180 | 100 |
According to Table 2, it is noted that 103 (57%) of the grains are light and 77 (43%) of the grains are dark.
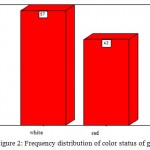 |
Figure 2: Frequency distribution of color status of grain
|
Frequency distribution of spike density condition
The frequency distribution of the spike density condition of the studied genotypes is presented in Table 3.
Table 3: Frequency distribution of spike density condition of grain
| Variable | Frequency | Percent | |
| The spike density condition | Low | 1 | 0.6 |
| Moderate | 58 | 32.2 | |
| High | 81 | 45 | |
| Very high | 40 | 22.2 | |
| Total | 180 | 100 |
According to Table 2, it is noted that in one case (0.6%) was observed low-density spike, in 58 cases (32.2%) was observed moderate density, 81 cases (45%) have high density and 40 cases (22.2%) of the studied genotypes were with very high density.
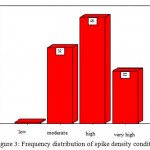 |
Figure 3: Frequency distribution of spike density condition
|
Distribution of dispersion of yield status of a grain of the studied wheat:
Grain yield of wheat is affected by yield components and also the length of the growth period and the grain-filling period length. The difference in yield in the different places and years depends on the genotype (number of spikes per square meter and the number of grains per spike) (Ahmadi and Hosseinpoor, 2012). Because the yield of wheat grains is quantitatively and scores so the distribution of dispersion and the mean were used.
Table 4: Distribution of dispersion of the status of the yield of the studied wheat grains
| Variable | Frequency | Mean | Standard deviation | Skewness | Minimum | Maximum | Range
of variations |
| Yield of the wheat grains | 180 | 3.19 | 0.34 | -0.61 | 2.2 | 3.8 | 1.6 |
According to Table 4, it is noticed that the mean of the yield of the studied wheat grains is equal to 3.19 with a standard deviation of 0.34 and skewness of -0.61. The minimum of the yield of the studied wheat grains is equal to 2.2 and its maximum is 3.8.
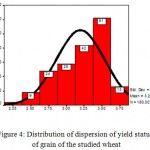 |
Figure 4: Distribution of dispersion of yield status of grain of the studied wheat
|
Result and discussion
Inferential statistics: there is a relationship between the yield components (flowering date, yellowing of the peduncle, chlorophyll content, grain size, the percent of abscission of grain, number of florets, the weight of 1000 grains, height, rootlet height, spike length, spikelet number, spike weight and number of grains per spike) and the yield of the wheat grain.
Table 5: Correlations between the yield components and yield of wheat grain
| Variable | Yield of wheat grain | |||
| N | R | P | R2 | |
| Flowering date | 180 | 0.77 | 0.000 | 0.60 |
| Yellowing of the peduncle | 180 | 0.78 | 0.000 | 0.61 |
| Chlorophyll content | 180 | 0.79 | 0.000 | 0.63 |
| Grain size | 180 | 0.72 | 0.000 | 0.52 |
| The percent of abscission of grain | 180 | 0.67 | 0.000 | 0.44 |
| Number of florets | 180 | 0.67 | 0.000 | 0.46 |
| The weight of 1000 grains | 180 | 0.79 | 0.000 | 0.63 |
| Height | 180 | 0.78 | 0.000 | 0.62 |
| Rootlet height | 180 | 0.76 | 0.000 | 0.59 |
| Spike length | 180 | 0.79 | 0.000 | 0.63 |
| Spikelet number | 180 | 0.75 | 0.000 | 0.57 |
| Spike weight | 180 | 0.49 | 0.000 | 0.25 |
| Number of grains per spike | 180 | 0.66 | 0.000 | 0.45 |
The results of Pearson correlation coefficient were used to study the relationship between grain size and grain yield, this relationship is significant at a probability level of 5% and r is equal to 0.72 (table 5). As a result, there is a significant and direct relationship between the two variables. The result of linear regression showed that the coefficient of determination is R2 = 0.52. In fact, grain yield can be predicted by of 52% size of the grain. The results of Pearson correlation coefficient were used to study the relationship between grain yield and the percent of abscission of grain at a probability level of 5% and it is shown that r = 0.67. As a result, there is an inverse relationship between the two variables; this means that by increasing the percent of abscission of grain, the yield decreases or by decreasing the percent of abscission of grain, the yield increases. The results of Pearson correlation coefficient were used to study the relationship between grain yield and the number of florets at the 5% probability level and it is shown that r = 0.67. As a result, there is a significant relationship between the two variables, the result of linear regression showed that the coefficient of determination is R2 = 0.46. This means that grain yield can be predicted by of 46% the number of florets. The results of Pearson correlation coefficient were used to study the relationship between grain yield and the number of spikelet at a probability level of 5% and it is shown that r = 0.75. As a result, there is a significant relationship between the two variables, the result of linear regression showed that the coefficient of determination is R2 = 0.57. This means that grain yield can be predicted by of 46% the number of spikelets.
Flowering date
Based on the results of the data, different wheat populations differed significantly from the flowering date (day to flowering) so that the highest day to flowering for genotype 59 was 202 days and from the perspective of the length of the period until the flowering, genotype 59 is one of the most serotinous wheat populations. The minimum day to flowering was related to genotype102 with 183 days to flowering and was considered as the most rare-ripe wheat populations in this study (figure 5). In one hand, flowering time due to sensitivity to adverse environmental conditions (cold, heat, dryness, etc.) and on the one hand, the onset of the grain-filling process and the fulfillment of grain yield are the turning point and key point of adaptation of plant to the varied environmental conditions.
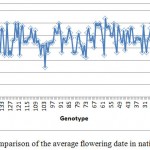 |
Figure 5: Comparison of the average flowering date in native genotypes
|
As the number of days to flowering (flowering date) increases, since the plant will remain more in the vegetative phase, therefore, the plant will have a short reproductive period due to the limited vegetation phase, which reduces the weight of one thousand grains of the plant. In studying the genetic and geographical diversity of genotypes of wild barley (Hordeum vulgare) from different climates of Iran, it was concluded that in most of the studied characteristics, there is a relatively high diversity.
The results of Pearson correlation coefficient were used to study the relationship between grain yield and the flowering date at the 5% probability level and it is shown that r = 0.77. As a result, there is a significant relationship between the two variables, the result of linear regression showed that the coefficient of determination is R2 = 0.60. This means that grain yield can be predicted with 60% of the flowering date.
Ripening time
Different cultivars of wheat had a very wide range of varieties in the ripening time (the number of days to ripe), so that the genotype 150 has the maximum level of this characteristic with an average of 232 days to ripe and genotype 102 has the minimum amount of this trait with an average of 213 days to ripe (figure 6). The length of the life cycle (planting to physiological ripening) varies from one cultivar to another. The study of the thermal energy requirement for completing the life cycle of the cultivar with climatic differentiation showed that the cultivars compatible with cold and temperate cold climate have a longer life cycle than a moderate, warm and dry climate, it is concluded that this is mainly due to available differences during the vegetative stage and the difference in environmental factors changes in different climates. At each of the different phases of the phenology, the active approach of wheat is directed to a particular direction, that ultimately results are showed in the yield. The number of leaves and cinquefoils are mainly determined at the planting stage until the beginning of the spike, also the number of spikelets in spike is recorded at the beginning of the spike to the formation of the final spikelet and the number of grains in spike is noted at the stage of the formation of the final spikelet to the pollination stage. The weight of 1000 grains is also determined in the interval between pollination and ripening stage. So, it is expected that any change during the development stages will change one or more yield components and eventually the yield, and manipulating these steps mean the creation a new way to increase yield. The results of Pearson correlation coefficient were used to investigate the relationship between grain yield and the time of ripening at the 5% probability level and r = 0.78. As a result, there is a direct and significant relationship between the two variables and the result of linear regression with a coefficient of determination is R2 = 0.61, which means that 61% of grain yield can be predicted from the date at of ripening.
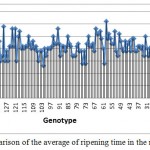 |
Figure 6: Comparison of the average of ripening time in the native genotypes
|
Chlorophyll content in the leaf
Based on the results of this experiment, the highest amount of leaf chlorophyll was produced in the genotype 150 with a mean of 55.9 and the lowest amount of leaf chlorophyll was in genotype 102 with an average of 1.30 (Figure 7). It was reported that there was a significant difference in the level of chlorophyll among different cultivars at the probability level of 1%. Photosynthesis is the most important reaction of the plant to growth and development, that one of the main elements of this important reaction is chlorophylls (reaction centers). The increase in the chlorophyll content of the leaves will increase the speed of photosynthetic reactions and the production of assimilates in the plant. The material produced in the plants is used for the maintenance and growth of the plant, however, the more photosynthetic materials are produced in the plant, vegetative growth (leaf size, shrub height, the number of leaves, etc.) and reproductive growth (grain number, grain weight, yield grains, etc.) will increase in this plant, and, conversely, reducing leaf chlorophyll will reduce the amount of photosynthesis and reduce vegetative and reproductive growth in the plant. The results of Pearson correlation coefficient were used to study the relationship between chlorophyll content and grain yield at the 5% probability level and r = 0.79. As a result, there is a direct and significant relationship between the two variables and the result of linear regression is with a coefficient of determination R2=0.63. It means that 63% of grain yield can be predicted from the chlorophyll content.
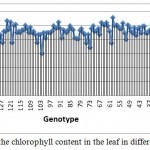 |
Figure 7: Comparison of the chlorophyll content in the leaf in different genotypes Grain yield
|
The grain yield of this experiment was evaluated based on 5 clusters that the obtained results are transferred from grams to kilograms per hectare, according to the ratio of the map of planting and land size.
Genotype 91 had the highest grain yield among the 168 native populations and the yield of this genotype was 3.8 kilogram per hectare. The lowest grain yield was obtained in genotype 135 with a yield of 2.2 kg/ha (figure 8). By examining the data obtained from the implementation of the experiment, the mean of grain yield among 180 wheat native populations was 2.9 kg/ha. The grain yield of wheat and barley is affected by yield components, and also the length of the growth period and the grain-filling period length. The difference in yield in the different places and different years depends on the genotype (number of spikes per square meter and number of grains in each spike). Ghorbani et al. (2011) showed that although harvest index increased with increasing grain yield, this increase (increasing the grain yield) had an effect on the biological yield significantly higher than the increase in harvest index. Some physiological traits such as photosynthesis and some characteristics such as leaf area index, leaf angle and stomata frequency in cereals have genetic diversity and have inheritance ability and have an effective communication with the yield.
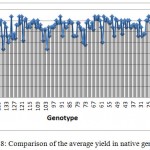 |
Figure 8: Comparison of the average yield in native genotypes
|
Processes such as the intensity of photosynthesis and the storage of material in the grains are important, and the coordination of the transfer of materials between the source and the reservoir is important in the performance and yield. Khodarahmi et al. (2006) showed that there is the highest correlation between grain yield and biological yield and the number of fertile tillers per plant. Peighambari et al. (2005) and Karami et al. (2005) stated that the correlation and relationships between grain yield and other characteristics included shrub height, the number of grains in spike, number of cinquefoils in shrub and the weight of 1000 grain among 72 barley lines were positive and significant.
Conclusion
According to the analysis of the collected data, the following general results were obtained
The tested wheat native populations had a wide variety and many differences from the aspect of the studied morphological and functional and yield characteristics (such as shrub height, flowering date, reopening time, chlorophyll content, grain size, the percent of abscission of grain, number of florets, the weight of 1000 grains, height, spike length, spikelet number, spike weight and number of grains per spike), which help plant breeders to choose to reduce or increase their desired traits and characteristics.
A large variety of morphological and physiological functions were observed in the masses selected from a region, which indicates that the populations in each region differed considerably.
By cluster analysis, certain groups were created and the same masses and populations were grouped in one group; in other words, the cluster decomposition for this scheme could group the masses correctly.
All breeding activities are carried out in order to finally produce the maximum and constant yield. The correlation between the traits and characteristics also showed that the yield components of the wheat, such as the number of grains in spike, the weight of grain in spike, spike length, and etc had a positive and significant correlation with grain yield.
This research was conducted to investigate the genetic diversity of 168 Iranian wheat populations from the aspect of morpho-physiological characteristics in the Grain and Plant Improvement Institute research center in Karaj. In order to calculate the error and correct the collected data, four wheat cultivars of Sivand, Pishtaz, Pishgam, and Sirvan with three replications were used as control groups. The control group was cultivated based on augmented design and genotypes were placed in separate blocks among the control groups. The treatments and control groups were divided into three blocks and each block containing 60 plots which were planted on one-meter beds and the spacing between each plot from other plot was considered 62 cm. The necessary measurements and samples of the movement were collected systematically and by observationally method and sampling from the statistical population of each plot. Data analysis, statistical analyzes of multivariate data including cluster analysis based on multivariate analysis such as principal component analysis (PCA) and simple correlation analysis between characteristics (Pearson) are done using statistical software SPSS and SAS.
References
- Salamaty, M, Yosefi, M. Evaluation of diversity of yield and morphological traits of some of the genotypes of Dracocephalum moldavica. Journal of Plant Genetics (Iranian Journal of Biology). 2014;27(1).
- Safaeian, N., Alemazadeh Ansari, N., Mousavi, M. Evaluation of genetic diversity of some native Coriandrum population of Iran, according to some morphological and antioxidant traits. Iranian Horticultural Science. 2014;45;(4);427-417.
- Sadeghzadeh B, Abedi Asl, Gh, Sadeghzadeh Ahari D. (). Study of some agricultural characteristics related to grain yield wheat native populations of durum under cold rainfed conditions. Iranian Journal of Agricultural Sciences. 2012;1;(1).
- Moghadam, M, Omidibi R, Salimi A, Naghavi M. R. (). Investigation of morphological diversity of Ocimum indigenous populations of Iran. Iranian Journal of Horticulture. 2013;44(3);243-227.
- Mohammadi R, Dehghani H, Zeynli H. Investigation of genetic diversity of different masses of German chamomile (Matricaria Chamomilla L.) using morphological and phenological traits. Journal of Agriculture Research and Development. 2014;105.
- Ghorbani R, Mondani F, Amir Moradi S, Feizi H, Khorramdel S, Teimouri M and Aghel H. A case study of energy use and economic analysis of irrigated and dryland wheat production systems. Applied Energy. 2011;88(1), 283-288.
CrossRef - Keshavarz A, M. Heidari, R. Jalali Kamali and A. Heidari. . The increase of wheat yield production in Iran. Instruction and agricultural promotion research organization. Grain and Plant Improvement Institute Karaj. 1999.
- Kuchaki A, M. Nasiri, G. Jahanbin and A. Zare Feyz Abadi. The diversity of crop varieties in Iran. Desert Journal. 2004;1:49- 67.
- Kirby, E. J. M, Appleyard, M. Cereal development guide. Stoneleigh, Kenilworth, UK, NAC Cereal Unit. 1987;85.
- Khodabandeh N. Cereals. Tehran University Publications. 1998;538
- Lagudah S, and G. M. Hallora. Phylogenetic relationships of Triticum tauschii the D – genome donor to hexaploid wheat .3.Variation in, and the genetics of grain esterases (EST-5). Theor. Appl.Genet. 1989;77:851-856.
CrossRef - Poehlman J. M. Breeding field Van Nostrand Reinhold, New York. 1987;724.
- Taleei A. and B. Bahram-Nejad. . A study of the relationship between yield and its components in landrace populations of wheat from western parts of Iran using multivariate analysis. Iranian J. Agric. Sci. 2003;34(4): 949-959. (In Persian).
- USDA. http://www.pecad.fas.usda.gov/highlights/2012/05/Iran/.2012
- USDA. http://www.pecad.fas.usda.gov/highlights/2010/06/ Middle%20 East. 2014
- Von Braun J. and D. Virchow. Economic evaluation of biotechnology and plant diversity in developing countries. Plant Res. Develop. 1996;43: 50-61.
- Winter SR, Musick JT, Porter KB. Evaluation of screening techniques for breeding drought-resistant winter wheat. Crop Science. 1988;28:512-516.
CrossRef - P. D. ; the use of factor analysis in determining characters for yield selection in wheat. Euphytica. 1971;20:416-421.
CrossRef - Yildrim M, Budak N, Arshas Y. Factor analysis of yield and related traits in bread wheat. Turkish Journal of Field Crops 1993;1: 11-15.
- Zali, A. Utilization of germplasm collection in plant breeding. Proceeding of the 3rd Iranian Congress of. 1996.

This work is licensed under a Creative Commons Attribution 4.0 International License.


