

Manuscript accepted on : 01 March 2018
Published online on: --
V. Kalaivani1 , R. Lakshmi Devi2 and V. Anusuyadevi1
1Department of Computer Science Engineering National Engineering College, Kovilpatti, Tamilnadu, India.
2Department of Information Technology, National Engineering College, Kovilpatti, Tamilnadu, India.
Corresponding Author E-mail: vkcse@nec.edu.in
DOI : http://dx.doi.org/10.13005/bbra/2610

ABSTRACT: The main objective is to develop a novel method for the heart sound analysis for the detection of cardiovascular diseases. It can be considered as one of the important phases in the automated analysis of PCG signals. Heart sounds carry information about mechanical activity of the cardiovascular system. This information includes specific physiological state of the subject and the short term variability related to the respiratory cycle. The interpretation of sounds and extraction of changes in the physiological state while maintaining the short term variability are still an open problem and is subject of this paper. The system deals with the process of de-noising of the heart sound signal(PCG) and the signal is decomposed into several sub-bands and the de-noised heart sound signal is segmented into the basic heart sounds S1 and S2, along with the systolic and diastolic interval.. Also, the ECG signal is de-noised. Meanwhile, the R-peaks are identified from the ECG signal and RR interval is obtained. Extraction of features are done from both the heart sound signal and the ECG signal. From the features, the R-peaks are identified from the ECG signal and RR interval is obtained. The attribute selection is to find the best attribute values that can be used for the classification process. Finally, using classification technique, cardiac diseases are detected. This work is implemented by using MATLAB software.
KEYWORDS: Cardiovascular Diseases; Classification Diastolic; ECG; Heart Sounds; Phonocardiograpy(PCG); Systolic;
Download this article as:| Copy the following to cite this article: Kalaivani V, Devi R. L, Anusuyadevi V. Phonocardiographic Signal and Electrocardiographic Signal Analysis for the Detection of Cardiovascular Diseases. Biosci Biotech Res Asia 2018;15(1). |
| Copy the following to cite this URL: Kalaivani V, Devi R. L, Anusuyadevi V. Phonocardiographic Signal and Electrocardiographic Signal Analysis for the Detection of Cardiovascular Diseases. Biosci Biotech Res Asia 2018;15(1). Available from: https://www.biotech-asia.org/?p=29471 |
Introduction
Heart disease is a major health problem and it is the leading cause of death throughout the world. Early detection of cardiovascular diseases has become an important issue in the medical research field. Most of the heart valve disorders are reflected to heart sounds and can be detected through the phonocardiography (PCG) signal analysis. PCG signal is the recording of sound variations of heart and blood flow that provides valuable information for detecting pathological heart sounds. The Figure 1 shows the phonocardiographic signal of sample heart sounds.
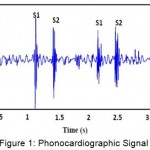 |
Figure 1: Phonocardiographic Signal
|
Heart sounds are generated by the heart beating and the resultant flow of blood through it. The two normal heart sounds are S1 and S2, and are low frequency signals. The heart sounds with higher frequency are called murmurs. Murmurs are usually generated by the turbulent blood flow through the heart. The frequency ranges of the normal heart sounds and the murmurs are shown in the Table 1.
Table 1: Heart Sounds Frequency Range
| PCG Signal | Frequency Range (Hz) |
| S1 and S2 | 20 – 200 |
| Murmurs | 120 – 700 |
Similarly, the electrocardiographic signal which records the electrical activity of the human heart helps in the diagnosis of heart disorders. The electrocardiographic signal consists of P-wave, QRS-complex and T-wave. The P-wave is due to the depolarization of atria in response to the sino-atrial node triggering. The QRS-complex is due to the depolarization of ventricles and T-wave is due to ventricular repolarization.
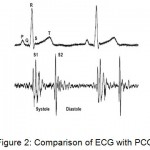 |
Figure 2: Comparison of ECG with PCG
|
Figure 2 shows the comparison between ECG and ECG. The interval between two consecutive R-peaks is the RR interval which is same as that of the S1-S1 interval. Any deviation from the normal range of these intervals results in the abnormality of the heart.
The detection and classification of heart diseases by analysing the phonocardiographic signal manually is complicated. So, automatic heart sound analysis in computer systems would be very helpful for accurate detection of heart diseases. The proposed heart sound analysis system compares the RR interval of the electrocardiographic signal with the S1-S1 interval of the phonocardiographic signal.
Related Work
An extensive survey has been taken, focussing on the detailed description about the pre-processing of the heart sound signal, its segmentation, feature extraction, attribute selection and the classification methods. The separation of murmur from the recorded heart sounds has been performed using the method singular spectrum analysis.9 The segmentation of the heart sound signal into S1, systolic interval, S2 and diastolic interval has been done using tunable-Q wavelet transform,12 boundary detection method2 and moment based method.18 The features were extracted by discrete wavelet transform. The needed features were selected using multi-level basis selection8 and genetic algorithm.14 The support vector machine has been used for the classification of heart diseases.15 From the literature survey analysis, it is concluded that in the existing system, heart sound signal alone has been analysed for the detection of heart diseases. Also, ECG signal alone has been used for the detection of cardiac diseases. But in the proposed system, both PCG and ECG signals are analyzed and compared, both features are correlated for the detection of cardiac arrhythmia diseases.
Heart Sound Analysis System
The ultimate goal of this proposed system is to develop an automated real time heart sound analysis system1 for the detection of cardiovascular diseases using the PCG and ECG. The system involves the process of de-noising, segmentation, feature extraction and classification of both phonocardiographic and electrocardiographic signals. The development of the system involves Pre-processing, Segmentation3 Feature extraction and Feature selection and Classification. The initial process deals with the de-noising of the heart sound signal and the signal is decomposed into several sub-bands. Also, the ECG signal is de-noised. The de-noised heart sound signal is segmented into the basic heart sounds S1 and S2, along with the systolic and diastolic interval. Meanwhile, ECG signal also is preprocessed and time domain and frequency domain features are extracted. The R-peaks are identified from the ECG signal and RR interval is obtained. The attribute selection is to find the best attribute values, unwanted attributes are removed to reduce the processing time. It is finally used for the classification process.4 The Figure 3 shows the proposed system. This work is implemented by using MATLAB software.
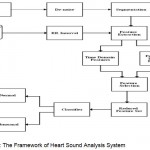 |
Figure 3: The Framework of Heart Sound Analysis System
|
Database
The heart sound signals are collected from the SoundJay database (http://www.soundjay.com/heartbeat-sound-effect.html), Michigan Heart Sound University (http://www.med.umich.edu/lrc/psb/heartsounds/) and Frontiers in Bioscience (http://int-prop.lf2.cuni.cz/heart_sounds/h14/sound.htm ). This database is the record of the sound of heart beating, the sound of heartbeat speeding up, the sound of heart starts beating and speeds up, and various murmur heart sounds. The ECG signals are collected from the Physionet bank (http://physionet.org/cgi-bin/atm/ATM)
Methods
Pre-processing
The raw heart sound signals may contain some low and high frequency noises. These noises may be due to the operation of lungs, the muscle contraction and the movement of other parts of the body.21 The low frequency noises affect the edge function of the signal and the high frequency noises affect the structure of the wave form. The presence of these noises makes a difference to the feature extraction process which in turn has an impact on the classification process. These noises are removed by using the Butterworth low pass filter. The Butterworth filter is recursive, that is, past values of the output are used as input, so a phase shift is introduced unless the data are filtered forward and backward through the same filter. When this is done, the filtered signal differs only slightly from that of other low-pass filters. The Butterworth filter is used for the reduction in computation time over other low-pass filters. The four levels of the low pass filters have been used. The amplitude above a particular range is eliminated without changing or disturbing the characteristics of the heart sound signal. All the four levels have been applied. At each level the response rolls off to a certain limit. The first order response rolls off at 6dB per octave. The second order response decreases at 12dB per octave whereas the third and fourth order response decreases at 18dB and 24dB per octave respectively. Meanwhile, high pass and low pass filters are applied to the ECG signals and noises are removed. The low pass filter passes low frequency signals and attenuates signals with frequencies higher than the cut-off frequency. The high pass filter is an electronic filter that passes high frequency signals but attenuates signals with frequencies lower than the cut-off frequency. The low pass filter reduces the high frequency components whereas the high pass filter reduces the low frequency components.
Wavelet Decomposition
The de-noised signal is applied with the Discrete Wavelet Transform and decomposed into several sub-bands. The Discrete Wavelet Transform (DWT) is used to decompose the heart sound signal into various sub-bands.18 The basic principle of DWT is to decompose the signal into finer details using high-pass and low-pass filters. At the first level of decomposition, two signals representing the detail (high frequency) and the approximate (low frequency) will be obtained. The approximate signals are decomposed into the detail and approximate at the further levels and the process continues. Among the various wavelet bases, the daubechies family of wavelet is very efficient. In this paper, the daubechies family of wavelet db4 is used for decomposition. The various detail level coefficients have been obtained. The Figure 4 shows a three level wavelet decomposition.
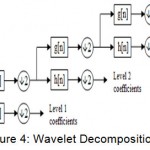 |
Figure 4: Wavelet Decomposition
|
Segmentation
At the next stage, the basic heart sounds of the heart sound signal are segmented, that is, the heart sound signal is segmented into S1, systolic interval, S2 and diastolic interval. The interval between S1 and S2 is called the systolic interval whereas the interval between S2 and the next S1 is called the diastolic interval. The diastolic interval is usually larger than the systolic interval. At first, the envelope of the heart sound signal is extracted and the maximum peak values are identified.3 Then, based on the systolic and diastolic interval, the maximum peaks are determined to be the basic heart sounds S1 and S2. The normal range of systolic interval is between 100ms and 300ms and the diastolic interval ranges from 300ms to 600ms. From the de-noised ECG signal, the maximum peaks above a certain threshold are detected as R-peaks.
Feature Extraction and Feature Selection
The third module deals with the extraction of features from the heart sound signal. The various time domain features and the frequency domain features are extracted. The time domain features calculated are mean of the peak S1 (AVGS1), mean of the peak S2 (AVGS2), mean of the systolic interval (AVGSYS), mean of the diastolic interval (AVGDIAS), total average of systolic and diastolic interval (AVG), standard deviation of peaks S1 and S2 (SDS1 and SDS2), standard deviation of NN intervals (SDSYS and SDDIAS), the Root of mean of sum of Squares of difference of adjacent NN intervals (RMSSDSYS and RMSSDDIAS), mean of R-peak (AVGR), mean of RR-interval (AVGRR), standard deviation of RR intervals (SDRR) and the Root of mean of sum of Squares of difference of adjacent RR intervals(RMSSDRR). Frequency domain features are calculated using Power Spectral Density. The features are Very Low Frequency (VLF) which lies between 0 and 0.04, Low Frequency (LF) between 0.04 and 0.15, High Frequency (HF) between 0.15 and 0.4 and the total power between 0 and 0.4. Also the ratio of Low frequency and high frequency (LF/HF) is calculated. The disease identification mainly depends on these attribute values. Giving in all the extracted features to a classifier makes the classification process a complicated one. To avoid this complication, the feature selection process forms a reduced feature set. The most informative features are selected and the redundant features are eliminated by the feature selection process.8
Classification
Based on the reduced feature set, the classifier classifies the captured heart signal into normal and abnormal. The features are applied to three different classifiers namely K-Nearest Neighbour Classifier, K-Means Clustering and the Classification and Regression Tree (CART) Classifier. KNN is a method for classifying objects based on closest training examples in the feature space. An object is classified by a majority vote of its Neighbours. K is always a positive integer. The Neighbors from a set of objects are considered in which the correct classification is done. The K-Nearest Neighbor classifier is commonly based on the Euclidean distance between a test sample and the specified training samples.
K-means clustering is a method of classifying items into k groups where k is the number of pre-chosen groups. The grouping is done by minimizing the sum of squared distances between items and the corresponding centroid. A centroid is the centre of mass of a geometric object of uniform density.
CART is a recursive partitioning method that builds classification and regression trees for predicting continuous dependent variables (regression) and categorical predictor variables (classification). In the classification trees, the target is categorical and it is used to identify the class. An internal node is a decision-making unit that evaluates a decision function to determine which child node to visit next. A terminal node has no child nodes and is associated with one of the partitions of the input space. Each terminal node has a unique path that leads from the root to itself. In classification trees, each terminal node has a label that indicates the class for the associated input.
Results
The proposed Heart Sound Signal Analysis System de-noises the input PCG and ECG signals, detect the peaks, extract the time domain and frequency domain features, form a reduced feature set and then classify using three different classifiers.
Table 1: Time Domain Features of PCG- Average
| No. Signal | AVGS1 (mv) | AVGS2 (mv) | AVG(Systolic) (ms) | AVG(Diastolic) (ms) | AVG (ms) |
| Hs1 | 0.5038 | 0.7547 | 81.8667 | 185 | 266.8667 |
| Hs2 | 0.8153 | 0.685 | 113.9229 | 194.4671 | 308.39 |
| Hs3 | 0.6434 | 0.5737 | 120.4535 | 186.7271 | 307.1807 |
| Hs4 | 0.5085 | 0.3088 | 130.6122 | 210.9146 | 341.5268 |
| Hs5 | 0.5179 | 0.448 | 125.5329 | 217.6871 | 343.22 |
| Hs6 | 0.8457 | 0.695 | 116.0998 | 192.5321 | 308.6319 |
| Hs7 | 0.7515 | 0.8637 | 117.551 | 195.4346 | 312.9856 |
| Hs8 | 0.6519 | 0.7254 | 102.7483 | 171.2472 | 273.9955 |
| Hs9 (normal) | 0.8142 | 0.7978 | 208.9796 | 363.7793 | 572.7589 |
| Hs10 | 0.7745 | 0.8407 | 119.0023 | 191.5646 | 310.5669 |
Table 1 shows the extracted time domain features such as mean of peaks and the intervals of heart sound signal
Table 2: Time Domain Features of PCG signal – SD and RMSSD
| Signal | SDS1 (mv) | SDS2 (mv) | SDSYS (ms) | SDDIAS (ms) | RMSSDSYS (ms) | RMSSDDIAS (ms) |
| Hs1 | 0.0171 | 0.0054 | 0.5963 | 0.6667 | 0.5333 | 0.5774 |
| Hs2 | 0.0886 | 0.081 | 1.4512 | 5.0273 | 1.2568 | 4.1047 |
| Hs3 | 0.0765 | 0.0359 | 4.1047 | 5.0273 | 3.5548 | 4.1047 |
| Hs4 | 0.0512 | 0.0113 | 5.44E-14 | 7.3045 | 4.71E-14 | 5.9641 |
| Hs5 | 0.033 | 0.0573 | 4.3537 | 2.9025 | 3.7705 | 2.3699 |
| Hs6 | 0.0649 | 0.0623 | 4.3537 | 1.6758 | 3.7705 | 1.3682 |
| Hs7 | 0.0863 | 0.0969 | 4.3537 | 1.6758 | 3.7705 | 1.3682 |
| Hs8 | 0.0329 | 0.035 | 1.5898 | 5.68E-14 | 1.4219 | 4.92E-14 |
| Hs9 (normal) | 0.1052 | 0.1024 | 8.2095 | 3.3515 | 7.1096 | 2.7365 |
| Hs10 | 0.1003 | 0.0676 | 1.4512 | 5.0273 | 1.2568 | 4.1047 |
The Table 2 shows the extracted time domain features such as standard deviation and root mean square of peaks and the intervals of heart sound signal.
Table 3: Frequency Domain Features of PCG signal
| Single | TP | ULF | VLF | LF | HF | LFHF |
| Hs1 | 0.0023 | 0.00033 | 0.000438 | 0.000623 | 0.0017 | 0.3734 |
| Hs2 | 0.005 | 0.000495 | 0.000696 | 0.0013 | 0.0039 | 0.3225 |
| Hs3 | 0.0026 | 0.000211 | 0.000264 | 0.000697 | 0.0021 | 0.3309 |
| Hs4 | 0.0024 | 0.00045 | 0.000654 | 0.0011 | 0.0013 | 0.8723 |
| Hs5 | 0.0034 | 0.000167 | 0.00025 | 0.000854 | 0.0029 | 0.2946 |
| Hs6 | 0.00075 | 0.000124 | 0.00016 | 0.000184 | 0.000528 | 0.3479 |
| Hs7 | 0.008 | 0.000493 | 0.000765 | 0.002 | 0.0066 | 0.3028 |
| Hs8 | 0.0041 | 0.0023 | 0.0028 | 0.0017 | 0.000826 | 2.0049 |
| Hs9 | 0.000905 | 0.000158 | 0.000229 | 0.000454 | 0.00052 | 0.873 |
| Hs10 | 0.0042 | 0.00018 | 0.000301 | 0.000984 | 0.0036 | 0.2748 |
The Table 3 shows the extracted frequency domain features of heart sound signal.
Table 4: Feature Extraction of ECG Signals
| Single | AVGR (mv) | AVGRR (ms) | SDNNRR (ms) | RMSSDRR (ms) |
| Ecg1 (normal) | 0.9371 | 422 | 65.2354 | 60.3962 |
| Ecg2 (normal) | 0.9528 | 514.6429 | 204.5953 | 189.4184 |
| Ecg3 (normal) | 0.9692 | 456.0714 | 135.7069 | 125.6402 |
| Ecg4 | 0.9796 | 383.9286 | 64.9977 | 60.1762 |
| Ecg5 | 0.9247 | 329.6429 | 23.7797 | 22.0158 |
| Ecg6 | 0.9061 | 312.5 | 43.9934 | 40.7299 |
The Table 4 shows the features that are extracted from the ECG signals.
From the above tables, reduced feature set is formed and given to three different classifiers. The performance of three classifiers are determined.
Table 5: Performance Measures of PCG Signals
| Classifier/ Measures | Sensitivity (%) | Specificity (%) | Accuracy (%) |
| KNN | 100 | 100 | 100 |
| K-Means | 75 | 100 | 83.33 |
| CART | 100 | 100 | 100 |
The Table 5 shows the sensitivity, specificity and accuracy of the classifiers used for analyzing the heart sound signals.
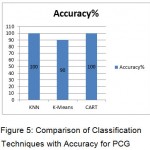 |
Figure 5: Comparison of Classification Techniques with Accuracy for PCG
|
The Figure 5 shows the comparison result of the accuracy of the three different classifiers used.
Table 6. Performance Measures of ECG Signals
| Classifier/ Measures | Sensitivity (%) | Specificity (%) | Accuracy (%) |
| KNN | 100 | 100 | 100 |
| K-Means | 0 | 90 | 90 |
| CART | 100 | 100 |
100 |
The Table 6 shows the sensitivity, specificity and accuracy of the classifiers used for analyzing the ECG signals.
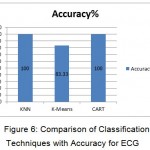 |
Figure 6: Comparison of Classification Techniques with Accuracy for ECG
|
The Figure 6 shows the comparison result of the accuracy of the three different classifiers used.
Conclusion
The detection of cardiovascular diseases from the heart sounds is difficult because the doctors found it difficult to listen to the heart sounds accurately during auscultation. To make it simple and accurate, the phonocardiographic signal features are used. The phonocardiographic features and the electrocardiographic features are compared which helps the physicians to detect the presence of heart diseases. The heart sound signal is first pre-processed to remove all the unwanted sounds. The Butterworth low pass filter is used for removing the noise. The heart sound signal is decomposed using Discrete Wavelet Transform and then segmented into the S1, the systolic interval, the S2, and the diastolic interval. Also, the electrocardiographic signals are filtered using high pass and low pass filters, and the R-peaks are detected. Then, various features of the heart sound signal and the electrocardiographic signal are extracted, and some among them are chosen for the classification process. The classifiers classify the given input signals into normal and abnormal. This automated system for the detection of cardiovascular disease helps the doctors to detect the presence of heart diseases accurately. In future, the system can be extended to identify the type of abnormalities in the arrhythmia diseases
References
- Dennis A, Michaels A.D, Arand P, Ventura D. ‘Noninvasive Diagnosis of Pulmonary Hypertension Using Heart Sound Analysis’. Elsevier Transactions on Computers in Biology and Medicine. 2010;40:758-764.
CrossRef - Moukadem A, Dieterlen A , Hueber N, Brandt C. ‘A Robust Heart Sounds Segmentation Module Based on S-transform’. Elsevier Transactions on Biomedical Signal Processing And Control. 2013;8:273-281.
CrossRef - Sepheri A.A , Gharehbaghi A, Dutoit T, Kocharian A , Kiani A. ‘A Novel Method for Pedaitric Heart Sound Segmentation Without Using The ECG’, Elsevier Transactions on Computer Methods And Programs in Biomedicine. 2010;99:43-48.
CrossRef - Devi A , Mishal A. ‘A Survey on Classifiers Used in Heart Valve Disease Detection’. International Journal of Advanced Research in Electrical. Electronics and Instrumentation Engineering. 2013;2(1).
- Avci E. ‘A New Intelligent Diagnosis System for the Heart Valve Diseases by Using Genetic-SVM Classifier’. Elsevier Transactions on Expert Systems With Applications. 2009;36:10618-10626.
CrossRef - Griffel B , Mohammad Z.K , FridmanV , Saponieri C,Semmlow J.L.‘Path Length Entropy Analysis of Diastolic Heart Sounds’.Elsevier Transactions on Computers in Biology and Medicine. 2013;43:1154-116.
CrossRef - Zhang D, He J, Yao J , Wu, Du M. ‘Noninvasive Detection of Mechanical Prosthetic Heart Valve Disorder’. Elsevier Transactions on Computers in Biology and Medicine. 2012;42:785-792.
CrossRef - Safara, Doraisamy S , Azman A, Jantan A, Ranga A, Ramaiah A. ‘Multi-level Basis Selection of Wavelet Packet decomposition Tree for Heart Sound Classification’. Elsevier Transactions on Computers in Biology and Medicine. 2013;43:1407-1414.
CrossRef - Sanei , Ghodsi M , Hassani H. ‘An Adaptive Singular Spectrum Analysis Approach to Murmur Detection from Heart Sounds’. Elsevier Transactions on Medical Engineering and Physics. 2011;33:362-367.
CrossRef - Ari S, Hembram K, Saha G. ‘Detection of Cardiac Abnormality from PCG Signal using LMS Based Least Square SVM Classifier’.Elsevier Transactions on Expert Systems with Applications. 2010;37:8019-8026.
CrossRef - Choi S, Shin Y, Hun-Kuk P. ‘Selection of Wavelet Packet Measures for Insufficiency Murmur Identification’. Elsevier Transactions on Expert Systems with Applications. 2011;38:4264-4271.
CrossRef - Patidar S , Bilas R.P. ‘Segmentation of Cardiac Sound Signals by Removing Murmurs Using Constrained Tunable-Q Wavelet Transform’, Elsevier Transactions on Biomedical Signal Processing And Control. 2013;8: 559-567.
CrossRef - Dong S. FuF ‘Research and Application of Heart Sound Alignment and Descriptor’, Elsevier Transactions on Computers in Biology and Medicine. 2013;43:211-218.
CrossRef - Jabbari S, Ghassemian H. ‘Modeling of Heart Systolic Murmurs Based on Multivariate Matching Pursuit for Diagnosis of Valvular Disorders’, Elsevier Transactions on Computers in Biology and Medicine. 2011;41:802-811.
CrossRef - Zahorian S.A , Zuckerwar A.J,Karnjanadecha M. ‘Dual Transmission Model and Related Spectral Content of the Fetal Heart Sounds’, Elsevier Transactions on Computer Methods and Programs in Biomedicine. 2012; 108:20-27.
CrossRef - Kofman S, Bickel A , Eitan A, Weiss A , GavrielyN , Intrator N. ‘Discovery of Multiple Level Heart Sound Morphological Variability Resulting from Changes in Physiological States’, Elsevier Transactions on Biomedical Signal Processing and Control. 2012;7:315-324.
CrossRef - Wen-Chung K, Chih-Chao W. ‘Automatic Phonocardiograph Signal Analysis for Detecting Heart Valve Disorders’, Elsevier Transactions on Expert Systems with Applications. 2011;38:6458-6468.
CrossRef - Yan Z , Jiang Z, Miyamoto A, Wei Y. ‘The Moment Segmentation Analysis of Heart Sound Pattern’, Elsevier Transactions on Computer Methods And Programs In Biomedicine. 2010;98:140-150.
CrossRef

This work is licensed under a Creative Commons Attribution 4.0 International License.


