

Manuscript accepted on : 03 March 2018
Published online on: --
Plagiarism Check: Yes
Adsorption of Sulfate in Aqueous Solutions by Cheap Plant Adsorbents
Yadollah Aghdoud Chabok and Aref Chourani
Emam khomeini naval university, Noshahr, Iran.
Corresponding Author E-mail: s.ashtari67@gmail.com
DOI : http://dx.doi.org/10.13005/bbra/2619

ABSTRACT: In this study, the possibility of sulphate adsorption from a synthetic solution containing sodium sulphate was investigated using corn and wheat straw. The initial results showed that modified corn had the best absorbance among the samples. The temperature, mixing time, adsorbent amount and also the amount of sulfate ions in the solution as effective parameters in the adsorption process were investigated. It was observed that with increasing temperature, the adsorption rate decreases due to the thermostability of the reaction. Also, increasing the time before reaching a saturation state, the absorption capacity is increased.
KEYWORDS: Adsorption; Corn; Wheat Straw; Sulphate; Adsorption Kinetic
Download this article as:| Copy the following to cite this article: Chabok Y. A, Chourani A. Adsorption of Sulfate in Aqueous Solutions by Cheap Plant Adsorbents. Biosci Biotech Res Asia 2018;15(1). |
| Copy the following to cite this URL: Chabok Y. A, Chourani A. Adsorption of Sulfate in Aqueous Solutions by Cheap Plant Adsorbents. Biosci Biotech Res Asia 2018;15(1). Available from: https://www.biotech-asia.org/?p=29251 |
Introduction
Drinking water is derived from a variety of sources depending on local availability; such as surface water (rivers, lakes, reservoirs and ponds), groundwater (aquifers) and rain water. These sources vary in terms of contaminants risk1. The pollution of water resources due to the disposal of contaminants is an increasing worldwide concern for the last few decades. The most common water pollutants are inorganic and organic matters. They are discharged into the water by natural phenomenon or human activities ranging from discharge of effluents from municipal waste or industrial activities. Chemicals that are discharged into the surface and subsurface waters from these effluents are permeating environmental problem. Pollutants release, generation of the variety of organic and inorganic chemical compounds due to the rapid development of chemical industry, and entry of toxic and hazardous substances to natural resources have become a serious threat to environment. Analysis of the effluents from mining industry has shown that this type of waste is considered among the most dangerous industrial waste. Sulphate ions are naturally present in several mineral and metallurgical wastewaters after processing Barite (BaSO4), Epsomite (MgSO4_7H2O), Gypsum (CaSO4_2H2O) and metal sulphides (mainly Fe, Cu and Mo) (Greenwood and Earnshaw, 1997). High levels of sulphate ions cause severe environmental problems, especially in the mining, metallurgical, chemical and agricultural sectors. Tailings (piles or dumps) from coal and some metal-bearing ores (especially those rich in pyrite and chalcopyrite) are readily oxidized by water and oxygen, resulting in acid drainage. Such liquid effluents or AMDs (acid mine drainages) contain high levels of heavy metal ions, sulphate ions and acidity and constitute one of the main challenges in the mining industry.
Sulphates are of considerable concern because they are indirectly responsible for two serious problems often associated with the handling and treatments of waste water. They are odour and sewer corrosion problems which result from reduction of sulphates to hydrogen sulphide under anaerobic condition. The amount of sulphate in water is a factor of concern in determining the magnitude of the problems that can arise from reduction of sulphate to hydrogen sulphide. The removal of sulphate ions from such waters is a complex problem due to the high solubility and stability of these anions in aqueous solutions. Partial sulphate ions removal is often accomplished through precipitation with lime (Rubio et al., 2009). However, this process usually presents a very low practical efficiency because of the high solubility of the produced CaSO4. The aim of this work was to study the removal of sulphate in aqueous solution by corn and wheat straw. In this work, the temperature, mixing time, adsorbent amount and also the amount of sulfate ions in the solution as effective parameters in the adsorption process were investigated.
Material and Methods
At first, a certain amount of sodium sulfate (Na2SO4) with a purity of 99.9% was dissolved in distilled water, then added some absorbent material and was stirred at a speed of 600 rpm in a specified period of time. Finally, an absorption spectrophotometer was used to determine the amount of sulfate ion before and after the absorption process. All steps were in alkaline pH and room temperature (25-20°C). Initially, in order to determine the best absorbent from corn, modified corn, wheat straw and modified wheat straw, a baseline test was carried out and the adsorption amount was determined (50 mg/l, 25°C and mixing time 90 min). By comparing the removal percentages, the best adsorbent was selected. In order to study the effect of each operating temperature, mixing time, adsorbent concentration and sulfate concentration on the removal percentage, the design of the experiments was used. In order to investigate the effect of temperature on the sulfate removal process, absorption tests were carried out at 25, 35, 45 and 55 ° C. In order to investigate the effect of mixing time on the sulfate removal process, absorption tests were performed at 30, 60, 90, 120 and 150 min. In order to study the effect of adsorbent on the sulfate removal process, adsorption experiments were carried out at 0.5 gr, 0.1 gr, 0.15 gr, 0.2 gr and 0.25 gr adsorbents. In order to investigate the effect of sulfate concentration on the sulfate removal process, adsorption experiments were accomplished at concentrations of 50 mg/l, 250 mg/l, 450 mg/l, 650 mg/l and 850 mg/l.
Results and Discussion
The amount of adsorbed ions was calculated from the initial concentration difference and the equilibrium concentration of ions in the residual solution using equation (1) and is plotted as a function of equilibrium concentration.
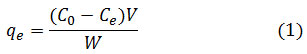
The percentage of adsorption of sulfate ions is also calculated from the difference between initial concentration and equilibrium using equation (2) and included in the tables.

In the formulas above, Co and Ce are the initial concentrations and the concentration of sulfate in solution (mg / L), V is the volume of the sulfate solution (L), and W is the adsorbent mass (g).
As shown in Table 1, modified specimens show a better absorption rate than the original sample. Meanwhile, modified corn has the highest absorbance and maximum absorption capacity than the other three samples.
Table 1: The amount of sulfate adsorption by various samples
| Absorption (%) | Absorption capacity (mg/g) | Concentration of sulfate after absorption (mg/l) | Samples |
| 8.2 | 20.5 | 45.9 | Wheat straw |
| 11.8 | 29.5 | 44.1 | Modified wheat straw |
| 9.8 | 24.5 | 45.1 | Corn |
| 13.8 | 34.5 | 43.1 | Modified corn |
Modified corn, which has the highest absorption capacity and amount of adsorption from sulfate, has been considered as a sample that shows the effects of different parameters on its adsorption.
Table 2 shows the conditions and results of absorption by modified maize at various temperatures. The effect of temperature on adsorption absorption capacity is also given in Fig. 1. It can be seen that with increasing temperature, the modified corn absorption capacity decreases.
Table 2: The effect of temperature on the amount of sulfate adsorption by corn modified
| Absorption (%) | Absorption capacity (mg/g) | Concentration of sulfate after absorption (mg/l) | Temperature (ºC) |
| 13.8 | 34.5 | 43.1 | 25 |
| 13.48 | 33.7 | 43.26 | 35 |
| 13.12 | 32.8 | 43.44 | 45 |
| 12.88 | 32.2 | 43.56 | 55 |
| 12.16 | 30.4 | 43.92 | 65 |
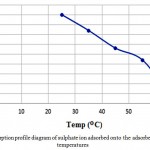 |
Figure 1: Adsorption profile diagram of sulphate ion adsorbed onto the adsorbent at various temperatures
|
Table 3 shows the modified corn absorption conditions as well as numerical results of adsorption at different mixing times. The diagram is also shown in Fig. 2. It can be seen that by increasing the mixing time, the absorbance of the absorbent material can be increased to some extent. But it should be noted that after some time the adsorbent is saturated and the amount of adsorption is not increased with increasing mixing time. As shown in Fig. 2, the mixing time of 90 min is optimal.
Table 3: The effect of mixing time on the amount of sulfate adsorption by corn modified
| Absorption (%) | Absorption capacity (mg/g) | Concentration of sulfate after absorption (mg/l) | Mixing time (min) |
| 1.72 | 4.3 | 49.14 | 30 |
| 6.84 | 17.1 | 46.58 | 60 |
| 13.8 | 34.5 | 43.10 | 90 |
| 13.82 | 34.55 | 43.09 | 120 |
| 13.82 | 34.55 | 43.09 | 150 |
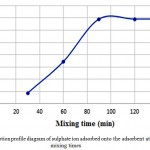 |
Figure 2: Adsorption profile diagram of sulphate ion adsorbed onto the adsorbent at various mixing times
|
Table 4 shows the conditions and results of the modified maize absorption process based on changes in the amount of adsorbent in a constant concentration solution. The Chart is also shown in Fig. 3. It can be seen that by increasing the amount of adsorbent, the absorption capacity will be increased to a certain extent, but ultimately will reach a final and saturated amount.
Table 4: The effect of absorbent amount on the amount of sulfate adsorption by corn modified
| Absorption (%) | Absorption capacity (mg/g) | Concentration of sulfate after absorption (mg/l) | Absorbent amount (gr) |
| 0.22 | 2.2 | 49.89 | 0.05 |
| 3.24 | 16.2 | 48.38 | 0.1 |
| 9.36 | 31.2 | 45.32 | 0.15 |
| 13.8 | 34.5 | 43.10 | 0.2 |
| 17.8 | 34.6 | 41.10 | 0.25 |
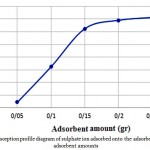 |
Figure 3: Adsorption profile diagram of sulphate ion adsorbed onto the adsorbent at various adsorbent amounts
|
Table 5 shows the conditions and results of the study of changes in the effect of sulfate concentration. The effect of changes in absorption capacity is also presented in the diagram as shown in Fig. 4. It can be seen that the absorption capacity is increased with increasing concentration of sulfate.
Table 5: The effect of sulfate concentration on the amount of sulfate adsorption by corn modified
| Absorption (%) | Absorption capacity (mg/g) | Concentration of sulfate after absorption (mg/l) | Sulfate concentration (mg/l) |
| 13.8 | 34.5 | 43.1 | 50 |
| 2.936 | 36.7 | 242.66 | 250 |
| 1.777 | 40 | 422 | 450 |
| 1.329 | 43.2 | 641.36 | 650 |
| 1.077 | 45.8 | 840.84 | 850 |
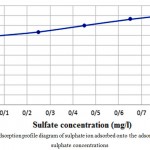 |
Figure 4: Adsorption profile diagram of sulphate ion adsorbed onto the adsorbent at various sulphate concentrations
|
Conclusion
Adsorption batch tests for sulphate (SO42-) removal from aqueous solution by corn and wheat straw and their modified samples were studied. The initial results showed that modified corn had the best absorbance among the samples. It was observed that with increasing temperature, the adsorption rate decreases due to the thermostability of the reaction. Also, increasing the time before reaching a saturation state, the absorption capacity is increased.
References
- Westall, J.C.; Chen, H.; Zhang, W.J.; Brownawell, B.J. Sorption of linear alkylbenzenesulfonates on sediment materials. Environ. Sci. Technol. 1999, 33, 3110–3118.
CrossRef - Albanese A, Tang PS, Chan WC; The effect of nanoparticle size, shape, and surface chemistry on biological systems. Ann Rev Biomed Eng 2012, 14, 1-16.
CrossRef - Deryabin DG, Aleshina ES, Vasilchenko AS, Deryabina TD, Efremova LV, Karimov IF and Korolevskaya LB, Investigation of copper nanoparticles antibacterial mechanisms tested by luminescent Escherichia coli strains. Nanotech in Russia 2013,8, 402-408.
CrossRef - Sekler I, Sensi SL, Hershfinkel M, Silverman WF, Mechanism and regulation of cellular zinc transport. Mol Med 2007, 13, 337–43.
CrossRef - Michaluk A, Kochman K., Involvement of copper in female reproduction. Reprod Biol 2007, 7, 193-205.
- Novak, J.M.; Busscher, W.J.; Laird, D.L.; Ahmedna, M.; Watts, D.W.; Niandou, M.A.S. Impact of biochar amendment on fertility of a southeastern coastal plain soil. Soil Sci. 2009, 174, 105–112.
CrossRef - Peterson, S.C.; Jackson, M.A. Simplifying pyrolysis: Using gasification to produce corn stover and wheat straw biochar for sorptive and horticultural media. Ind. Crops Prod. 2014, 53, 228–235.
CrossRef - Srinivasan, P.; Sarmah, A.K. Characterisation of agricultural waste-derived biochars and their sorption potential for sulfamethoxazole in pasture soil: A spectroscopic investigation. Sci. Total Environ. 2015, 502, 471–480.
CrossRef - Chen, B.L.; Chen, Z.M. Sorption of naphthalene and 1-naphthol by biochars of orange peels with different pyrolytic temperatures. Chemosphere 2009, 76, 127–133.
CrossRef - Zhang, J.; Liu, J.; Liu, R.L. Effects of pyrolysis temperature and heating time on biochar obtained from the pyrolysis of straw and lignosulfonate. Bioresour. Technol. 2015, 176, 288–291.
CrossRef - Zhang, P.; Sun, H.W.; Li, Y.; Sun, T.H. Adsorption and catalytic hydrolysis of carbaryl and atrazine on pig manure-derived biochars: Impact of structural properties of biochars. J. Hazard. Mater. 2013, 244–245,217–224.
CrossRef

This work is licensed under a Creative Commons Attribution 4.0 International License.


