

Manuscript accepted on : 12 December 2017
Published online on: --
Ghodrati Alireza
Faculty Member of Gilan Agricultural and Natural Resources Research and Education Center, Gilan, Iran.
DOI : http://dx.doi.org/10.13005/bbra/2588

ABSTRACT: One of the most important factors leading to occurrence of We usually use flood is weather phenomena, such as Severe cloudbursts and accomplishment of the It should be removed .Climate study and identification of weather phenomena, especially the cloudbursts have an important role in forecasting the floods and making flood warning plans. Therefore, this research has been conducted in order for Climate analysis of the cloudbursts leading to flood in west of Gilan Province. For this purpose, statistics of floods and local cloud bursts related to each flood in west region of Guilin were identified and drawn out since 2001-2011. Accordingly, during this period of time 13 floods and local clod bursts were identified, then in the next stage, serological isobar plans for sea level and 500 1000 hectopascal geopotential for pre –rainfall days and rainfall day received from NOAA diagram and was observed using isometropia analysis method And each one was analyzed using the GrADS software for mapping required at ground level .Curbing and reducing of flood damages has a special status in exhaustive management of watershed areas. Thus, precise identification of flood-prone regions on field level is extremely important and significant, since we can reduce flood-proneness level of the field using proper watershed procedures, either constructional or non-constructional, or a combination of both. In order to determine the hydrograph of the runoff resulting from precipitation under the fields, HEC- HMS mathematical model, in which precipitation’s change into runoff is done, based on hydrological methods, has been utilized. In the present research, the calibration and validation results of model HEC- HMS indicated that in case of presence of dry condition, initial damages coefficient in this field would be equal to 15.0 , A coefficient for calculating the concentration time under the fields based on relation in Tamar field would be 4.0, and B coefficient for all subfields would be equal to 3.0 and the ratio of saving coefficient to concentration coefficient in Tamar field would be 4.0 , based on which we can see that the observed and simulated hydrograph has high correlation. After calibrating and validating the model, prioritization of the subfields in terms of their participation in output flood (flood-proneness analysis) was examined. Based on flood-proneness studies in Tamar field we can conclude that upper subfields have had the greatest effect on flood-proneness level with regard to the selected floods in the field.
KEYWORDS: Rainfall and Runoff; Flood; Pressure System
Download this article as:| Copy the following to cite this article: Alireza G. Analysis of Synoptic Showery Rain falls Contributing to the Formation of Flood Within Rivers of Gilan Province. Biosci Biotech Res Asia 2017;14(4). |
| Copy the following to cite this URL: Alireza G. Analysis of Synoptic Showery Rain falls Contributing to the Formation of Flood Within Rivers of Gilan Province. Biosci Biotech Res Asia 2017;14(4). Available from: https://www.biotech-asia.org/?p=28674 |
Introduction
One of the most important factors leading to occurrence of flood is the sever rain full occurring in different seasons of year according to location, formation, and features of weather cumulus in different levels of the atmosphere, therefore identifying of these systems and definition of rainfall samples leading to flood, has an important role in forecasting the flood and will help managers to make decision and strategies for confronting and controlling the flood. To date, there is an average of 2-3 floods per year in the west of Gilan, therefore this research has adopted sinological analysis in order to study the cloudbursts leading to flood. Lashkari (1996) studied the sinological samples of hearty rainfalls in southwest of Iran in his research. With regard to serological analysis of earth’s surface plans from 850,700, and 500 hectopascal, Lashkari has concluded that occurrence of heavy and flooding rain falls in southwest of Iran is due to the severe of the activity of Sudanese monsoon low – pressure center and the convergence area of red sea and conversion of them to dynamic and thermodynamic systems. Khoshhal dastjerdi (1996) studied the climatology of rainfalls and the findings revealed that they were more than 100mm in coasts if the Caspian sea and has concluded that these rainfalls are due to the enforced cumulus of breeze of the sea and they were transferred to the coast by synoptic system and increasing of rainfalls in Alborz northern foothills affected by up going winds. Ashjee Bashkand (2000) studied the sinological samples of heavy rainfall in northwest of Iran. In this research by focusing on rain falls for 24 hours , 30mm or more in a period of 5 years (1992-1996) and by asking of climatological plans and statistics and using the formation from synoptic stations of northwest area, he concluded that most of the heavy rain falls in northwest were occurred in spring or autumn. Johann bakhsh Asia and Zolfaghari (2001) studied the sinological samples of daily rain falls in west zone .Outcomes of this study implied the existence of a meaningful variance in lower centers sample and intensity of synoptically samples frequency of occurrence , and the direction of low pressure centers motion. Najrsalighe (2001) investigated the summer rain falls in southeast of Iran since 1993-2005 and he has concluded that two samples of different pressures – dynamic attraction between pressure of lower and upper latitudes causes to creation of cumulus and weather up going -2 global warming causes to creation of low pressure thermal weather and weather up going . Moradi (2001) sinologicaly studied the flood on 21 of November in 1996 in central part of Mazandaran province and he observed the influence of high – pressure cumulus on earth’s surface and the existence of had in upper levels of the atmosphere as the main reason for rain fall Moradi (2001) studied the sinological rain full in southern coasts of Caspian sea in six cold months and he expressed the influence of high – pressure cumulus in earth’s surface the main reason of rain fall that the center of this cumulus is located on Black sea. Mohammadi (2002) by sinological studied of rain falls in southern coasts of Caspian sea in six cold months has concluded that heavy rainfall occurrence in level of 500 hectopascal is due to the influence of cumulus over black Sea from west to center of Europe , east of Mediterranean sea. Arabi (2006) by sinological study of rain fall on 21 of July in 2006 has concluded that spreading and intervention of low – pressure systems from north causes rainfall occurrence in this period. In different studies foreign researchers have discussed the sinological reasons of flooding rainfalls such as, Angle et al ,1992 : Dunkerton et al ., 1986 Divis et al ., 1992 ., and Havvey et al ., 2004; they have described the flooding rainfall occurrence in some areas of middle East such as southern , southwest and western and central areas are due to Sudanese low – pressure system or low- pressure system of Red Sea . Luckman and Giakam (1994) studied the influences of sinological and planetary rainfall on flush based over 28 years samples. Yarnal and franks (1997) believed that storms coming from Atlantic ocean play an important role in flowing of Susquehanna River. Konrad (2001) by study of 312 heavy rainfall, has identified 14 parameters and sinological features related to heavy rainfalls accordance and according to these parameters he has represented a sinoligical sample for classification of heavy rainfall .Increase in floods and their resultant damages in most of watershed fields in the country, has necessitated determining and prioritizing flood-producing regions from the perspective of flood control more than before. Prioritizing crisis regions in the form of flood prediction and alarm systems designing projects is of special importance .the flood-proneness intensity of subfields by solely analyzing the present data. Therefore, the importance of hydrological mathematical models in determining flood-proneness of fields is undeniable. With the aid of hydrological models we can determine the flood-proneness of the fields by using a flood-proneness index and analyzing output simulation hydrographs. One of the common analyses in hydrology is surface runoff estimation in a watershed based on rainfall distribution. Regarding watersheds’ real situation due to lack of sufficient data in one hand and complexity of hydrological systems on the other hand causes inevitable use of rain-fall-runoff simulation models. Since measurement of all parameters affect watershed’s runoff is impossible, choosing a suitable model whit simple structure, minimum input data requirements and reasonable precision is essential Yugo, Z (2007). One of the hydrologic models that meet these criteria is HEC-HMS which has been used widely in different stud-is Garsia, A(2008), Radmanesh, F(2006),Kneble, M(2005), Besharati T (2006). Shaghaeghi Fallah applied HEC-HMS model to simulate river flow in Mohammadabad watershed (located in north of Iran). The results indicated that the model calibration needs accurate information. Simulation results were reliable and valid in comparison with observational data obtained by Yusop, Z (2007). Al-ahmadi has done rainfall-runoff modeling using HEC-HMS, GIS and RS in three sub-basins in southwestern Saudi Arabia. He performed the model run with automatic calibration method and obtained credible results. Arekhi McColl and Agent (2001) used HEC-HMS model to predict land use patterns. They extracted watershed characteristics using HEC- GeoHMS and GIS technique and also used SCS unit hydro-graph method for runoff estimation. Considering initial loss as sensitive parameter and choosing mean squares error method for model calibration, the results showed that HEC-HMS model has high predictability than that of Shaghaeghi Fallah (2001). Radmanesh et al. (2006) calibrated and validated the HEC-HMS model in Yellow River watershed in southwestern Iran. The results showed a proper agreement between the peak discharge of observed and simulated hydrographs of Stone (2001). Momcilo et al. (2007) applied HEC-HMS model in northeastern Illinois to study the variation in peak flow originating from precipitation increase at 12 stations using daily rain-fall data presented by Sharifi (2004). Yusop et al. (2007) have studied runoff characteristics using HEC-HMS model in Oil Palm catchment in Malaysia and they obtained satisfactory results.
Material and Method
The study area consisted of Western part of Guilin province and it politically contains Astar , Talesh and Rezvanshahr cities. According to UTM geographical system, this area is located between geographical longitude and latitude of 283597. 78m and 342782. 40m and 41438.75m and 4258558.20min zone, respectively. The area is about 3234 square kilometer which has been formed of 2615 square kilometer of mountains and 620 square kilometers of low and plains. The important rivers in the area are Astarachay Havigh, Karganrood, Navrood, Dinachal, Shafarood and Lisar. The maximum height in western rivers of Guilan flush is located in Talesh Mountains with high of 28 meters lower than sea level in Astara. Figure 1 illustrates the location of the area in Guilan province.
Method
The study begins with referring to the dates of flood occurrence in the last decade and the amount of damages reported by crisis management organization of Gilan province. According these information in this 10 years, 38 damaging floods have occurred in west of Gilan. For performing sinological analysis of flooding rainfalls, it is essential to distinguish the regional rain full from local rainfalls. To do this, the statistics of daily cloudbursts of synoptic stations of Anzali and Astra for the statistical period of 2001 – 2011 and the statistics of daily amount and maximum amount for hydrometric station in area were collected .Therefore, the days of rainfall occurrence leading to flood were identified and 13 floods related to this 10 years were detected, then sinological plans related to these 13 floods in tow lever of 500 hectopascal and earth’s surface since 48 hours be fore beginning if rainfall to the end of it, were drawn out .After understanding and interpretation of sinological plans of selected floods , the influential sample of sinological circumstances of floods in the area were identified and represented. Flowing of relocation of normal cycles in formation of producer components of general rotations of atmosphere the locations of every system during the year and month is different. So, every system has different samples in different areas. Therefore, by using several selected scales such as location and formation of systems that effect on rainfalls, the direction of their motions, weather type during of flood occurrence, and frequency of every similar system have been differentiated and have been divided into 7 samples. After derivation of samples and rainfalls leading to flood and determining of their frequency, the most important sample of rainfalls leading to flood in the west of Gilan was identified and the influence of high – pressure system on flood occurrence in west of Gilan was investigated as the first hypothesis of this research. Moreover, to prove or to refuse the second hypothesis (the frequency of rainfalls leading to flood in spring and summer is further than other seasons) one-sided variance analysis test (Anova) was utilized. In order to determine the hydrograph of the runoff from precipitation based on the type of the method of changing precipitation into runoff, which would include hydrological or hydraulic navigation, we can use various mathematical models. The selected model must be calibrated and validated against the registered data of precipitation-runoff. Later we can determine the flood-proneness of each subfield by determining the peak output discharge after eliminating each subfield based on design precipitation and/or historic precipitations. In this article, HEC- HMS hydrological method has been used for changing precipitation into runoff for the purpose of navigating subfields. HEC- HMS model, in this research, has been calibrated and validated based on SCS- CN, for calculating seepage, hydrograph method of Clarke unit in navigating subfield was employed. The above methods are explained briefly later. It is to be mentioned that base flow in implementing the model was not taken into consideration and the aforementioned floods have been simulated without base flow. For the purpose of calibrating and validating HEC- HMS model, important floods, with remarkable volumes and peak discharges and proper shape of hydrograph for calibration and validation of the model, were selected. After the date of the flood was determined, correspondent precipitation of the flood was also collected from hyetograph centers in the region. Then, the influence of each of the subfields in the generation of output flood is obtained. The subfield which has the greatest participation in generating output flood of the field is identified as the most flood-prone subfield, and other subfields are prioritized according to their participation output flood. In order to determine the flood-proneness of subfields two indexes are defined as follows: In order to calibrate and validate HMS precipitation-runoff model, like other models, first, the observational hydrograph of the floods in the site of hydrometric stations, daily precipitation statistics, and the hourly statistics of precipitation in each of the subfields were provided. In the second phase, after collecting statistics, they were analyzed in order to control the coordination of the amount and the temporal distribution of precipitation with the shape and the size of observed flood hydrograph. It should be note that there is a possibility that some of the selected floods could be eliminated due to discordance between precipitation and runoff. Discordance and disproportion between precipitation size and runoff is observed mostly in floods with high peak Discharge.
Result and Discussion
Sinological Samples of Flooding Rainfalls in West of Guilan
According to outcomes of isometropia analysis of sinological plans of selected clod bursts 7 effective sinological samples in flooding rainfalls accordance were identified which are as follows
Sample A: high – pressure of north of Europe Whit Sudanese low – pressure
Sample B: Siberian high – pressure Whit Sudanese low – pressure
Sample c: Mediterranean high pressure With Sudanese low – pressure
Sample: high – pressure system of Europe.
Sample F: high – pressure Mediterranean system and high – pressure system of Europe.
Sample G: high– pressure of Siberia.
All of these 7 samples, high – pressure system have an important role. For identifying the affective weather cumulus in creation of flooding rain falls the frequency of every system way was calculated in cloudburst as presented in table 4.
Table 1: Frequency of weather cumulus rainfall leading to flood in west of Gilan
| sample | Name of the system | frequency | percentage |
| A
B C D E F G |
high – pressure of north of Europe – Sudanese low- pressure
Siberian high – pressure- Sudanese low – pressure Mediterranean high – pressure- Sudanese low- pressure High- pressure of Siberia and north of Europe Mediterranean and Sudanese low – pressure High – pressure of north of Europe Mediterranean high- pressure sample – high – pressure of north of Europe Siberian high – pressure Sample High- pressure of Siberia |
3
1 3 2 2 1 1 |
23.07
7.69 23.07 15.38 15.38 7.69 7.69 |
| Total | 13 | 100 |
As you see in table 1 the outmost frequency is related to high – pressure sample of northern Europe – Sudanese low – pressure sample and Mediterranean high – pressure sample of Sudanese low – pressure that these two systems of cumulus have maximum influence in creation of rain falls in west of Gilan and cause to flood occurrence and damages. Moreover, to identify the effective systems in creation of flooding rainfalls every system was calculated in all cloudbursts as shown in table 2.
Table 2: Frequency of total high – pressure and low – pressure system
| Kind of system | Frequency | Percent tag of frequency |
| Only high – pressure system
Only low – pressure system Both of the system |
4
0 9 |
30.77
0 96.23 |
| Total | 13 | 100 |
As you see in table 6 from total 13 cloudbursts , 4 cloudbursts were created due to the activity if high – pressure systems and 9 other cloudbursts were created due to the high pressure systems with law – pressure systems that cause creation of flooding cloudbursts – which means that in whole 13 available cloudbursts high – pressure system have interfered and regarding the percent of frequency there is 100 percent for existence of high – pressure systems – which accordingly the first hypothesis of research has been supported and has been proved completely. To prove or to reject the second hypothesis based on the frequency of cloudbursts causing flood in spring and summer is further than other seasons of year frequency of seasons that flood occurred in them have calculated.
Table 3: frequency of seasons that have flooding cloud bursts in last decade in of Gilan.
| season | Frequency | Percentage |
| Spring
Summer Autumn Winter |
4
6 2 1 |
30.77
46.15 7.69 13.38 |
| Total | 13 | 100 |
Table 3 shows that 50 present of flooding rain falls have occurred in summer and winter. To reject or to prove the second hypothesis using SPSS software and one-sided variance analysis test (Anova) showed that there isn’t any significant relationship in level of 5 percent during different seasons of year regarding the number of accordance in cloudbursts leading to flood .With making field model, meteorology model and control models for each of calibration floods (table 4), first precipitation-runoff process was simulated with preliminary amounts of parameters. The function of the model was examined by comparing the hydrograph of the simulated and calculated flood in Tamar hydrometric station. Despite controls on the data of precipitation and flood, each of the above events was calibrated with different but close amounts. However since the object of calibration is to determine similar parameters in precipitation-runoff model, in order to get similar parameters for all upper subfields of Tamar hydrometric station, different examinations were implemented. Finally, the parameters offered in table 6 were considered as the final parameters of calibration stage and also for validating precipitation-runoff model.
Table 4: final calibration parameters on the level of Tamar field
| The final values for Validation | Calibration parameters |
| 0.15 | Initial loss coefficient |
| 0.1 | coefficient A in focus time |
| 0.3 | coefficient B in focus time |
| 0.4 | proportion C in reserve coefficient |
| 2 CRas | Motion speed (m/s) |
The amounts of final parameters of precipitation-runoff model are offered in table 4.
The results of the validation of the flood of September 2005 based on the parameters of table 4 are offered in figures 1 and 2.
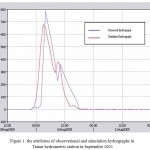 |
Figure 1: The attributes of observational and simulation hydrographs in Tamar hydrometric station in September 2005
|
 |
Figure 2: observational and simulation hydrographs in Tamar hydrometric station in September 2005
|
Flood-proneness after calibrating and validating the model, prioritizing subfields from the viewpoint of participation in the output flood (flood-proneness analysis) was examined. Since the events of August 2001 and August 2005 are considered the biggest available events, determining the prioritizing of flood-proneness of subfields was done based on the absence of the effect of output Discharge of the whole field and through relation 2. These results were offered in the form of flood-proneness maps and based on f index. An illustration of the controversy resulting from the flood disaster has resulted in Flood No. 4, September 20, 2009. An analysis of its uniformity led to the September 19-September 23 floods
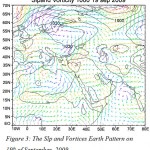 |
Figure 3: The Slp and Vortices Earth Pattern on 19th of September, 2009
|
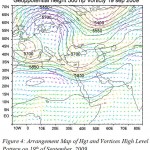 |
Figure 4: Arrangement Map of Hgt and Vortices High Level Pattern on 19th of September, 2009
|
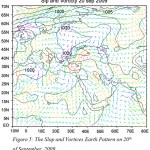 |
Figure 5: The Slap and Vortices Earth Pattern on 20th of September, 2009
|
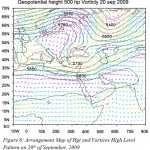 |
Figure 6: Arrangement Map of Hgt and Vortices High Level Pattern on 20th of September, 2009
|
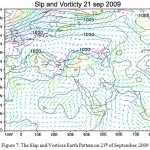 |
Figure 7: The Slap and Vortices Earth Pattern on 21th of September, 2009
|
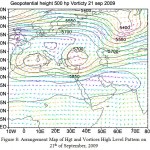 |
Figure 8: Arrangement Map of Hgt and Vortices High Level Pattern on 21th of September, 2009
|
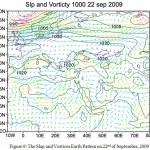 |
Figure 9: The Slap and Vortices Earth Pattern on 22nd of September, 2009
|
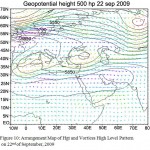 |
Figure 10: Arrangement Map of Hgt and Vortices High Level Pattern on 22nd of September, 2009
|
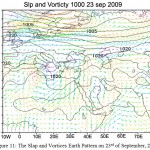 |
Figure 11: The Slap and Vortices Earth Pattern on 23rd of September, 2009
|
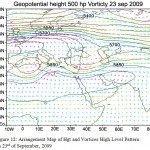 |
Figure 12: Arrangement Map of Hgt and Vortices High Level Pattern on 23rd of September, 2009
|
Conclusion
This research has been conducted to identify the kind of weather cumulus and to identify the origin of synoptic sample of heavy rainfalls causing flood in the west of Gilan and to prove or to reject two hypotheses (1: cloud bursts rainfalls in the west of Gilan and Talesh which are due to the influence of high – pressure weather cumulus. 2: the frequency of cloudbursts rainfalls leading to flood in spring and summer are higher than other seasons of year). With regard to sinological isometropia analysis of 13 flooding cloudbursts, 7 samples were identified including, high – pressure system of north of Europe with Sudanese low- pressure system, Siberian high – pressure system, Mediterranean high – pressure system with Sudanese low – pressure system, high – pressure system of Siberia, north of Europe and Mediterranean low – pressure and Sudanese systems, high – pressure system of north of Europe, Mediterranean high – pressure system and high – pressure of north of Europe and Siberian high – pressure system. The analysis of these samples have shown that the most frequency is related to high – pressure sample of north of Europe with Sudanese low – pressure system. High – pressure systems have had the most influence on creation of flooding cloudbursts in west of Gilan. Also the most frequency is related to high – pressure weather cumulus of north of Europe or Scandinavian and Mediterranean in surface of earth that with motion toward Iran and humidifying from black sea in contrast with Sudanese low – pressure warm weather or Mediterranean warm and humid weather cumulus causes flooding rain falls in the area in the middle levels of atmosphere , the existence of Siberian high – pressure and Scandinavian and Mediterranean low – pressure have had an important role in creation of these cloud bursts – that these outcomes are in accordance with findings of Moradi (2001) . He has studied the synoptic rain falls in southern coasts of Caspian Sea in six cold months and he has expressed the influence of high pressure weather cumulus in surface of earth as the main reason of rainfall occurrence whose source is located in Black sea. Simultaneously, there is a deep had in upper level that originates from low – pressure center located on Scandinavia or Iceland. The half of the floods are related to summer season, especially in September that among these, Sudanese low – pressure weather cumulus has am important role in formation of cumulus rainfalls .This finding is consistent with the outcomes of Angel et al , 1992, DunKerton et al , 1986 Divis et al, 1992, Harvey et al, 2004 . Studies since they have expressed the flooding rainfalls occurrence in some areas of Middle East such as south, southwest , west , and central areas of Iran due to the Sudanese low – pressure system or – pressure system Red sea. But the second theory based on frequency of rainfalls occurrence in spring and summer will be refused according to outcomes of one-sided variance analysis test. Although the number of flooding rainfalls is higher summer. Totally it can be said that high – pressure cumulus had an important role in flood occurrence in the west of Gilan , especially Scandinavian high – pressure system that moves toward Black sea and Caspian sea and humidifying from them , which leads to cloudburst occurrence in west of Gilan. and at the end, although the severity and amount of rain falls are one of the reasons of flood occurrence, but environmental factors have an important role in creation of floods. The west area of Gilan is consisted of high and steep mountains and rivers with fairly short concentration time that physically have potential role in creation of floods. On the other side, the Kind land usage also is one of the decreasing or in factors of flood occurrence and Whitewater creation in the area. Fair plant cover, especially existence of forests is an influential factor in decreasing of White water ratio. But the occurrence of frequent and almost annual floods in west Gilan in last year reveal the necessity of paying attention to the environmental changes and manmade land use. In this research, in order to determine the hydrograph of the runoff of precipitation in subfields, the HEC- HMS model has been used, in which the change of precipitation into runoff is done based on hydrological methods. The selected model must be calibrated and validated against the registered data of precipitation-runoff. Then, the flood-proneness of each subfield can be obtained by determining the peak output Discharge after eliminating each subfield based on a design precipitation and/or historic precipitations. In this research, calibration and validation results of HEC- HMS model in Tamar field has been offered. In Tamar field, 2 historic flood events have been used to calibrate and 1 event is used to validate. At the end, the ranking of the flood-proneness of their subfields is determined based on the most important historic flood. Based on calibration results in Tamar filed, it can be said that in case of the existence of dry climate, initial damages coefficient in this field is equal to 15.0. Furthermore, calculating concentration time of the field based on relations is in accordance with the condition of subfields and A coefficient for Tamar field was estimated at 1.0. B coefficient for the field which is assumed to be equal to 3.0.
![]()
Ratio in Tamer field was estimated 4.0, based on which the simulation of hydrograph was done with high accuracy. Also, the study showed that in simulating the behavior of a filed in proportion with precipitation, the effect of the temporal distribution of precipitation is much higher than its spatial distribution. Therefore, equipping the current stations with stability hyetography mode is essential. Otherwise, using 12-hour data of precipitation in stations instead of generalizing the temporal distribution of a stability hyetography station to the whole region in calibration is advantageous and more favorable.
Reference
- Ashjee M. Study and presentation of synoptic samples of rainfalls in northwest of Iran- Master thesis, Tarbiyat modarres University. 2000. (In Persian)
- Arabi Z. synoptic analysis of rain falls on 21th to 26th in 1999 in Iran. Geographic Researches. (In Persian). 2006;56:1-15 .
- Arekhi S, Rostamizad G, and Rostami N. Evaluation of HEC-HMS Methods in Surface Runoff Simulation (Case Study: Kan Watershed, Iran). Advances in Environ-mental Biology. AENSI. (In Persian). 2011;1316-1321.
- Besharati T. Spatial Prioritizing of Flood-Prone regions In Roodak Field Using HEC-HMS Precipitation-Runoff Simulation Model, MA Thesis in Watering, Sari Natural Resources College, ( In Persian).2006;116.
- Garcia A, Sainz A, Revilla J, Alvarez C. Surface water resources assessment in scarcely gauged basins in the north of Spain. Journal of Hydrology. 2008;356:312-326.
CrossRef - bakhsh J.A, saeed Z.H. Study of synoptic samples of daily vain falls in west of Iran.Geographic Researches, ( In Persian). 2001;63(64):234-258 .
- Ddastjerdi K.J. Study and presentation of synoptic climatology samples for rain falls more than 100 mm in southern coasts of Caspian sea , doctoral dissertation of geography , guide master , Hoshang , Ghaemi , Tarbiyat Modarres University;(In Persian). 1997.
- Kneble M, Yang Z, Hutchison K and Maidment D.R. Regional scale flood modeling using NEXRAD rainfall, GIS, and HEC-HMS / HEC-RAS: a case study for the san Antonio River Basin Summer 2002 storm event. Journal of Environmental Management. 2005;75(4):325-336.
CrossRef - McColl C and Aggett G. Land use forecasting and hydrologic model integration for improved land use decision support. Journal of Environmental Management. 2006;84(4):494-512.
CrossRef - Mmohammadreza M. isometropia Analysis of rain falls in southern coats of Caspian sea in six cold month the of year. Marine sciences and technology of Iran magazine,( In Persian). 2002;2:61-72
- Momcilo M, Angle Y. L, Hejazi M. Changing estimates for design precipitation in northeastern Illinois. Comparison between different sources and sensitivity analysis. Journal of Hydrology. 2007;347(1-2): 211-222.
CrossRef - Moradi H.R. isometropia analysis of rainfalls in southern coast of Caspian sea in six cold month of year. Marine sciences and technology of Iran magazine first comes, (In Persian). 2001;61:72.
- Moradi H.R. Synoptic study of flood on November 21 1996 in central areas of Mazandaran province. Development of geography training Magazine. (In Persian). 2001;33:41- 56.
- Omidvar K. Analysis of synoptic cad thermodynamic circumstances of rain fall occurrence in shirkoh area. Geographic Researches., 2007; 59: 81- 89.( In Persian)
- Radmanesh, F., PorHemat, J., Behnia, A., Akhondali, A.M. Calibration and assessment of HEC-HMS model in Roodzard watershed, 17th international conference of river engineering, University of Shahid Chamran, Ahvaz., 2006; 1-9. (In Persian)
- Salighe, M. Sample of summer rainfalls in southeast of Iran. Geographic Researches., 2001; 62:114-125.
- Shaghaeghi Fallah, R. Simulation of maximum peak discharge in river Tributaries using HEC-HMS model (Case study: Mohammadabad watershed, Golestan Province), M.Sc Thesis. Nattural Resources Faculty, University of Gorgan., 2001; 155. (In Persian)
- Sharifi, F., Safapoor, Sh., Ayoobzade, S. Evaluation of AWBM 2002 model in simulation of hydrological processes some of watersheds in Iran. Journal of Research and Constructional., 2004; 35-42. (In Persian)
- Seavand Rivers in Fars Province. A Collection of the Articles of the Sixth International Seminar on River Engineering, Shahid Chamran University of Ahvaz. Pp. 1068-1061. (In Persian)
- Shushtari Mahmoudian M., Majdzadeh Tabatabaee M.R., and Yousefi A. Examining and Functioning of HEC_HMS model in River Engineering; Case Study: Kordan. Journal of Research and Constructional., 2002; 31(1).
- Stone, A. S. Geospatial Database and Preliminary flood Hydrology model for the lower Colorado basin, M.Sc. Thesis., 2001; 173.
- Yusop, Z., Chan, C.H., Katimon, A. Runoff characteristics and application of HEC-HMS for modeling storm flow hydrograph in an oil palm catchment. Journal of Water Science & Technology., 2007; 56(8): 41–48.
CrossRef

This work is licensed under a Creative Commons Attribution 4.0 International License.


