

Manuscript accepted on : 05 September 2017
Published online on: --
Plagiarism Check: Yes
Fatma Chkili1,4, Marine De Person2, Christophe Colbeau-Justin3 and Manef Abderrabba4
1University of Tunis El Manar, Faculty of Sciences of Tunis, Campus University, 2092 Tunis, Tunisia.
2LETIAM, Paris South Analytical Chemistry Group EA 4041, IUT d'Orsay, Paris South University 11, Plateau de Moulon, 91400 Orsay, France.
3University of Paris-Sud / University Paris-Saclay, Laboratory of Physical Chemistry, CNRS UMR 8000, 91405 Orsay, France.
4Preparatory Institute for Scientific and Technical Studies (IPEST), Materials, Molecules and Applications Laboratory (LMMA), BP 51 La Marsa 2070, Carthage, Tunisia.
Correspondence Author E-mail: touma.at@gmail.com
DOI : http://dx.doi.org/10.13005/bbra/2527

ABSTRACT: This work aims to obtain treated olive mill wastewater (OMW) that can be used in other processes such as irrigation in agricultural production. The oxidative degradation and adsorption kinetics of the OMW were investigated by means of photo-catalysis in the presence of TiO2. The UV irradiation was chosen for this reaction rather than visible light since it eliminated 97% of the color versus 40 % with visible. It was also capable of reducing total organic carbon (TOC) and total phenolic compounds (TPhC) sufficiently after 4h of treatment. The extent of photocatalytic degradation increased with increasing TiO2 concentration up to 1 g/L, above which degradation rate declined. Furthermore, the OMW treatment didn’t require a pH value adjustment; whereas it was enhanced with the addition of hydrogen peroxide. The catalyst activity on repeated use was evaluated and after four successive cycles, its efficiency was maintained. Various commercial photocatalysts were tested and compared for OMW degradation efficiency.
KEYWORDS: olive mill wastewater; photocatalysis; polyphenols; Titanium dioxide
Download this article as:| Copy the following to cite this article: Chkili F, Person M. D, Colbeau-Justin C, Abderrabba M. The Olive Mill Waste Water Decontamination with Photocatalysis Based on Tio2: Effect of Operational Parameters. Biosci Biotech Res Asia 2017;14(3). |
| Copy the following to cite this URL: Chkili F, Person M. D, Colbeau-Justin C, Abderrabba M. The Olive Mill Waste Water Decontamination with Photocatalysis Based on Tio2: Effect of Operational Parameters. Biosci Biotech Res Asia 2017;14(3). Available from: https://www.biotech-asia.org/?p=27376 |
Introduction
The manufacture of olive oil is mainly localized in the Mediterranean basin with an amount of 2.5 million tons annually, which presents 90% of the worldwide production.1 It is an economically important field for the majority of the Mediterranean Sea countries (Spain, Italy, Tunisia, Turkey, Greece and Morocco).2
This industry generates huge quantities of olive mill wastewater (OMW), which causes major problem and an obstacle in its detoxification. This effluent is highly toxic to the environment since it is rich in organic (15-18%) and inorganic compounds (2%). It essentially contains water, organic acids and high molecular weight polyphenols such as tannins, antocyanins and catechins, which represent the main toxic components as well as the monomeric phenols and some minerals.3 Common disposal practices for OMW are generally direct discharge into sols and use of evaporation ponds or lagoons.4 But these techniques have led to the contamination of the surface and ground waters.
Many processes such as physical, chemical, thermal and biological treatment have been investigated in order to remove the organic matter and make it possible to discharge the treated OMW in the environment. But most of these methods require a pre-treatment of the pollutant such as adsorption or flocculation. Over the last few decades, many researches were interested in heterogeneous photocatalysis in water decontamination which is much more advantageous since it occurs at ambient temperature and atmospheric pressure. Titanium dioxide has been one of the most investigated photocatalysts due to its various properties. It is an available material with a high photocatalytic activity, thermal and photochemical stability, low cost and non-toxic aspect. However, it is limited with the fast charge-carrier recombination and the activation only under UV irradiation with wavelengths shorter than 400 nm.5 The photocatalytic activity of TiO2 was observed for the first time in 1972 by the reaction of water photolysis.6 Many studies have been then performed for the environmental applications of this photocatalyst as the removal of organic pollutants in water and air. They were concentrated on measuring the TiO2 activity and searching for new synthesis procedures to enhance its efficiency especially in visible light.7 While there are few studies interested in its photocatalytic activity particularly in the decontamination of OMW.8 In this work, we focused on the different parameters of the photocatalytic decontamination of OMW with TiO2 in order to enhance and optimize the degradation rate in terms of color, TOC and TPhC removal. The equilibrium adsorption experiments were also studied based on the Langmuir Henshelwood and Frundlich models.
Materials and methods
OMW was collected from a 3-phase centrifugation olive oil production unit in Sfax area (Tunisia). It was filtered to remove most of the total solids and to reduce the organic load before use, then it was stored in a plastic container in the refrigerator. It is characterized by an intense olive oil smell and a black-brown color. In our experiments, we used different commercial photocatalysts based on titanium dioxide (TiO2). Their characteristics are resumed in the Table 1.
The phenolic standards for HPLC analysis were purchased from Fluka, Sigma Aldrich: Caffeic acid (≥ 98.0%), 3-Hydroxytyrosol (≥ 98.0%), 4-Hydroxy-3-methoxycinnamic acid (≥ 99.0%), Tyrosol (≥ 99.5%) and Vanillic acid (≥ 97.0%). Folin Ciocalteu’s phenol reagent (2M) was obtained from Sigma Aldrich.
UV/Vis diffuse reflectance spectrum of TiO2 (DRS) was obtained in a wavelength range of 200–800 nm using a spectrophotometer Agilent Technologies Cary 500 with PTFG as reference. The light absorption of the photocatalyst was studied and the band gap energy was calculated by:
The absorption edge (λg) is the intercept of the tangent to the wavelength axis.
Table 1: Photocatalysts characteristics
| Photocatalyst | Particle size (nm) | Surface area (m2.g-1) | Anatase (%) | Rutile (%) |
| P25(Evonik) | 22 | 51 | 79 | 21 |
| PC500 (Cristal Millennium) | 5-10 | 317 | 100 | 0 |
| PC50 (Cristal Millennium) | 20-30 | 54 | 100 | 0 |
| PC10 (Cristal Millennium) | 65-75 | 10 | 100 | 0 |
| Rutile | – | – | 0 | 100 |
| Anatase (Prolabo) | 100 | 8 | 100 | 0 |
| Anatase (Fluka) | 100-400 | 9 | 100 | 0 |
The concentration of phenolic monomers was determined by high-performance liquid chromatography (HPLC) using a Shimadzu chromatograph equipped with a UV detector at a fixed wavelength of 280 nm and a C-18 column. The mobile phase used was composed of 0.1 % acetic acid in water (A) and acetonitrile (B) for a running time of 40 minutes with a flow rate of 0.8 mL/min. The following proportions of solvent (B) were used during the analysis : initial 5 % for 2 min,10% in 6 min, 20% in 17 min, 70% in 15 min.
The efficiency of photocatalytic experiments was controlled according to the main environmental indicators of OMW, namely color, TOC and TPhC. The absorbance was scanned in the 200-800 nm wavelength regions on a Varian Cary 300 scan spectrophotometer. The color removal was monitored by measuring the absorbance at 395 nm9. TOC measurements were carried out using a Shimadzu TOC–LcpH analyzer in order to check the total polyphenols mineralization into CO2 and H2O. The TPhC was determined with the Folin Ciocalteu method using Gallic acid as standard for the calibration curve. Aliquots of Gallic acid solutions (100 mL) were mixed with 5 mL of Na2CO3 (2% in NaOH, 0.1M) and 0.5 mL of Folin Ciocalteu’s reagent. After 2h of incubation, the absorbance was measured at 750 nm.10 For all analysis, the removal efficiency and the normalized concentration was calculated by the following equations:
and
![]()
Crude OMW was diluted prior to photocatalytic treatment to decrease the concentration of toxic compounds and make it easier to reach the required standards for the final product. The photo-degradation reaction was carried out in a 300 ml cell reactor in the presence of photocatalyst suspension in the OMW solution, bubbled with oxygen at a fixed flow rate of 20ml.min-1. UV irradiations were provided by a 365 nm mercury lamp protected by an enclosure cooled by circulating water. Adsorption studies suggested that the solution should be magnetically stirred in the dark for 60 minutes to ensure the equilibrium between adsorption and desorption before irradiation. Preliminary control experiments were performed to ensure that adsorption had reached equilibrium. Briefly, 1g/L of catalyst was dispersed into the solution and stirred in the dark for 90 min before irradiation. Samples were taken periodically at regular time intervals and were immediately separated in a Sigma centrifuge at 4200 rpm for 30 min and filtered with a 0.2 filter to avoid further reaction.
Results and Discussion
Characterization of TiO2P25 Powder
According to Fig.1, the TiO2P25 powder presented an important absorption capacity in the UV region leading to a high photocatalytic activity which is confirmed in our experiments later. It might be used also under visible light since it presented a red shift around wavelength of 410 nm. The absorption edge λg is approximately located at 395 nm. Therefore, the band gap energy could be calculated as 3.02 ev.
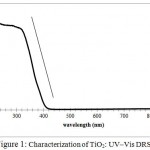 |
Figure 1: Characterization of TiO2: UV–Vis DRS
|
Adsorption Equilibrium and Kinetic Model
Photolysis and Adsorption
In order to evaluate the effect of direct photolysis11 on the degradation of phenolic compounds present in the OMW solution, separate experiments were conducted with a 365 nm UV lamp. We noticed that under irradiation and in the absence of the photocatalyst, a decrease of 12% of the color intensity was observed which demonstrates that direct photolysis was negligible. In the presence of TiO2 and in the dark, there was a significant fading in the first minutes of agitation. Then, the absorbance at 395 nm remained practically constant after 60 minutes. This phenomenon is attributed to the important adsorption on the surface of TiO2. This step is crucial for the progress of the photodegradation reaction. The adsorption peak position of OMW aqueous solution remained the same with the different diluted solutions (Fig.3) illustrating that the fading was caused by a physical adsorption on the TiO2P25 surface. In simultaneous presence of TiO2 and UV, irradiations of the mixture lead to a transparent solution after 240 minutes. This confirmed the nature of the photocatalytic reaction of the OMW decontamination.
Adsorption Equilibrium
Adsorption experiments were conducted at different initial concentrations of polyphenols (diluted solution). The color removal results show that adsorption equilibrium practically occurred within the 30 minutes and then remained unchanged regardless of the concentration. Therefore, 1 hour was selected in all subsequent experiments for the adsorption period in the dark before UV irradiation to ensure that the initial degradation initiates at the equilibrium of adsorption/desorption of organic compounds.
In contrary to adsorption equilibrium duration which didn’t change with the concentration, the adsorption capacity of P25 was enhanced when polyphenols concentration decreased. For example, after 60 min, the adsorption rate reached 25.6% and 49.1% at high (600 ppm) and low (100 ppm) concentrations respectively. This is due to the fact that at low concentration, phenolic compounds were well dispersed in the solution and reached the photocatalyst surface easily. The titanium dioxide had a high adsorption rate related to its relative high specific area (51m2.g-1).
Fig.2 (a) describes the surface adsorption isotherms: Qe (equilibrium adsorbed amount of material) increased with increasing Ce (equilibrium concentration of the solution). Therefore, polyphenols adsorption equilibrium was evaluated by the Langmuir and Freundlich isotherm models.12
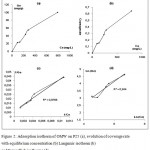 |
Figure 2: Adsorption isotherm of OMW on P25 (a), evolution of coverage rate with equilibrium concentration (b) Langmuir isotherm (b) and Freundlich isotherms (d)
|
Langmuir isotherm theory is based on the assumption of adsorption on a homogeneous surface and admits the following equation:
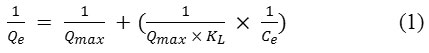
While the Freundlich model suggests that the adsorbent has a heterogeneous surface with adsorption sites that have different adsorption energies described by the equation:
![]()
Where KL is the Langmuir equilibrium constant that shows the affinity of binding sites, KF is the Freundlich constant related to the adsorption capacity of the adsorbent and n is a constant indicating greatness of adsorbate-adsorbent relationship. Qmax is the maximum amount that can be adsorbed on the catalyst.
The amount of adsorption at equilibrium Qe (mg/g) and the coverage rate were computed as follows:
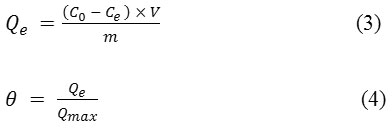
Whatever was the initial concentration of OMW, the amounts of polyphenols adsorbed at equilibrium were lower than the maximum and decreased with decreasing the pollutant concentration. They varied between 22 and 100 mg/g. These results show that phenolic compounds and other organic molecules are adsorbed to some extent on the catalyst surface and confirm that the dilution is essential before photo-catalysis to reduce the adsorption phenomenon on the surface of TiO2 and promote better photocatalytic degradation.
The results of the isotherm models in Fig.2 (c and d) shows that adsorption of molecules on P25 could be acceptably described by Langmuir’s (R2= 0.9766) and Freundlich’s (R2= 0.944) models.
In the Langmuir model, the calculated maximum adsorption capacity Qm was 156.25mg/g. This indicated that the monolayer sorption of polyphenols on the surface of P25 was more pronounced.
Photocatalytic Degradation
Effect of initial OMW Loading
The mechanism of polyphenols degradation is the following: Under irradiation with energy equal or superior to the band gap energy of TiO2, electrons (e–) migrate to the conduction band and consequently, holes (h+) appears in the valence band (1). These electron-hole pairs admit high reduction and oxidation ability to generate hydroxyl and superoxide radicals (2) that react with polyphenols leading to the formation of final products (H2O and CO2) (3).
TiO2 + hν → e– + h+ (1)
h+ + H2O → H+ + OH• ; e– + O2 → O2•- (2)
OH• + polyphenols → CO2 + H2O (3)
Photocatalytic treatment of the most diluted solution (100 ppm of polyphenols concentration) showed different behavior overtime in terms of fading and polyphenols decrease. After 30 minutes, polyphenols absorbance (278 nm) decreased significantly whereas the color intensity (395 nm) was still high. This result can be explained by the coagulation and the oxidative polymerization of polyphenols present in the solution which contributed to the increase of dark colored organic compounds at the beginning of the reaction.13 After this polymerization step, a coagulation of the highly condensed polymers followed by rapid sedimentation occurred leading to the fading of the OMW fraction. Therefore, an additional treatment time had only a slight influence on the decontamination. For this reason, 4 h has been chosen as duration time for later experiments.
In this experiment, we studied the effect of polyphenols dosage on the photocatalytic degradation as a function of irradiation time. The TPhC removal rate (Fig.3 (a)) increased sharply within the first 60 min for different polyphenols concentrations then it remained almost invariable for the most highly concentrated solutions while it increased continuously at the concentration of 150 ppm and 100 ppm and reached approximately 62% and 81% respectively. The color removal analysis in Fig.3 (b) shows that the fading was most pronounced in the most diluted solutions (100 ppm – 150 ppm). At this TiO2 dosage 1g/l, OMW with high concentration was not fully decolorized and color removal rate was very low. For example, the 100 ppm and 600 ppm solutions were decolorized with a percentage of 95% and 20% respectively after 4h of irradiation. The most probable explanation is that the abatement of adsorbed molecules on the surface of TiO2 in high diluted solutions contributed to a faster formation of hydroxyl radicals and more accessible active sites. When the concentration was increased, the surface of the photocatalyst became more covered with polyphenols molecules. Consequently, the transmission of UV irradiations decreased or probably, it was blocked leading to a less number of active sites for hydroxyl radicals’ generation.14
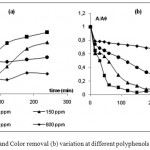 |
Figure 3: TPhC (a) and Color removal (b) variation at different polyphenols concentrations
|
On the other hand, we noticed that color removal rate was greater than that of TPhC, such for the solution at 100 ppm, its polyphenols removal was only 81% versus 95% for the color fading. In fact, other pollutants present in the solution such as ions and by-products, competed with the phenolic compounds in the reaction with the radicals.
According to Fig.4, the rate of TPhC removal was higher than that of TOC overtime. For a 100 ppm concentration, the percentages of disappearance of TPhC and TOC after 240 min were respectively 81% and 60%.
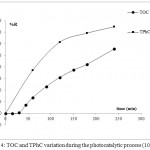 |
Figure 4: TOC and TPhC variation during the photocatalytic process (100 ppm)
|
This suggests that total mineralization required irradiation time much longer than polyphenols degradation due to the competitive adsorption on the surface of TiO2 between pollutants and intermediates products which degrade more slowly than the reactant initially introduced. Indeed, phenolic compounds were immediately broken by hydroxyl radicals while the generated by-products needed much more time for total decomposition.
These results imply the presence of organic compounds that are resistant to further oxidation since TOC was not completely removed even after 5 hours of irradiation.
Effect of TiO2 Dosage
In this study, TiO2 has been chosen as photocatalyst since it shows a maximum photocatalytic activity and is the most efficient among the other catalysts.15
The amount of photocatalyst is an important parameter for the heterogeneous photocatalytic reaction for economic and analytic purposes. We look forward to use a small quantity to ensure an inexpensive process and easier filtration of the suspension.
The effect of catalyst dosage on the photo-degradation efficiency was investigated from 0 to 2g/L of TiO2 P25. The results in Fig.5 and Table 2 show that the variations of OMW fading at 395nm and TOC values were different. In terms of color removal, an amount of 1g.L-1 of TiO2 was approximately optimal to degrade the pollutant. In the first 60 min, the color removal rate increased sharply with TiO2 amount of 0.5g.L-1 and 1 g.L-1 while it decreased at TiO2 dosage higher than 1 g.L-1.
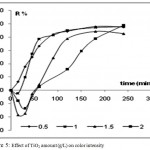 |
Figure 5: Effect of TiO2 amount (g/L) on color intensity
|
Table 2: TOC removal at different TiO2 concentrations
| Concentration (g/L) | TOC (%R) |
| 0,5 | 51,1 |
| 1 | 55,49 |
| 1,5 | 56,16 |
| 2 | 61,57 |
The likely explanation is that when TiO2 concentration increased, the adsorption rate increased and reached 70% and 80% at 1.5g.L-1 and 2g.L-1 respectively. Intense adsorption of pollutants and their derivatives onto the TiO2 surface may cause TiO2 deactivation.16 Therefore, the equilibrium of adsorption desorption was not stable and the majority of the adsorbed molecules were desorbed in the first 60 min of irradiation. Although this behavior at the beginning of the reaction, the color removal rate after 4h of irradiation was 95%, 97%, 85% and 96% at the TiO2 dosage of 0.5g.L-1, 1 g.L-1, 1.5 g.L-1 and 2 g.L-1 respectively.
On the other hand, TOC analysis shows that the mineralization was enhanced with the addition of photocatalyst. This result can be explained as following, the attacked polyphenols generate smaller molecules that were easily degraded with the excess of TiO2 while no more phenolic compounds were broken at the surface of the photocatalyst. When the catalyst concentration increased, the number of active sites on the photocatalyst surface also increased leading to an important amount of hydroxyl radicals responsible for the photocatalysis degradation. However, at high concentrations up to 2 g.L−1, TiO2 particles aggregate leading to the decline of active surface sites and the opacity of the solution opacity. Consequently, the passage of irradiations to the photocatalyst was reduced limiting its efficiency.17 According to these results, 1g.L−1 was selected as optimum catalyst concentration for OMW decontamination.
The Effect of pH Value
The influence of the pH value on the heterogeneous photocatalytic oxidation is very important since the charge of the pollutant molecules and the surface of the TiO2 are both pH dependent.18 This is due to the fact that pH influences at the same time the surface state of titanium dioxide (its point of zero charge “pzc” is 6.8) and the ionization state of the pollutant. When pH values are below the pHpzc, TiO2 particles become protonated and positively charged. However, when the pH values are above the pHpzc, the catalyst surface becomes negatively charged.
In this study, the pH was adjusted using sodium hydroxide and hydrochloric acid. The results in Table 3 and Fig.6 present the TOC, color and TPhC removal versus pH. In terms of color removal, there is no significant dependency on pH value. The solution was completely decolorized at the original, acidic and basic pH. While TOC and TPhC removal results were different. In fact, when the solution became basic (pH = 7), the rate of mineralization increased from 45% at acidic solution (pH = 2) to 58 % of TOC removal. On the other hand, when the solution became acidic, the TPhC removal was more pronounced during the reaction but after 4h of irradiation, the percentages were approximately 68%, 81% and 74% at acidic, original and basic pH respectively. We conclude that there was a slight variation of degradation rate when the pH was changed, therefore, the photocatalytic degradation of OMW doesn’t require a pH value adjustment.
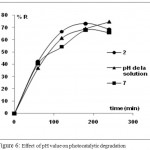 |
Figure 6: Effect of pH value on photocatalytic degradation
|
Table 3: TOC and Color removal at different pH
| pH | TOC (%R) | Color removal (%R) |
| acide | 45 | 92,94 |
| original | 55,49 | 97,05 |
| basique | 58,33 | 93,03 |
This slight variation of TPhC removal is attributed to the fact that at pH 7, the phenolic compounds were fully dissociated19 while the TiO2 surface was negatively charged which contributed to repulsive forces between the negatively charged catalyst surface and the phenolate species resulting in low adsorption 39% versus 53% at pH 2. In fact, at pH 2, the TiO2 surface became positively charged and the phenolic compounds deprotonated, then higher adsorption capacity can be achieved resulting in better degradation. Indeed, phenols are acids in liquids, and their removal from a solution reduces its acidity. We conclude from these results that the best photodegradation of phenolic compounds present in OMW effluent occurred at pH of the solution (pH 4-5).
Hydrogen Peroxide Addition
To elucidate the influence of H2O2 on the polyphenols degradation in the photocatalytic system, experiments were carried out by varying the initial H2O2 amount at constant pH, TiO2 concentration (1g/L) and irradiation time of 240 min. This study allowed highlighting the role of hydroxyl radicals in the OMW degradation since hydrogen peroxide is considered as a generating source of these radicals. The Fig.7 displays that the rate of TPhC disappearance was significantly enhanced with the addition of H2O2 and reached a maximum of 100% at 3g/L of H2O2, and then it decreased to 95% when the amount of H2O2 increased to 4g/L. TOC removal rate also increased sharply in the presence of H2O2 from 63% to 79% at 3g/L but above this H2O2 amount, it remained practically constant. This result is similar to that observed in the TiO2 dosage effect experiment where TOC values variation differ from color removal due to the presence of intermediates molecules that are more easily degraded than initial phenolic compounds.
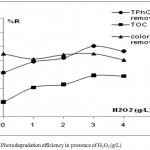 |
Figure 7: Photodegradation efficiency in presence of H2O2 (g/L)
|
The enhancement of pollutant decontamination can be attributed to the photolysis of hydrogen peroxide which generates high concentration of OH• radicals on the surface of TiO2. A control experiment with only H2O2 and no TiO2 was also conducted and confirmed that the simple photolysis of H2O2 contributed to the fading of the solution at 90 % of the initial value and lead to the oxidation of phenolic compounds because H2O2 generally functions as an efficient electron acceptor during the formation of radicals.
The experiments showed that H2O2 efficiency reached a maximum. Indeed, excess of H2O2 will react with OH• competing with pollutants contributing to their scavenging capacity abatement and consequently reducing the decontamination efficiency.20 The optimal H2O2 concentration is 3g/L for the treatment of the OMW for 4h irradiation time.
Comparison of the Photocatalytic Activities of Various Industrial TiO2 Photocatalysts
In this study, we tested various commercial photocatalysts with different characteristics (Table 1). As can be seen in Fig.8 (a), the activity pattern based on the rate of disappearance of the black color under UV irradiations was different for the photocatalysts used. It is clear that the rutile is not efficient for this reaction while the anatase form admit a significant role in the degradation of pollutant. These results are dependent on the crystallinity and surface area of the particles. We chose the most efficient three photocatalysts P25, PC50 and PC500 for the analysis of TOC and TPhC removal.
These catalysts have different structures. They essentially differ by their surface area, their crystallite and particle size and their chemical surface. It seems that for the same nature of active site, the higher the surface area, the more important photodegradation was observed. This happened because the biggest surface areas are able to adsorb more organic compounds and therefore have a better photocatalytic activity.21
Table 4: TOC removal with different photocatalysts
| Photocatalyst | TOC (%R) |
| p25 | 55,49 |
| pc50 | 27,05 |
| pc500 | 50,02 |
Actually, the adsorption was more important for PC500 (68%) than for PC50 (16%) and P25 (40%). But, there was a slight difference of photocatalytic efficiency between PC500 and P25.
The results in Fig.8 (b) and Table 4 confirmed that the P25 had the highest activity for OMW photo-degradation due probably to its composition of rutile and anatase forms. However, PC 500 and PC50, which are composed uniquely of anatase had different behavior. In fact, phenolic compounds were easily degraded with PC 50 photocatalyst during the reaction but we notice that they reached approximately the same percentage (65%) as PC500 after 4h. On the other hand, total mineralization was more pronounced with PC500 at the percentage of 50% versus 27% with PC50. These observations suggested that the PC50 is not suitable for a photocatalytic degradation of OMW. Moreover, the high TOC removal with PC500 is caused mostly by the high adsorption rate on its surface (317 m2.g-1) rather than its photocatalytic ability since TPhC removal was not efficient. We conclude that TiO2P25 has the best photocatlytic activity.
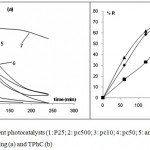 |
Figure 8: Effect of different photocatalysts (1: P25; 2: pc500; 3: pc10; 4: pc50; 5: anatase (Prolabo); 6: anatase (FLUKA); 7: rutile) on fading (a) and TPhC (b)
|
Photocatalyst Reuse
These experiments were carried out with OMW effluent diluted 100 times. They were repeated four times to find out the durability, repeatability and photoactivity of the photocatalyst.
The possibility of TiO2 reuse in photocatalytic processes has received considerable attention since it can reduce the operational cost of the process, which is still a problem for the applicability of photocatalysis as a method for wastewater purification.22
In order to evaluate reused photocatalyst efficiency, experiments with recycled catalyst were performed as follows: at the end of the run with the fresh catalyst, the mixture was centrifuged at 4000rpm and the supernatant liquid was carefully decanted. A new batch of the OMW solution was then added to the used TiO2 under vigorous stirring. Results are displayed in Fig.9.
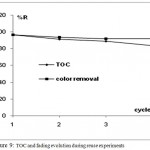 |
Figure 9: TOC and fading evolution during reuse experiments
|
Although photocatalytic efficiency marginally decreased on repeated use, it still remained sufficiently high in both terms of color intensity and TOC conversion. It is therefore important to consider that prolonged use could diminish effectiveness of TiO2. In the fifth cycle, compounds were generally degraded more slowly, but there is no logical correlation between the number of cycles and loss of activity. The catalyst deactivation after repeated use could be explained by the fact that upon irradiation, a part of anatase fraction is transformed to the rutile form that is less active than anatase. Poisoning of the surface due to the intermediates strongly adsorbed on TiO2 surface may also lead to the catalyst deactivation. These results demonstrate the stability of the TiO2 photocatalyst and open the field of its application to the reuse of treated olive mill wastewater.23
HPLC Measurements
We were able to identify by HPLC measurements the majority of the phenolic compounds present in the OMW solution and the concentration of the most abundant. Our sample contains different classes of phenolics such as phenyl ethyl alcohol (Hydroxytyrosol and Tyrosol), cinnamic (Caffeic acid and p-Coumaric acid) and benzoic acids (Vanillic acid). The concentration of Hydroxytyrosol, the main phenolic fraction in our OMW, is about 2136,89 mg/L and Tyrosol level is 573,85 mg/L.
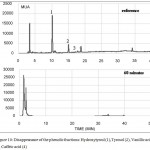 |
Figure 10: Disappearance of the phenolic fractions: Hydroxytyrosl (1), Tyrosol (2), Vanillic acid (3), Caffeic acid (4)
|
HPLC chromatograph in Fig.10 confirmed the removal of the most phenolic compounds after 60 minutes of irradiation. This suggests that all pollutants were decomposed but the results from TOC and spectroscopy proved the presence of some organic compounds that were mainly generated from the polyphenols decomposition. The results showed the suitability of the mobile phase employed in this study in the detection of polyaromatic substances but it did not illustrate the appearance of new products resulting from the polyphenols degradation.
Conclusion
The study presented in this article was intended to give a general presentation of photocatalysis procedure and to test its application in the decontamination of olive mill wastewater and the degradation of organic matter.
The Results Showed that
Heterogeneous photocatalysis is a suitable technique to degrade and mineralize the polyphenols at room temperature. The efficiency of oxidation TiO2/UV/O2 system was demonstrated and the effect of various parameters was explained.
The adsorption of pollutants on TiO2 is a prerequisite step for its degradation.
The total carbon mineralization requires more time than the total disappearance of phenolic compounds.
Photocatalytic procedure can produce high quality treated OMW even after repeated use of the photocatalyst.
The important role played by OH is confirmed through the results obtained with experiments in the presence of hydrogen peroxide.
The photocatalytic treatment is very effective for a duration of only 4 hours with a 100 fold diluted solution, 1g/L TiO2 , 3g/L H2O2 without pH or temperature adjustment.
Further experiments will be conducted to optimize the decontamination rate and the organic matter degradation in the olive mill wastewater in order to improve the quality of the final obtained water and enhance the reaction conditions.
Acknowledgements
This work was carried out at the laboratory of physical chemistry at the University Paris-Sud 11, France. The financial support of the Ministry of Higher Education and Scientific Research of Tunisia and the laboratory of materials, molecules and applications, University of Carthage is acknowledged.
References
- McNamara Ch. J., Anastasiou C. Ch., O’Flaherty V., Mitchell R. Bioremediation of olive mill wastewater. Int. Biodeter. Biodegr. 2008;61:127-134.
CrossRef - Lakhtar H. Culture du Lentinula edodes (Berk.) Pegler sur résidus oléicoles en fermentation en milieu solide Transformation des polyphénols des margines, Université Paul Cézanne. Marseille III, France. 2009.
- Casa R., Annibale A. D., Pieruccetti F., Stazi S. R., Sermanni G. G., Lo C. B. Reduction of the phenolic components in olive-mill wastewater by an enzymatic treatment and its impact on durum wheat (Triticum durum Desf.) germinability. Chemosphere. 2003;50:959-966.
CrossRef - Kotronarou N., Mendez M. IMPEL Olive Oil Project. European Union network for the implementation and enforcement of environmental law, Rome, Italy. 2003.
- Hai Z., Kolli N., Uribe D. B., Beaunier P., Yacaman M. J., Vigneron J., Etcheberry A., Sorgues S., Justin C. C., Chen J., Remita H. Modification of TiO2 by bimetallic Au-Cu nanoparticles for wastewater treatment. J. Mater. Chem. A. 2013;1:10829-10835.
CrossRef - Fujishima A., Honda K. Electrochemical Photolysis of Water at a Semiconductor Electrode. Nature. 1972;238:37-38.
CrossRef - Matthews R. W. Kinetics of Photocatalytic Oxidation of Organic Solutes over Titanium Dioxide. J. Catal. 1988;111:264-272.
CrossRef - Hajjouji H.E., Barje F., Pinelli E., Bailly J. R., Richard C., Winterton P., Revel J. C., Hafidi M. Photochemical UV/TiO2 treatment of olive mill wastewater (OMW). Bioresour. Technol. 2008;99:7264-7269.
CrossRef - Flouri F., Sotirchos D., Ioannidou S., Balis C. Decolorization of Olive Oil Mill Liquid Wastes by Chemical and Biological Means. Int. Biodeter. Biodegr. 1996;38:183-192.
CrossRef - Box J. D. Investigation OF The Folin-Ciocalteau Phenol Reagent For The Determination Of Polyphenolic Substances In Natural Waters. Water Res. 1983;17:511-525.
CrossRef - Baransi K., Dubowski Y., Sabbah I. Synergetic effect between photocatalytic degradation and adsorption processes on the removal of phenolic compounds from olive mill wastewater. Water Res. 2012;46:789-798.
CrossRef - Lachheb H., Dappoze F., Haoues A., Guillard C. Adsorption and photocatalytic degradation of Cysteine in presence of TiO2. J. Photochem. Photobiol. A : Chem. 2012;246:1-7.
CrossRef - Khoufi S., Feki F., Sayadi S. Detoxification of olive mill wastewater by electro-coagulation and sedimentation processes. J. Hazard. Mater. 2007;142:58-67.
CrossRef - Jiaa Z., Miaoa J., Lub H. B., Habibia D., Zhangc W. C., Zhanga L. C. Photocatalytic degradation and absorption kinetics of cibacron brilliant yellow 3G-P by nanosized ZnO catalyst under simulated solar light. J. Taiwan Inst. Chem. E. 2015;1-8.
- Badawy M. I.,Gohary F. E., Ghalyb M. Y., Ali M. E. M. Enhancement of olive mill wastewater biodegradation by homogeneous and heterogeneous photocatalytic oxidation. J. Hazard. Mater. 2009;169:673-679.
CrossRef - Terazian R., Serpone N. Heterogeneous photocatalysed oxidation of creosote components: mineralization of xylenols by illuminated TiO2 in oxygenated aqueous media. J. Photochem. Photobiol. A: Chem. 1995;89:163-175.
CrossRef - Larson S. A., Falconer J. L. Initial reaction steps in photocatalytic oxidation of aromatics. Catal. Lett. 1997;44:57-65.
CrossRef - Faust B. C., Hoigne J. Photolysis of Fe(III)-hydroxyl complexes as sources of OH radicals in clouds, fog and rain. Atoms. Envion. 1990;241:79-89.
- Martell E., Smith M. In: Critical Stability Constants, 3. Plenum Press, New York & London. 1974-1989.
CrossRef - Pekakis P. A., Xekoukoulotakis N. P., Mantzavinos D. Treatment of textile dyehouse wastewater by TiO2 photocatalysis. Water Res. 2006;40:1276-1286.
CrossRef - Sclafani A., Herrmann J. M. Comparison of the Photoelectronic and Photocatalytic Activities of Various Anatase and Rutile Forms of Titania in Pure Liquid Organic Phases and in Aqueous Solutions . J. Phys. Chem. 1996;100:13655-13661.
CrossRef - Doll T. E., Frimmel F. H. Cross-flow microfiltration with periodical back-washing for photocatalytic degradation of pharmaceutical and diagnostic residues-evaluation of the long-term stability of the photocatalytic activity of TiO2. Water Res. 2005;39:847-854.
CrossRef - Dominguez C., Garcia J., Pedraz M. A., Torres A., Galan M. A. Photocatalytic oxidation of organic pollutants in water. Catal. Today. 1998;40:85-101.
CrossRef

This work is licensed under a Creative Commons Attribution 4.0 International License.


