

Manuscript accepted on : 22 December 2016
Published online on: --
Plagiarism Check: Yes
Salt Tolerance Analysis of Crops Using the SWAP Model
Forough Kamyab-Talesh1, Behrouz Mostafazadeh-Fard1, Majid Vazifedoust2, Mohammad Shayannejad1 and Maryam Navabian2
1Water Engineering Department, College of Agriculture, Isfahan University of Technology, Isfahan 84156-83111, Iran.
2Water Engineering Department, College of Agriculture, Guilan University, Rasht 58643-41889, Iran.
Corresponding Author E-mail: forough.kamyab@gmail.com
DOI : http://dx.doi.org/10.13005/bbra/2490

ABSTRACT: Soil and water salinities are major environmental factors limiting the productivity of agricultural lands especially in arid and semi arid regions. To determine salinity threshold values and slope of the yield decrements for crops of wheat, barley and maize, SWAP model was study for an arid region located in Semnan Province (52◦25' N 35◦11' E), central part of Iran with area of 35000 ha including 94 villages belonged to irrigation network of Garmsar district. The data collected from the above 94 villages for years 1998 to 2007 were used to calibrate and simulate yield of wheat, barley and maize using the SWAP model. The irrigation water salinities of 2, 4, 6 and 8 dS m-1 were used and yield reductions versus soil saturation extracts were evaluated and salinity threshold values and slope of the yield reductions were determined for each of the above crops. The results showed that the SWAP model predict crop yields with good accuracy and the threshold values and slope of the yield reductions are site dependent. These values should be determined for each area in order to be able to plan better irrigation scheduling for arid regions which have soil and irrigation water salinities problems.
KEYWORDS: Salinity threshold; yield and SWAP model
Download this article as:| Copy the following to cite this article: Kamyab-Talesh F, Mostafazadeh-Fard B, Vazifedoust M, Shayannejad M, Navabian M. Salt Tolerance Analysis of Crops Using the SWAP Model. Biosci Biotech Res Asia 2017;14(2). |
| Copy the following to cite this URL: Kamyab-Talesh F, Mostafazadeh-Fard B, Vazifedoust M, Shayannejad M, Navabian M. Salt Tolerance Analysis of Crops Using the SWAP Model. Biosci Biotech Res Asia 2017;14(2). Available from: https://www.biotech-asia.org/?p=25288 |
Introduction
Salinity is the major environmental factor limiting plant growth and productivity (Allakhverdiev et al., 2000b). Saline water management requires that species and salt tolerant varieties should be identified (Rhoades et al., 1992; Minhas, 1996). This identification has been derived by classifications based on the relationship between yield reduction and other variables such as soil salinity (Ayers and Westcot, 1985; Francois and Maas, 1994), relative transpiration (Stewart et al., 1977), plant water status indicators (Katerji et al., 2000), and water use efficiency (Katerji et al., 2003). Crop salt tolerance information is abundant in the literature. An abundance of data exists for the whole plant salt tolerance as a function of root-zone average salinity (Maas and Hoffman, 1977, Steppuhn et al., 2005a). Nevertheless, the accuracy of many of the data is questionable. In general, the data does not include information about soil and other environmental factors which are known to affect root water uptake and, thus, crop salt tolerance. Besides changes in solute concentrations, many other crop-environment interactions may cause variations in salinity-yield relationships, such as those involving temperature, radiation, humidity, atmospheric pollutants, wind, soil fertility, soil water content.( Chaali et al., 2013). Salinity stress biology and plant responses to high salinity have been discussed over two decades (Flowers et al., 1977; Greenway and Munns, 1980; Ehret and Plant, 1999; Hasegawa et al., 2000; Zhu, 2002) and it has been over a decade since salinity tolerance in marine algae has been covered (Kirst, 1989).
Accumulation of salts in root zone affects plant performance through the development of a water deficit and the disruption of ion homeostasis (Zhu, 2001; Munns, 2002). These stresses change hormonal status and impair basic metabolic processes (Loreto et al., 2003; Munns, 2002) resulting in inhibition of growth and reduction in yield (Maas, 1993; Prior et al., 1992; Paranychianakis et al., 2004a). Depressed photosynthesis has been suggested to be responsible for at least part of the growth and yield reduction (Prior et al., 1992; Munns, 2002). Despite the vast number of studies dealing with the impacts of salinity on photosynthesis of horticultural crops, most of them fail to quantify the nature of photosynthetic limitations. Stomatal closure, arising from the osmotic component of salinity, has been reported to be primarily responsible for photosynthesis inhibition in some studies (Paranychianakis et al., 2004b; Ban˜uls and Primo Millo, 1995).
Maas and Hoffman (1977) suggested that their values of salinity threshold and slope of the yield reductions can be used only as a guideline and that the absolute tolerance of crops to salinity may vary with climate, cultural practices and soil conditions.
The objective of this study was to determine the salinity threshold values and slope of the yield reductions for crops of wheat, barley and maize for an arid region using different irrigation water salinities.
Material and Method
Study Area
Field data were collected in irrigation network of Garmsar District (52◦25′ N 35◦11′ E) located in Semnan Province, central part of Iran with area of 35000 ha and elevation of 850 m above mean sea level (Figure 1). The study area included 94 villages with climate condition of dry and cold, having an average annual rainfall of 119 mm. The average annual evaporation is about 1539 mm and minimum and maximum temperature varies from -0.4◦C to 22.7◦C and 10.7◦C to 39.7◦C, respectively. The soils of the study area is mainly clay loam with electrical conductivity of 6 dS m-1.
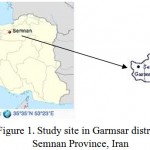 |
Figure 1: Study site in Garmsar district, Semnan Province, Iran
|
In this research the SWAP model was used to simulate actual crop yields under different irrigation water salinities for the study area. Then, salinity threshold values and slope of the yield decrements were determined using simulation results.
SWAP Model
Soil, Water, Atmosphere and Plant (SWAP) has been used in this study due to its versatility. Initially, SWATR a one dimensional model was developed by Feddes et al. (1978) to describe transient water flow in the heterogeneous soil root system under the influence of groundwater. It is designed to simulate unsaturated flow, solute transport, heat flow and crop growth in the soil–plant–atmosphere environment at the field scale. The model applies Richard’s equation (Equation (1)) for soil water flow in the soil matrix described as below:
![]()
Where θ= the soil water (cm3 cm-3), h = the pressure head (cm), K = the unsaturated hydraulic conductivity (cm d-1), z = the soil depth taken positive upwards (cm), C = the water capacity (dθ/dh) (cm-1) and Sa = the sink term (cm3 cm-3 d-1)
Salt transport is described with the convection–dispersion equation (Equation (2)), assuming that molecular diffusion under irrigated field conditions can be neglected (Van Genuchten & Cleary 1979 and Beltman et al. 2008):
![]()
Where q = water flux density (cm day-1), C = salt concentration (mg cm-3), and Ldis = dispersivity (cm).
SWAP provides three different sub-models for purpose of simulation crop growth i.e. (a) detailed crop growth, (b) detailed grass growth and (c) simple crop growth. In this study detailed crop model was used.
The main crops of the study site are mainly wheat, barley and maize. The input data of SWAP model for simulation are climate data, crop, soil, irrigation and boundary conditions.
In order to perform simulation studies, SWAP model was calibrated using crop parameters to achieve potential yields of regional crops. To verify the validity of model for some of the crops, the measured actual yield of some crops for periods of 1998–2007 of Garmsar region were collected and were compared with the model simulated data. To evaluate the level of difference between the observed and simulated data, the Root Mean Square Error (RMSE) was computed as:
![]()
After calibrating and evaluating the SWAP model for each individual site (village), and observing the satisfactory results, then the model was run for each crop using the average irrigation water depth of that individual site for irrigation water salinities of of 2, 4, 6 and 8 dS m-1 and the actual yields and soil salinities were determined. Then, yield reductions versus soil salinities were evaluated and the salinity threshold values and slope of the yield reductions were determined using linear regression.
Linear yield decrement due to soil salinity was determined as follows (Maas and Hoffman 1977):
Yr = 100 – B (ECe – A) (4)
where = the relative yield (%), A = the salinity threshold value above which a yield decrement occurs (dS m-1), B = the slope of the yield decrement line (% yield reduction/unit of salinity), and ECe= the electrical conductivity of the saturation extract (dS m-1).
Result and Discussion
Calibration and Validation
The SWAP model was calibrated for the crop parameters by inverse modeling as shown in Table 1. In Table 1, TSUMEA, TSUMAM, RGRLAI, Sla and Amax represents sum of temperature from emergence to anthesis, sum of temperature from anthesis to maturity, maximum relative increase in LAI, specific leaf area and Amax maximum CO2 assimilation rate, respectively. After calibration of the model for the crop parameters, then, these values were kept constant and the model was validated for whaet, barley and maize crops.
Table 1: Calibrated crop parameters for the SWAP model
| Parameter | Crop | ||
| Wheat | Barley | Maize | |
| TSUMEA (◦C) | 1000.02 | 1000.02 | 850 |
| TSUMAM (◦C) | 850 | 850 | 950 |
| (m2m-2d-1) RGRLAI | 0.008 | 0.008 | 0.0294 |
| (ha kg-1) Sla | 0.00165 | 0.0017 | 0.0046 |
| ((kg-1ha-1hr-1/(jm2S) Light use efficiency | 0.392 | 0.38 | 0.65 |
| (kg-1ha-1hr-1) Amax | 43.07 | 40.07 | 75 |
In order to evaluate the validity of the model, statistical indices such as determination of coefficient (R2) and root mean square error (RMSE) were calculated for the years of 1998 to 2007 for 91, 90 and 82 study sites for wheat, barley and maize, respectively as shown in Table 2. For example for wheat, the values of R2 ranged from the minimum value of 0.68 to the maximum value of 0.93. The values of RMSE ranged from 1.04 t ha-1 to 4.6 t ha-1. The relatively high values of R2 and low values of RMSE show that SWAP model is able to predict yield with good degree of accuracy for all three crops of wheat, barley and maize. As an example, for the year of 1998, the simulated yields versus the actual yield for wheat, barley and maize are shown in figure 2 which indicate that the simulated yields corresponded well with the observed yield values.
Table 2: Statistical parameters of SWAP model for crop simulations.
| Year | Wheat | Barley | Maize | |||
| R2 | RMSE | R2 | RMSE | R2 | RMSE | |
| (t ha-1) | (t ha-1) | (t ha-1) | ||||
| 1998 | 0.72 | 2.37 | 0.92 | 1.2 | 0.83 | 2.46 |
| 1999 | 0.77 | 1.04 | 0.91 | 0.77 | 0.79 | 3.4 |
| 2000 | 0.84 | 2.8 | 0.89 | 1.4 | 0.35 | 2.69 |
| 2001 | 0.91 | 1.65 | 0.91 | 0.8 | 0.66 | 4.1 |
| 2002 | 0.93 | 1.59 | 0.88 | 0.96 | 0.86 | 2.8 |
| 2003 | 0.68 | 3.53 | 0.94 | 3.4 | 0.84 | 2.9 |
| 2004 | 0.81 | 1.59 | 0.85 | 1.2 | 0.84 | 2.8 |
| 2005 | 0.9 | 1.4 | 0.92 | 0.7 | 0.79 | 2.8 |
| 2006 | 0.83 | 4.05 | 0.89 | 1.39 | 0.83 | 4.9 |
| 2007 | 0.9 | 4.6 | 0.79 | 2.7 | 0.75 | 4.7 |
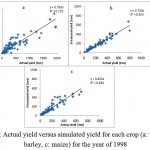 |
Figure 2: Actual yield versus simulated yield for each crop (a: wheat, b: barley, c: maize) for the year of 1998 |
Crop salt Tolerance
To evaluate yield decrement as affected by the soil saturation extract, equation 4 rearranged as:
100-Y,-BxEC,-AB (5)
Where B = the slope of the line, and AB = the intercept. The parameters of the above equation were determined for each crop as shown in figure 3. In figure 3 the soil saturation extract (ECe) is shown in horizontal axis and (100-Yr) is shown in the vertical axis and the values of B and AB were determined based on the best-fit line to the data.
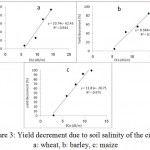 |
Figure 3: Yield decrement due to soil salinity of the crops, a: wheat, b: barley, c: maize |
Based on the values B and AB, then the values of A and B were determined as shown in table 3. According to Table 3, for wheat, the values of B and A are 10.74 and 5.8, respectively. The value of threshold (A) obtained in this research (5.8 dS m-1) is in close agreement with the value of 6 dS m-1 reported by Maas and Grattan (1999) but this value is smaller than the value (8.6 dS m-1) reported by Francois et al. (1986). In an experiment conducted for wheat in an extremely dry region of Iran (the Yazd province), Ranjbar (2005) found that the value of A is 5.92 dS m-1 and the value of B is 4.5 %. He also found that the wheat cultivars are less salt tolerant in arid region as compared to the humid region. For barley, the values of B and A are 7.43 and 3.97, respectively. Mass and Hoffman (1977) reported the threshold value of 6 dS m-1 and slope of 7.1 for barley. For maize the values of B and A are 11.8 and 2.4, respectively. Differences between different studies can be attributed to different experimental conditions, including genotypes, soils, climate, and/or agronomic practices. Climate is a major factor affecting salt tolerance; most crops can tolerate greater salt stress if the weather is cool and humid than if it is hot and dry. Yield is reduced more by salinity when atmospheric humidity is low (Rhoades et al. 1992).
Due to necessity of crop production in the study area, if better irrigation and drainage management apply to control soil salinity close to the salinity threshold value, the predicted yield will be higher which results in higher income for the farmers.
Table 3: The values of salinity threshold and yield reduction
| Crops | Salinity threshold value, A(dS m-1) | Slope of the yield decrement line, B (%) |
| Wheat | 5.8 | 10.74 |
| Barley | 3.97 | 7.43 |
| Maize | 2.4 | 11.8 |
Conclusion
The results indicate that the SWAP model is able to predict yield with good degree of accuracy for all three crops of wheat, barley and maize. The study of 94 villages with dry climatic conditions showed that the values of salinity threshold and slope of the yield reductions is site specific and they should be determined for each area which has different climatic and soil conditions. Due to necessity of crop production in the study area, if better irrigation and drainage management apply to control soil salinity close to the salinity threshold value, the predicted yield will be higher which results in higher income for the farmers. It is important to recognize that the available salt tolerance data cannot provide accurate, quantitative crop yield losses for every situation, since actual response to salinity varies with other conditions of growth such as climatic and soil conditions, agronomic and irrigation management, crop variety, stage of growth, etc.
References
- Allakhverdiev S. I., Sakamoto A., Nishiyama Y., Inaba M., Murata N. Ionic and osmotic effects of NaCl-induced inactivation of photosystems I and II in Synechococcus sp. Plant Physiol. 2000;123:1047–1056.
CrossRef - Ayers R. S., Westcot D. W. Water quality for agriculture. FAO Irrigation and Drainage Paper 29, review 1, Rome. 1985;174.
- Banuls J., Primo-Millo E. Effects of salinity on some Citrus scion-rootstock combinations. Ann. Bot. 1995;76:97–102.
CrossRef - Beltman W. H. J., Boesten J. J. T. I., van der Zee S. E. A. T. M. Spatial moment analysis of transport of nonlinearly adsorbing pesticides using analytical approximations. ater Resour. Res. 2008;44:115–123.
- Chaali N., Comegna A., Dragonetti G., Todorovic M., Albrizio R., Hijazeen D., Lamaddalena N., Coppola A. Monitoring and modeling root-uptake salinity reduction factors of a omato crop under non-uniform soil salinity distribution. Procedia Environmental Sciences. 2013;19:643–653.
CrossRef - Ehret D. L., Plant A. L., Dhaliwal G. S., Arora R. (Eds.). Salt tolerance in crop plants. In: Environmental Stress in Crop Plants. Common wealth Publishers, New Delhi, India, (Chapter 5). 1999;69–120.
- Feddes R. A., Kowalik P. J., Zarandy H. Simulation of field water use and crop yield. In: Simulation Monographs, Pudoc, Wageningen, The Netherlands. 1978.
- Flowers T. J., Troke P. F., Yeo A. R. The mechanism of salt tolerance in halophytes. Annu. Rev. Plant Physiol. 1977;28:89–121.
CrossRef - Francois L. E., Maas E. V., Donovan T. J., Youngs V. L. Effect of salinity on grain yield and quality vegetative growth and germination of semi-dwarf and durum wheat. Agron J. 1986;78:1053–1058.
CrossRef - Francois L. E., Maas E. V. Crop response and management on salt affected soils. In: Pessarakli N. (Ed.). Handbook of Plant and Crop Stress. M. Dekker, New York. 1994;149–180.
- Hasegawa P. M., Bressan R. A., Zhu J. K., Bohnert H. J. Plant cellular and molecular responses to high salinity. Annu. Rev. Plant Physiol. Plant Mol. Biol. 2000;51:463–499.
CrossRef - Greenway H., Munns R. Mechanisms of salt tolerance in non halophytes. Annu. Rev. Plant Physiol. 1980;31:149–190.
CrossRef - Katerji N., van Hoorn J. W., Hamdy A., Mastrorilli M. Salt tolerance classification of crops according to soil salinity and to water stress day index. Agric. Water Manage. 2000;43:99–109.
CrossRef - Katerji N., van Hoorn J. W., Hamdy A., Mastrorilli M. Salinity effect on crop development and yield analysis of salt tolerance according to several classification methods. Agric. Water Manage. 2003;62:37–66.
CrossRef - Kirst G. O. Salinity tolerance of eukaryotic marine algae. Annu. Rev. Plant Physiol. Plant Mol. Biol. 1990;41:21–53.
CrossRef - Loreto F., Centritto M., Chartzoulakis K. Photosynthetic limitations in olive cultivars with different sensitivity to salt stress. Plant Cell Environ. 2003;26:595–601.
CrossRef - Maas E. V., Hoffman G. J. Crop salt tolerance-current assessment. J Irrig Drain Div ASCE. 1977;103:115–134.
- Maas E. V., Grattan S. R. Crop yields as affected by salinity, In: Skaggs R. W., van Schilfgaarde J (eds) Agricultural drainage. Agron Monogr 38. ASA, CSSA, SSSA, Madison, WI. 1999;55–108.
- Maas E. V. Salinity and citriculture. Tree Physiol. 1993;12:195–216.
CrossRef - Minhas P. S. Saline water management for irrigation in India. Agric. Water Manage. 1996;38:1–24.
CrossRef - Munns R. Comparative physiology of salt and water stress. Plant Cell Environ. 2002;25:239–250.
CrossRef - Paranychianakis N. V., Aggelides S., Angelakis A. N. Influence of rootstock, irrigation level and recycled water on the growth and yield of Soultanina grapevines. Agric. Water Manage. 2004;69:13–27.
CrossRef - Paranychianakis N. V., Chartzoulakis K. S., Angelakis A. N. Influence of rootstock, irrigation level and recycled water on water relations and gas exchange of Soultanina grapevines. Environ. Exp. Bot. 2004;52:185–198.
CrossRef - Prior L. D., Grieve A. M., Slavish P. G., Gullis P. R. Sodium chloride and soil texture interactions in irrigated field grown Sultana grapevines. II. Plant mineral content, growth and physiology. Aust. J. Agric. Res. 1992;43:1067–1084.
CrossRef - Ranjbar G. H. Determination of salt tolerance threshold in five bread wheat (Triticum aestivum L.) cultivars. Research report 84/793. Research, Training and Extension Organization, Ministry of Agriculture, Tehran. 2005.
- Rhoades J. D., Kandiah A., Mashali A. M. The use of saline waters for crop production. FAO Irrigation Drainage Paper 48, Rome. 1992;133.
- Steppuhn H., van Th M. G., Grieve C. M. Root-zone salinity. I. Selecting a product–yield index and response function for crop tolerance. Crop Sci. 2005;45:209–220.
CrossRef - Stewart J. L., Danielson R. E., Hanks R. J., Jackson E. B., Hagon R. M., Pruit W. O., Franklin W. T., Riley J. P. Optimizing crop production through control of water and salinity levels in the soil. Utah Water Research Laboratory PR 151-1, Logan, UT. 1977;191.
- Van Th M. G., Cleary R. W. Movement of solutes in soil: computer simulated and laboratory results. In: Bolt G. H. (Ed.) Soil Chemistry, Physico-Chemical Models. Elsevier, Amsterdam The Netherlands.1979;349–386.
CrossRef - Zhu J. K. Plant salt tolerance. Trends Plant Sci. 2001;6:66–71.
CrossRef - Zhu J. K. Salt and drought stress signal transduction in plants. Annu. Rev. Plant Biol. 2002;53:247–273.
CrossRef

This work is licensed under a Creative Commons Attribution 4.0 International License.


