

Manuscript accepted on : 24 January 2017
Published online on: --
Plagiarism Check: Yes
Sunidhi Mishra, Jitendra Singh and P. K. Sharma
Department of Vegetable Science, Indira Gandhi Krishi Vishwavidyalaya, Raipur, Chhattisgarh, 492012.
Corresponding Author E-mail: sunidhi.agri@gmail.com
DOI : http://dx.doi.org/10.13005/bbra/2469

ABSTRACT: The present investigation was undertaken to estimate genetic variability, heritability and genetic advance for important yield component characters in potato. The analysis of variance indicated the existence of sufficient amount of variability among genotypes for all the characters .The phenotypic variance was in general higher than the genotypic variance. Among different yield attributing characters studied, number of compound leaves plant-1 had the highest magnitude of PCV (30.96 per cent) and GCV (27.94 per cent). The estimates of heritability revealed that characters namely, dry weight of tubers plant-1 followed by number of compound leaves plant-1, marketable tuber yield plot-1, total tuber yield plot-1 and fresh weight of tubers plant-1 were recorded with high heritability. The highest genetic advance as percentage of mean was recorded for number of compound leaves plant-1, dry weight of tubers plant-1, marketable tuber yield plot-1, total tuber yield plot-1 and fresh weight of shoots plant-1. High heritability coupled with high genetic advance was recorded for the traits viz. number of compound leaves plant-1, dry weight of tubers plant-1, marketable tuber yield plot-1 and total tuber yield plot-1. Hence, these characters were predominantly governed by additive gene action and can be improved through simple selection.
KEYWORDS: GCV; PCV; Genetic advance Genetic Variability;Heritability;Potato;
Download this article as:| Copy the following to cite this article: Mishra S, Singh J, Sharma P.K. Studies on Parameters of Genetic Variability for Yield and its Attributing Traits in Potato (Solanum Tuberosum L.). Biosci Biotech Res Asia 2017;14(1). |
| Copy the following to cite this URL: Mishra S, Singh J, Sharma P.K. Studies on Parameters of Genetic Variability for Yield and its Attributing Traits in Potato (Solanum Tuberosum L.). Biosci Biotech Res Asia 2017;14(1). Available from: https://www.biotech-asia.org/?p=21571 |
Introduction
Potato (Solanum tuberosum L.), because of its great utility, occupies a pre-eminent place amongst the Vegetable crops and therefore, is acknowledged as the “King of Vegetables”. Potato is an important food crop and ranks fourth in importance globally next to rice, wheat and maize. The crop has high nutritional value as well as great yield potential. It is an essential crop and has received great attention in the recent past, as it has the ability to produce maximum quantity of produce within minimum time and with use of minimum resources. The existence of variability in a population for particular trait is an important prerequisite for its heritable improvement of the crop. Knowledge of variability present in the population due to genetic and non genetic factors facilitates to develop an appropriate and systematic breeding programme as it provides information about the expected response of
various characters towards selection. The effect of environment on expression of various characters is often pronounced enough to affect the yield in a particular direction. Thus, it is quite inevitable to determine the distinct effect of various genetic and environmental factors on the expression of a particular yield attributing trait. Therefore, present investigation was undertaken to estimate genetic variability, heritability and genetic advance for important yield component characters in potato.
Materials and Methods
The field experiment was conducted during the rabi season of year 2015-16 at the Research and Instructional Farm of Department of Vegetable Science, Indira Gandhi Krishi Vishwavidyalaya, Raipur situated in the central part of Chhattisgarh, agro- climatologically known as “Chhattisgarh Plains” and lies between 21o16‟ N latitude and 81o26‟ E longitude at altitude of 289.56 meters above the mean sea level (MSL). The experiment was laid out in randomized complete block design (RCBD) with three replications and plot size of 2.4 m x 2.4 m. The seed tubers obtained from the experimental material of All India Coordinated Research Project on Potato, CPRI, Shimla (H.P) were planted on ridges spaced at 60 cm and intra-row spacing of 20 cm on 16th November, 2015. Fully decomposed farmyard manure (FYM) @ 20 t ha-1 was incorporated and ploughed into the field before planting. The recommended dose of fertilizer i.e.150:100:100 kg NPK ha-1 was applied. The whole amount of P and K and half of the N was applied as basal dose. The remaining quantity of N was given in two splits at 30 and 45 days after planting, respectively. Operations of weeding, earthing up, plant protection and irrigation were performed as per recommendation and when required. Data on yield and yield contributing characters were recorded from 5 randomly selected plants in each plot.
Characters recorded
Twenty five genotypes of potato were evaluated for different characters viz., plant emergence per cent, plant height, number of compound leaves plant-1, number of leaves plant-1, number of shoots plant-1, plant canopy per cent, fresh weight of shoots plant-1, dry weight of shoots plant-1, number of tubers plant-1, fresh weight of tubers plant-1, dry weight of tubers plant-1, harvest index per cent, marketable tuber yield ha-1, unmarketable tuber yield ha-1 and total tuber yield ha-1.
Statistical Methods
The genotypes, on the basis of the data obtained were studied for the presence of genetic variability through estimation of genetic coefficient of variability (GCV), phenotypic coefficient of variability (PCV), heritability, genetic advance and genetic advance as percentage of mean using the following formulae :
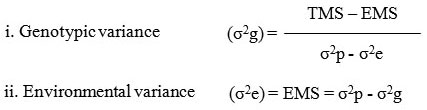
Where, TMS = Treatment mean sum of square, EMS = Error mean sum of square and σ2g = Genotypic Variance, σ2p = Phenotypic Variance and σ2e = Environmental Variance.
Genotypic and phenotypic Coefficient of Variation
Genotypic and phenotypic coefficient of variation was calculated by using the following formula proposed by Burton (1952).
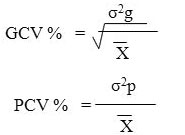
Where, X = general mean for the character under consideration .The estimates of PCV and GCV were classified as low (< 10 %), moderate (10-20%) and high (> 20 %) as per classification given by Sivasubramanium and Madhavamanon (1973).
Heritability
Heritability in broad sense (h2b), defined as the proportion of the genotypic variance to the total variance (phenotypic variance) was estimated by using the formula given by Hansen et al. (1956).
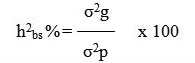
The broad sense heritability estimates were classified as low (>50%), moderate (50-70%) and high (<70%) as suggested by Robinson (1966).
Genetic advance
Expected genetic advance was predicted through the method of Johnson et al. (1955) at 5 per cent selection intensity.
![]()
Where, K = Constant value of 2.06 at 5% selection intensity, σp = Phenotypic standard deviation of the character and h2 = Heritability of the character.
Genetic advance as percent of mean
Genetic advance as percentage of mean was calculated as per the following formula given by Comstock et al., (1952).
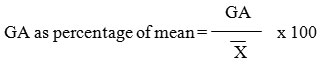
Where, GA = Genetic advance and X = Mean. The magnitude of genetic advance as percentage of mean was classified as low (<25%), moderate (25-40%) and high (>40%).
Result and Discussion
The phenotypic and genotypic coefficient of variance, heritability, genetic advance and genetic advance as percentage of mean was calculated for all the fourteen characters as given in Table 1 and Table 2.
Table 1: Estimates of Genotypic and Phenotypic coefficient of variation (GCV and PCV)
| S.No.
|
Parameters
|
Mean
|
Coefficient of Variation (%) | |
| Genotypic | Phenotypic | |||
| 1 | Plant Emergence % | 88.98 | 5.13 | 6.61 |
| 2 | Plant height (cm) | 43.35 | 13.19 | 17.94 |
| 3 | No. of shoots plant-1 | 5.01 | 7.58 | 15.16 |
| 4 | No. of Leaves plant.1 | 309.75 | 7.06 | 14.78 |
| 5 | No. of compound leaves plant-1 | 48.34 | 27.94 | 30.96 |
| 6 | Plant canopy cover % | 70.85 | 4.14 | 8.19 |
| 7 | Fresh weight of shoots (gm plant-1) | 102.55 | 23.76 | 28.84 |
| 8 | Dry weight of shoots (gm plant-1) | 18.39 | 15.40 | 21.57 |
| 9 | Number of tubers plant-1 | 4.62 | 8.18 | 15.50 |
| 10 | Fresh weight of tubers (gm plant-1) | 230.36 | 22.55 | 26.22 |
| 11 | Dry weight of tubers (gm plant-1) | 55.54 | 26.26 | 28.91 |
| 12 | Harvest Index % | 68.08 | 8.80 | 11.33 |
| 13 | Marketable tuber yield (Kg plot-1) | 12.67 | 24.74 | 28.168 |
| 14 | Total tuber yield (Kg plot-1) | 13.16 | 24.34 | 27.78 |
Table 2: Estimates of Heritability, Genetic Advance and Genetic Advance as % of mean.
| S.No. | Parameters | Heritability (H2b) % | Genetic Advance K=20.6 | Genetic Advance as % of mean |
| 1 | Plant Emergence % | 60.3 | 7.31 | 8.215 |
| 2 | Plant height (cm) | 54 | 8.66 | 19.986 |
| 3 | No. of shoots plant-1 | 24.1 | 0.39 | 7.811 |
| 4 | No. of Leaves plant.1 | 22.8 | 21.55 | 6.957 |
| 5 | No. of compound leaves plant-1 | 81.4 | 25.11 | 51.946 |
| 6 | Plant canopy cover % | 25.5 | 3.06 | 4.311 |
| 7 | Fresh weight of shoots (gm plant-1) | 67.9 | 41.37 | 40.338 |
| 8 | Dry weight of shoots (gm plant-1) | 50.9 | 4.17 | 22.652 |
| 9 | Number of tubers plant-1 | 27.8 | 0.41 | 8.901 |
| 10 | Fresh weight of tubers (gm plant-1) | 73.9 | 92.03 | 39.949 |
| 11 | Dry weight of tubers (gm plant-1) | 82.5 | 27.3 | 49.154 |
| 12 | Harvest Index % | 60.3 | 9.58 | 14.072 |
| 13 | Marketable tuber yield (Kg plot-1) | 77.1 | 5.67 | 44.738 |
| 14 | Total tuber yield (Kg plot1) | 76.8 | 5.78 | 43.921 |
Coefficient of variation
The result obtained showed that phenotypic coefficient of variance was in general higher than the genotypic coefficient of variance for all the characters (Figure 1). It is due to presence of substantial influence of environmental factors besides the genetic variation for expression of these traits. High magnitude of phenotypic GCV and PCV (i.e. >20 per cent) were observed for number of compound leaves plant-1 (27.94 per cent and 30.96 per cent, respectively), followed by dry weight of tubers plant-1 (26.26 and 28.91per cent, respectively), marketable tuber yield plot-1 (24.74 and 28.168 per cent, respectively), total tuber yield plot-1 (24.34 and 27.78 per cent, respectively ), fresh weight of shoots plant-1 (23.76 and 28.84 per cent, respectively) and fresh weight of tubers plant-1 (22.55 and 26.22 per cent respectively. The low magnitude GCV (<10 per cent) was also observed for the character harvest index percentage (8.8 and 11.33 per cent, respectively) number of tubers plant-1 (8.18 and 15.5 per cent, respectively), plant emergence per cent (5.13 and 6.61 per cent, respectively) and plant canopy cover per cent (4.14 and 8.19 per cent, respectively) in present study. The above findings indicate that the characters with high magnitude of GCV and can be utilized for improvement as the population possesses considerable variability for these characters.
These findings are in accordance with the findings by Singh et al (2015) and Ahmad et al. (2005) for number of compound leaves plant-1; Dayal et al. (1972) and Chaudhary et al. (1984) for total tuber yield; Sharma (1999) for dry weight of shoots plant-1; Basavaraj et al. (2005) for fresh weight of tubers plant-1; Kumar et al. (2005) for plant height. The moderate GCV and PCV were reported by Luthra et al. (2005) and Shashikamal (2006) for fresh weight of shoots plant-1 and plant height. Singh (2008) reported maximum GCV and PCV for marketable tuber yield plot-1.
Heritability and Genetic Advance
The estimate of heritability in broad sense and genetic advance calculated for all the fourteen characters is presented in Figure 2 and results are explained below: Estimate of heritability was recorded highest for the character dry weight of tubers plant-1 (82.5 per cent) followed by number of compound leaves plant-1 (81.4 per cent), marketable tuber yield plot-1 (77.1 per cent), total tuber yield plot-1 (76.8 per cent) and fresh weight of tubers plant-1(73.9 per cent). However, low heritability was observed in number of shoots plant-1 (24.1 per cent), number of leaves plant-1 (22.8 per cent), plant canopy cover percentage (25.5 per cent) and number of tubers plant-1 (27.8 per cent). Presence of high heritability indicated that these characters are less influenced by environmental fluctuations and governed by the additive gene effects that are substantially contributing towards the expression of these traits. However, rest of the traits seems to be governed by non additive gene effects. The present findings on heritability are in accordance with findings reported by the various workers viz. Singh (2008) marketable tuber weight plot-1, total tuber weight plot-1, number of tubers plant-1 and dry matter content of tubers; Barik (2007) for fresh weight of shoots plant-1, harvest index per cent, unmarketable yield plot-1, tuber dry matter plant-1, per cent emergence, total number of leaves plant-1, fresh weight of tuber plant-1 and total tuber yield plot-1. Chandrakar (2007), Basavaraj et al. (2005), Biswas et al. (2005), Bhagowati et al. (2002), Luthra (2001), Desai and Jaimini (1997b), Chaudhary et al. (1984) and Gaur et al. (1978b) reported high heritability for various component traits in potato.
Highest estimates of genetic advance as percentage of mean were obtained for characters namely number of compound leaves plant-1 (51.94 per cent) , dry weight of tubers plant-1 (49.154 per cent), marketable tuber yield plot-1 (44.738 per cent), total tuber yield plot-1 (43.921 per cent) and fresh weight of shoots plant-1 (40.338 per cent). The high value of genetic advance for these traits showed that these characters are governed by additive genes and selection will be rewarding for the further improvement of such traits. The moderate genetic advance was observed in character namely fresh weight of tubers gm plant-1 (39.94 per cent). The presence of moderate genetic advance suggests that both the additive and non-additive variance is operating in these traits. However, the low genetic advance as per cent of mean was observed for the characters such as dry weight of shoots plant-1 (22.65 per cent), Plant height (19.99 per cent), harvest index percentage (14.07 per cent), number of tubers plant-1 (8.90 per cent), plant emergence percentage (8.22 per cent), number of shoots plant-1 (7.81 per cent), number of leaves plant-1 (6.957 per cent) and plant canopy cover percentage (4.31per cent). This indicates the presence of non-additive gene effects.
The low genetic advances for characters in spite of their more than 50% heritability, is due to low variability. This shows the importance of genetic variability in improvement through selection. Panse (1957) suggested that effective selection may be done for the characters having high heritability accompanied by high genetic advance which is due to the additive gene effect. He also reported that low heritability accompanied with genetic advance is due to non-additive gene effects for the particular character and would offer less scope for selection because of the influence of environment. Desai and Jaimini (1997) also reported that tuber yield, number of stem, number of leaves, maturity, shoot fresh weight, number of tubers and average tuber weight had high genotypic coefficients of variation, high heritability and high genetic advance irrespective of environments. In agreement to the above results, Pradhan et al. (2011) recorded the high heritability and genetic advance for number of leaves; Bhagowati et al. (2002) recorded higher and moderate heritability estimates for the characters like leaf number and fresh weight of tubers plant-1. Barik (2007) reported similar findings for dry weight of tubers plant-1 and total tuber yield.
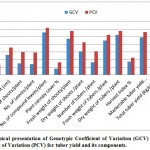 |
Figure 1: Graphical presentation of Genotypic Coefficient of Variation (GCV) and Phenotypic Coefficient of Variation (PCV) for tuber yield and its components. |
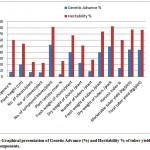 |
Figure 2: Graphical presentation of Genetic Advance (%) and Heritability % of tuber yield and its components.
|
Conclusion
The high estimates of heritability recorded for the characters namely, dry weight of tubers plant-1, followed by number of compound leaves plant-1, marketable tuber yield plot-1, total tuber yield plot-1 and fresh weight of tubers plant-1 indicate that these characters are governed by additive gene effect and are less influenced by environment and hence, selection for these characters, if found positively associated with yield will be beneficial in improvement of potato, whereas hybridization or heterosis breeding may be exploited for improvement of the characters with low genetic advance as per cent of mean. In the present investigation, high heritability coupled with high genetic advance was recorded for the traits viz. dry weight of tubers plant-1, marketable tuber yield plot-1 and total tuber yield plot-1. Thus, it can be concluded that these characters may respond effectively to phenotypic selection since it will result in accumulation of more desirable genotypes leading to improvement of these characters.
References
- Ahmad I., Hossain M., Islam G. M. R., Billah S. K. M and Kabir Y. Genetic variability and correlation studies in potato (Solanum tuberosum). Intern. Jour. of Sustainable Agri. Tech. 2005;1(4):30-34.
- Barik S. B. Genetic diversity in potato (Solanum tuberosum)”. M.Sc.(Ag.) Thesis, Indira Gandhi Krishi Vishwavidyalaya Raipur (C.G.). 2007.
- Bhagowati R. R., Saikia M and Sut D. Variability, heritability, genetic advance and character association in True Potato Seed (TPS) populations. Argil. Sci. Society of North East India. 2002;15(1):119-122.
- Biswas M. K., Mondal M. A. A., Ahmad M. G., Hoque A., Hossain M. M and Islam R. Study on genetic variability and heterosis in potato. Pakistan J. Bio. 2005;8(1):6-9.
CrossRef - Basavaraj N., Nay K. R., Naik K. S and Gayatri G. N. Genetic variability studies in Potato (Solanum tuberosum). Potato J. 2005;32(3-4):233-256.
- Burton G. W. Quantitative inheritance in grasses. 6th Int. Gr. Ld. Cong. 1952;1:277-283.
- Chandrakar A. Genetic analysis of clonal hybrids (C1 progenies) for tuber yield and its components in potato (Solanum tuberosum L). Sc. (Ag.) Thesis, Indira Gandhi Krishi Vishwavidyalaya, Raipur (C.G.). 2007.
- Choudhary S. K., Sharma S. K and Sharma H. C. Path coefficient analysis in F1C2 generation of potato crosses. Sci. Digest. 1984;4(4):228-230.
- Comstock R. E., Robinson H. F and Harvey P. H. Genotypic and phenotypic correlation in corn and their implication in selection. J. 1952;43:282-287.
- Desai N. C and Jaimini S. N. Studies on genetic divergence in potato (Solanum tuberosum). Jour. of the Indian Potato Asso. 1997;24(3/4):154-160.
- Desai N. C and S. N. Jaimini. Studies on genetic divergence in potato (Solanum tuberosum L.). Indian Potato Assoc. 1997;24(3 & 4):154-160.
- Dayal T. R., Upadhyay M. D., Malhotra V. P and Mehra K. L. Heritability and correlation in yield and other quantitative characters in potato (Solanum tuberosum ). Indian J. Agric. Sci. 1972;42(6):464-466.
- Gaur P. C., Kishore H and Gupta P. K. Morphological and genetic variability for some quantitative characters in potato. Indian Potato Assoc. 1978;5:70-75.
- Hanson W. D., Robinson H. F and Comstock R. E. Biometrical studies of yield in segregating population of Korean lespedeza. J. 1956;48:268-272.
- Johnson H. W., Robinson H. F and Comstock R. E. Estimates of genetic environmental variability in soybean. AgronJ. 1955;47:314-318.
CrossRef - Kumar V., Gopal J and Bhardwaj V. Evaluation of exotic potato (Solanum tuberosum spp. Tuberosum) germplasm in North – Western Hills of India. Indian J. Plant Genetic Resources. 2005;18(1):94-95.
- Luthra S. K. Heritability genetic advance and character association in potato. Indian Potato Assoc. 2001;28(1):1-3.
- Luthra S. K., Gopal J and P. C. Genetic divergence and its relationship with heterosis in potato. Potato J. 2005;32(1-2):37-42.
- Panse V. G. Genetics of quantitative characters in relation to plant breeding. Indian J. Genet. Pl. Breed. 1957;17: 318-28.
- Pradhan A. M., Nandeshwar B. C., Sarkar K. K and Konar A. Estimation of genetic parameters and association of traits related to yield in potato (Solanum tuberosum). Journal of Crop and Weed. 2011;7(2):229-231.
- Robinson H. S. Quantitative genetics in relation to breeding on th central of mendalism. Indian J. Genet. 1966;26: 171-187.
- Sharma D. Evaluation of early and mid maturing cultures hybrid of potato under Chhattisgarh. Sc. (Ag.) Thesis, Indira Gandhi Krishi Vishwavidyalaya, Raipur, (C.G.). 1999.
- Variability, character correlations and genetic divergence studies in potato (Solanum tuberosum L.). Ph.D. (Ag.) Thesis, G.B.P.U.A. & T., Pantnagar. 2006.
- Singh G. Studies on genetic variability, association and divergence in potato (Solanum tuberosum L.). sc. (Ag.) Thesis, Indira Gandhi Krishi Vishwavidyalaya, Raipur, (C.G.). 2008.
- Singh P., Sharma P. K., Banjara N. C., Sahu N. P and Sharma R. Variability, heritability, genetic advance, correlation and path analysis between yield and yield components in potato (Solanum tubersum). Ecology, Environment and Conservation Paper. 2015;21(2):1093-1097.
- Sivasubramanian J and Madhavamenon P. Genotypic and phenotypic variability in rice. Madras Agric. J. 1973;12: 15-16.

This work is licensed under a Creative Commons Attribution 4.0 International License.


