

Manuscript accepted on : 24 March 2017
Published online on: --
Plagiarism Check: Yes
S. Gopalakrishnan1, T. Ramakrishnan2, P. Harinath3, Joyson Moses4, V. Shankarram5 and Samuel Raj6
1Department of Periodontics,Thai Moogambigai Dental College and hospital, Chennai -600107.
2Department of Periodontics, Aadhiparasakthi Dental College Chennai.
3Department of Periodontics,SRM Dental College and Hospitals,Ramapuram, Chennai.
4Department of Pedodontics, Thai Moogambigai Dental College and hospital, Chennai- 600107.
5Department of Periodontics Thai moogambigai dental college Chennai.
6Department of public health dentistry Thai Moogambigai Dental College and hospital,Chennai- 600107.
Corresponding Author E-mail: gopalakrishnan_perio@ymail.com
DOI : http://dx.doi.org/10.13005/bbra/2453

ABSTRACT: The aim of this study is to find out the effects of non-surgical periodontal therapy on Plasma level of Reactive oxygen metabolites (ROM) and glycemic status in Type-2 diabetic patients with chronic periodontitis. one hundred and twenty patients were included in this study which was further divided into three groups. group 1 consisted of 40 patients with chronic periodontitis, group 2 consisted of 40 patients with chronic periodontitis and controlled diabetes and group 3 consisted of 40 patients with chronic periodontitis and uncontrolled diabetes. Periodontal parameters like plaque index, gingival index, bleeding on probing, pocket depth and clinical attachment levels were evaluated. Blood samples were collected to assess the fasting blood sugar (FBS), glycosylated haemoglobin (Hba1C) and Plasma reactive oxygen metabolites (ROM) levels. All parameters were evaluated at baseline, one month and three months after non-surgical periodontal therapy. Intragroup comparison of clinical parameters showed significance at baseline, one month and three months in all the three groups. (P value<0.001) Inter group comparison of FBS and Hba1C showed significance in all the three groups. When Intragroup comparison was done for FBS and Hba1c, there was significance seen at baseline, one month and three months for FBS in all the three groups. (P value<0.001) whereas for Hba1c, there was significance observed only in group 3. Intragroup comparison of ROM showed significance at baseline, one month and three months after treatment (P value<0.001). Non-surgical periodontal treatment was effective at improving glycemic and periodontal status by reduction in the plasma ROM levels. This improvement might offer clinical benefits by decreasing the blood ROS.
KEYWORDS: Chronic generalised periodontitis; Hba1c; Reactive oxygen metabolites (ROM); Type 2 diabetes mellitus
Download this article as:| Copy the following to cite this article: Gopalakrishnan S, Ramakrishnan T, Harinath P, Moses J, Shankarram V, Raj S. Effects of Non-Surgical Periodontal Therapy on Plasma Level of Reactive oxygen Metabolites and Glycemic Status in type-2 Diabetic Patients With Chronic Periodontitis. Biosci Biotech Res Asia 2017;14(1). |
| Copy the following to cite this URL: Gopalakrishnan S, Ramakrishnan T, Harinath P, Moses J, Shankarram V, Raj S. Effects of Non-Surgical Periodontal Therapy on Plasma Level of Reactive oxygen Metabolites and Glycemic Status in type-2 Diabetic Patients With Chronic Periodontitis. Biosci Biotech Res Asia 2017;14(1). Available from: https://www.biotech-asia.org/?p=23070 |
Introduction
Periodontitis is a Chronic inflammatory disease caused by oral bacterial infection that leads to the loss of connective tissue attachment to root surface cementum and adjacent alveolar bone. When stimulated by bacterial pathogens, host cells release reactive oxygen species (ROS) as a part of the immune response.1 The neutrophils play a prime role in the host defense mechanism and during any infection, there is an inflammation triggered by aerobic organisms causing PMN’s to release a large number of ROS influencing systemic oxidative status2 and resulting in oxidative damage.3 The level of circulating ROMs is influenced by a reduction in periodontal inflammation and ROM is reported to be a useful indicator of ROS in blood.4,5
In normal physiology, there is a dynamic equilibrium between ROS activity and antioxidant defense capacity and when there is an imbalance in the ROS level, either by reduction in level of antioxidant defenses or an increase in ROS production or activity, oxidative stress results. With the progression of periodontitis, ROS produced in the periodontal lesion may diffuse in to the blood stream. Excessive production of ROS by polymorphonuclear leukocytes, is one of the pathologic feature in the periodontal lesion6 and it leads to damage of the periodontal tissue by oxidizing DNA, lipids, and proteins.7 Several studies have suggested a positive correlation between periodontitis and blood ROS level or oxidative damage.8 Measuring this ROM level in blood is recognised to be useful for the evaluation of oxidative stress in the body.9,10 Systemic increase in oxidative stress may have a detrimental effect on periodontal condition and also contribute to the development of complication in diabetes.
Diabetes is a metabolic disorder and most of the complications of diabetes are due to hyperglycemia. Critical pathogenic consequences of hyperglycemia in diabetes is a deficit in detoxification of reactive carbonyl compounds. The increase in reactive carbonyls is derived from both oxidative and nonoxidative reactions leading to increased chemical modification of proteins by carbohydrates and lipids and then at a late stage to oxidative stress and tissue damage. The AGE (Advanced glycation end products) hypothesis proposes that chronic accelerated chemical modification of proteins by reducing sugars in diabetes alters the structure and function of tissue proteins, contributing and precipitating the development of diabetic complications.10 The aim of the present study was to evaluate and compare the level of plasma ROM and glycemic status using FBS and Hba1C levels before and after nonsurgical periodontal therapy.
Materials and Methods
The subjects were selected from the department of periodontics, Thai Moogambigai Dental College, Maduravoyal, Chennai. Written consent was taken from each subject. All the participants completed the study. The study protocol was approved by the ethical committee of Dr.M.G.R university, Maduravoyal, Chennai,India. This was in accordance with the declaration of 1975, as revised in 2000.
This study consists of 120 subjects which is further divided in to
Group 1: 40 subjects with chronic periodontitis
Group 2: 40 subjects with chronic periodontitis with controlled type 2 Diabetes mellitus
Group 3: 40 subjects with chronic periodontitis with uncontrolled type 2 Diabetes mellitus.
The patients were clinically and radiographically evaluated for chronic periodontitis. All the clinical parameters, blood samples were obtained from these subjects at baseline, one month and three months after non-surgical periodontal therapy.
Inclusion Criteria
Subjects who were included in this study should have chronic periodontitis, with or without Type 2 diabetes mellitus. They presented at least four teeth with one or more sites with probing depth (PD) ≥ 5mm, clinical attachment level (CAL) ≥4mm and bleeding on probing (BOP).
Exclusion Criteria
Patients who had undergone periodontal treatment in the past six months, Those with a history of antibiotic administration with in the last three months, Those with less than 20 remaining natural teeth, subjects who are pregnant and subjects with a history of smoking and tobacco consumption were excluded in the study.
Periodontal Treatment and Clinical Measurements
All patients were subjected to a periodontal examination performed in six sites per tooth excluding third molar. Periodontal parameters like plaque index (Silness and loe 1964), gingival index (Loe and silness 1963), bleeding on probing (Muhlemann and son 1971), pocket depth and clinical attachment level were evaluated. Blood samples were collected after a minimum of 8hour of overnight fasting for all individuals at baseline, one month and three months after treatment. After recording the periodontal status, patients received oral hygiene instructions and underwent full mouth non-surgical periodontal treatment comprising scaling and root planing under local anaesthesia. After the periodontal treatment, a professional plaque control programme was performed twice a month for 3 months consisting of supragingival plaque removal and reinstruction of oral hygiene procedures.15 During this experimental period patients were questioned about changes in medications related to diabetes therapy, use of anti-inflammatory or antibiotic and alteration of lifestyle, including exercise and diet.
Laboratory Method for Detection of Rom
The d-ROM test, developed by world-renowned Italian biochemist Mauro carratelli, is a photometric test for measurement of the concentration of hydroperoxides (ROOH) in biological samples. The presence of ROOH in cells indicates oxidative attack of ROS on various substrates such as carbohydrates, lipids, amino acids, proteins, or nucleotides.
Test Principle
The d-ROM test uses the principle of fenton’s reaction: by mixing a biological sample with an acidic buffer (Reagent R1), the newly –created transition metal ion (ion or copper) catalyzes the breakdown of hydroperoxide, generating new radical species such as hydroxyperoxyl (ROO+) and aikoyl (RO+). By adding a chromogen (N, N- dimethyl-phenylendiamine, Reagent R2) having the ability to donate the electron and change color when oxidized by free radicals, and using photometric reading available with the FRAS 4 dedicated analytical equipment, it becomes possible to quantify the level of hydroperoxides available in the sample.
Sample Preparation
Venous blood samples were collected in the morning after an overnight fast. from the patients of three groups (Group1, 2 and 3) (Fig-1) and placed in plasma test tubes for centrifugation. (Fig-2,3) After centrifugation the plasma was separated and placed in a Ependex tubes. (Fig-4,5) The seperated plasma is then mixed with the reagents like acetate buffer and N-Dimethyl-phenylendiamine (Fig-6,7). The prepared tubes are placed in UV spectrophotometry. (Fig-8) and the readings are collected. The carratelli unit (CARRU) was used for measurement. It was established that 1 CARRU corresponds to 0.08mg/dl hydrogen peroxide.
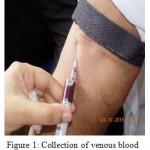 |
Figure 1: Collection of venous blood
|
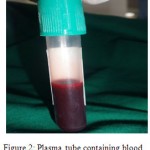 |
Figure 2: Plasma tube containing blood
|
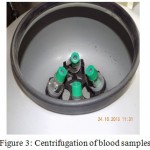 |
Figure 3: Centrifugation of blood samples
|
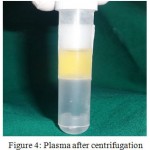 |
Figure 4: Plasma after centrifugation
|
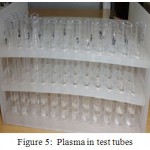 |
Figure 5: Plasma in test tubes
|
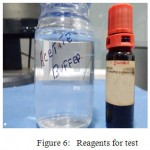 |
Figure 6: Reagents for test
|
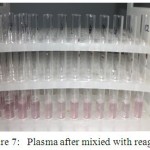 |
Figure 7: Plasma after mixed with reagents
|
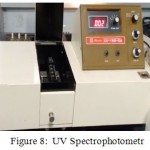 |
Figure 8: UV Spectrophotometry
|
Statistical Analysis
Statistical analyses were performed using a software program (SPSSV 16, IL). Comparison of variables with in the groups was calculated by paired T- Test and between the groups were analyzed by means of using one-way analysis of variance (ANOVA).
Results
When intergroup comparison was done for clinical parameters, there was statistical significance seen for Plaque index (PI), gingival index(GI) and bleeding on probing (BOP) at one month and three months after treatment. For Pocket depth (PD), there was significance seen at baseline and after one month after treatment, whereas for clinical attachment level (CAL), significance was observed only at one month after treatment (Table-1). When intragroup comparison was done for clinical parameters at baseline, one month and three months after treatment there was statistical significance observed in all the three groups (Table-2). When intergroup comparison was done for glycemic status using FBS and Hba1C, there was statistically significant reduction seen in all the three groups (Table-3). When intragroup comparison was done individually for FBS and Hba1C at baseline, one month and three months after treatment, there was statistically significant reduction observed for FBS in all the three groups, whereas there was significant reduction observed for Hba1c only in group 3 (Table 4). When intergroup comparison was done for ROM both in mg/dl and CARRU units, there was no statistical significance (Table-5). When intragroup comparison was done for ROM at baseline, one month and three months after non-surgical periodontal treatment, there was statistically significant reduction observed in all the three groups (Table-6).
Table 1: Intergroup Comparison of Clinical Parameters
| BASELINE | 30 DAYS | 90 DAYS | ||||||||
| Clinical parameters | Mean | Std. Deviation | P value | Mean | Std. Deviation | P value | Mean | Std. Deviation | P value | |
| PI | CP | 2.1343 | 0.64721 | 1.2023 | 0.17838 | .8017 | .22731 | |||
| CP+CDM | 2.1010 | 0.41865 | 0.054 | 1.1137 | 0.12500 | <0.001 | .9333 | .09589 | <0.001 | |
| CP+UCDM | 1.6600 | 0.51729 | 1.0273 | 0.18495 | .6083 | .18657 | ||||
| GI | CP | 2.3777 | 0.60543 | 1.3607 | 0.33767 | .6950 | .24863 | |||
| CP+CDM | 2.6867 | 0.37114 | 0.096 | 1.0330 | 0.06829 | <0.001 | .6707 | .19492 | <0.001 | |
| CP+UCDM | 2.4167 | 0.74375 | .9103 | 0.25701 | .9433 | .32065 | ||||
| BOP | CP | 2.0767 | 0.69067 | 1.1230 | 0.11108 | .9307 | .35059 | |||
| CP+CDM | 2.1467 | 0.52636 | 1.2480 | 0.08536 | 1.0217 | .29033 | 0.019 | |||
| CP+UCDM | 2.0533 | 0.61812 | 0.834 | 1.0237 | 0.18030 | <0.001 | .7950 | .27397 | ||
| PD | CP | 3.8527 | 1.20632 | 2.0847 | 0.19029 | 1.8910 | .97754 | |||
| CP+CDM | 4.0267 | 0.87767 | <0.001 | 1.9590 | 0.09873 | 0.002 | 1.8850 | .50226 | ||
| CP+UCDM | 4.8000 | 0.58310 | 2.0753 | 0.13818 | 1.9887 | .66102 | 0.831 | |||
| CAL | CP | 4.0100 | 0.77029 | 2.8010 | 0.33954 | 2.9627 | .90532 | |||
| CP+CDM | 4.2900 | 0.61552 | 0.134 | 2.9590 | 0.18646 | 0.018 | 3.0667 | .98113 | 0.435 | |
| CP+UCDM | 4.0077 | 0.42584 | 2.9767 | 0.22043 | 2.7467 | 1.03660 | ||||
PI- Plaque index
GI- Gingival index
BOP- Bleeding on probing
PD- Pocket depth
CAL- Clinical attachment level
Table 2: Intragroup Comparison of Clinical Parameters
| CP | CPDM | CPUDM | ||||||||
| Clinical parameters | Mean | Std. Deviation | P | Mean | Std. Deviation | P | Mean | Std. Deviation | P | |
| PI | baseline` | 2.1343 | .64721 | 1.6600 | .51729 | 2.1010 | .41865 | |||
| one month | 1.2023 | .17838 | <0.001 | 1.0273 | .18495 | <0.001 | 1.1137 | .12500 | ||
| third month | .8017 | .22731 | .6083 | .18657 | .9333 | .09589 | <0.001 | |||
| GI | baseline` | 2.3777 | .60543 | 2.4167 | .74375 | 2.6867 | .37114 | |||
| one month | 1.3607 | .33767 | .9103 | .25701 | <0.001 | 1.0330 | .06829 | <0.001 | ||
| third month | .6950 | .24863 | <0.001 | .9433 | .32065 | .6707 | .19492 | |||
| BOP | baseline` | 2.0767 | .69067 | 2.0533 | .61812 | 2.1467 | .52636 | |||
| one month | 1.1230 | .11108 | <0.001 | 1.0237 | .18030 | <0.001 | 1.2480 | .08536 | ||
| third month | .9307 | .35059 | .7950 | .27397 | 1.0217 | .29033 | <0.001 | |||
| PD | baseline` | 3.8527 | 1.20632 | 4.8000 | .58310 | 4.0267 | .87767 | |||
| one month | 2.0847 | .19029 | 2.0753 | .13818 | <0.001 | 1.9590 | .09873 | <0.001 | ||
| third month | 1.8910 | .97754 | <0.001 | 1.9887 | .66102 | 1.8850 | .50226 | |||
| CAL | baseline` | 4.0100 | .77029 | 4.0077 | .42584 | 4.2900 | .61552 | |||
| one month | 2.8010 | .33954 | 2.9767 | .22043 | <0.001 | 2.9590 | .18646 | <0.001 | ||
| third month | 2.9627 | .90532 | <0.001 | 2.7467 | 1.03660 | 3.0667 | .98113 | |||
PI- Plaque index
GI- Gingival index
BOP- Bleeding on probing
PD- Pocket depth
CAL- Clinical attachment level
Table 3: Inter Group Comparisons of Fbs And Hba1c
| Baseline | 30 days | 90 days | ||||||||
| Glycemic Test | Mean | Std. Deviation | P | Mean | Std. Deviation | P | Mean | Std. Deviation | P | |
| FBS | CP | 82.8067 | 7.50471 | 79.9200 | 7.08001 | 75.0000 | 5.80725 | |||
| CP+CDM | 100.06 | 9.71246 | 0.001 | 91.5433 | 6.95848 | <0.001 | 90.0000 | 6.83803 | <0.001 | |
| CP+UCDM | 174.17 | 56.09898 | 1.3215 | 31.34939 | 125.40 | 29.84050 | ||||
| HBA1c
|
CP | 5.8643 | 1.15340 | 5.8643 | 1.15340 | 5.4767 | .70402 | |||
| CP+CDM | 6.0857 | .71387 | 6.0857 | .71387 | 5.7067 | .66692 | ||||
| CP+UCDM | 9.0930 | 2.18532 | 0.001 | 9.0930 | 2.18532 | <0.001 | 7.5800 | 1.40059 | <0.001 | |
FBS- Fasting blood sugar
Hba1c- Glycosylated haemoglobin
Table 4: Intra Group Comparisons Of Fbs And Hba1c
| CP | CPDM | CPUDM | ||||||||
| Glycemic test | Mean | Std. Deviation | P | Mean | Std. Deviation | P | Mean | Std. Deviation | P | |
| FBS | baseline` | 82.8067 | 7.50471 | 99.2960 | 9.80829 | 174.17 | 56.09898 | |||
| one month | 79.9200 | 7.08001 | <0.001 | 91.5433 | 6.95848 | <0.001 | 132.15 | 31.34939 | <0.001 | |
| third month | 75.4000 | 6.20678 | 90.0000 | 6.83803 | 125.40 | 29.84050 | ||||
| HBA1C | baseline` | 5.8643 | 1.15340 | 6.0857 | .71387 | 9.0930 | 2.18532 | |||
| one month | 5.8643 | 1.15340 | 0.245 | 6.0857 | .71387 | 9.0930 | 2.18532 | <0.001 | ||
| third month | 5.4767 | .70402 | 5.7067 | .66692 | 0.058 | 7.5800 | 1.40059 | |||
FBS- Fasting blood sugar
Hba1c- Glycosylated haemoglobin
Table 5: Intergroup Comparison of Rom In Mg/dl and CARRU
| Reactive oxygen metabolites | Baseline | 30 days | 90 days | |||||||
| Mean | Std. Deviation | P value | Mean | Std. Deviation | P value | Mean | Std. Deviation | P value | ||
| ROM
Mg/dl |
CP | 29.7367 | 7.46642 | 28.0767 | 7.38001 | 24.8893 | 4.11723 | |||
| CP+CDM | 29.7417 | 4.31953 | 0.246 | 27.0100 | 4.25436 | 0.310 | 24.6360 | 3.37327 | 0.369 | |
| CP+UCDM | 27.7357 | 3.15997 | 26.0000 | 3.02860 | 23.7053 | 2.32261 | ||||
| ROM CARRU | CP | 371.83 | 93.30245 | 351.60 | 79.42969 | 311.13 | 51.44246 | |||
| CP+CDM | 345.36 | 41.85704 | 0.239 | 323.93 | 36.48328 | 0.101 | .96.40 | 29.05476 | 0.311 | |
| CP+UCDM | 370.20 | 56.22700 | 353.93 | 55.02785 | 308.05 | 42.11540 | ||||
Table 6: Intragroup Comparison Of Rom In Mg/dl and CARRU
| CP | CPDM | CPUDM | ||||||||
| Reactive oxygen metabolites | Mean | Std. Deviation | P | Mean | Std. Deviation | P | Mean | Std. Deviation | P | |
| ROM/
MG |
baseline` | 29.7367 | 7.46642 | 29.4750 | 4.02383 | 27.7357 | 3.15997 | |||
| one month | 28.0767 | 7.38001 | 0.017 | 27.0793 | 4.41966 | 26.0000 | 3.02860 | 0.004 | ||
| third month | 24.8893 | 4.11723 | 24.0520 | 3.21851 | <0.001 | 23.7053 | 2.32261 | |||
| ROM CARRU | baseline` | 371.83 | 93.30245 | 345.36 | 41.85704 | 370.20 | 56.22700 | |||
| one month | 351.60 | 79.42969 | 0.010 | 323.93 | 36.48328 | 353.93 | 55.02785 | <0.001 | ||
| third month | 311.13 | 51.44246 | 296.40 | 29.05476 | <0.001 | 308.05 | 42.11540 |
Discussion
At baseline, plasma ROM level was higher in all the three groups. Since ROM is reported to be a useful indicator of ROS in blood, the findings from this study indicated that chronic periodontitis increased plasma ROS. Excessive ROS oxidizes DNA, lipids and proteins thereby contributing to tissue damage. In a study conducted by Matthews and Wright, peripheral blood neutrophils from patients with periodontitis exhibited a hyperactive phenotype in terms of production of ROS.11 Periodontal treatment may also affect plasma ROS levels by improving a hyperactive phenotype in blood neutrophils.
In our study, when intergroup comparison was done for clinical parameters, there was statistical significance seen for Plaque index (PI) gingival index(GI) and bleeding on probing (BOP) at one month and three months after treatment. For pocket depth (PD) there was significance seen at baseline and after one month, whereas for clinical attachment level (CAL), significance was observed only at one month after treatment. When intragroup comparison was done for clinical parameters at baseline, one month and three months after treatment there was statistical significance observed in all the three groups. similar to a study done by Al-shammari and Aldredge.12 In another study, Periodontal treatment significantly reduced the serum levels of IL-6 and increased HDL cholesterol in chronic periodontitis and Type-2 diabetes patients.13 The reduction in plasma ROM level and oxidative stress after non-surgical periodontal treatment in the present study was consistent with the previous study. The results obtained in this study appear to demonstrate a strong, statistically significant, association between clinical improvement in the periodontal condition and non-surgical periodontal treatment.
In our study, when intergroup comparison was done for glycemic status using FBS and Hba1C, there was statistically significant reduction seen in all the three groups. When intragroup comparison was done individually for FBS and Hba1C at baseline, one month and three months after non surgical periodontal treatment, there was statistical significance observed for FBS in all the three groups, whereas there was significance observed for Hba1c only in group 3. The results of this study suggests that following periodontal therapy there is a statistically significant improvement in glycemic control. In a patient with diagnosed diabetes, the HbA1C level is used to monitor the patient’s overall glycemic control. HbA1C reflects the mean glucose level over the preceding 2–3 months. Periodontal treatment that reduces periodontal inflammation may help to restore insulin sensitivity, thereby improving glycemic control.14 Studies done by Janket and Grossi et al suggested that an improvement in a subject’s periodontal health can positively affect his glycemic metabolic control.15,16
In our study, when intergroup comparison was done for ROM both in mg/dl and CARRU units, there was no statistical significance. When intragroup comparison was done for ROM at baseline, one month and three months after non-surgical periodontal treatment, there was statistical significance observed in all the three groups. There was a positive association between reduction in ROM level and BOP, which was significant in our study. This was in accordance with the study done by Naofumi tamaki etal.17 Since BOP reflects the present disease activity in the periodontium, the decrease in the plasma ROM level might be due to the reduction in disease activity in the periodontium.18
Various studies done by Ekuni and Tomofuji et al revealed that periodontal inflammation induces oxidative tissue damage in the aorta19 and liver with increasing serum ROS.20 Periodontitis may affect various organs through increased ROS in the blood. Oxidative damage is induced by an imbalance between the production of ROS and antioxidant defence.21 Therefore, it may be preferable to consider that reduction in circulating ROS by non-surgical periodontal treatment can offer clinical benefits in terms of reducing the risk for future systemic disease. In addition, the resolution of periodontal inflammation after non-surgical periodontal therapy resulted in decreases in the plasma ROM level.22 It is conceivable that the non-surgical periodontal treatment reduces periodontal inflammation as well as plasma ROS in all the three groups.
Conclusion
In this study, there was improvement in all the clinical parameters compared to the baseline values. There is statistically significant reduction in FBS and Hba1C values after non-surgical periodontal treatment. There is also reduction in plasma ROM level compared to the baseline values. Non-surgical periodontal treatment was effective in improving clinical parameters, glycemic status and also in reducing plasma ROM level after one month and three months of non-surgical periodontal treatment. Longitudinal studies are needed to examine the causal relationship between plasma ROM level and periodontal condition.
References
- Sculley D. V., Langley-Evans S. C. Salivary antioxidants and periodontal disease status. Proc Nutr Soc. 2002; 61:137-143.
CrossRef - Broek G. R., Butterworth C. J., Mathews J. B. Local and systemic total antioxidant capacity in periodontitis and health. J Clin Periodontol. 2004;31:515-521.
CrossRef - Batting M., Bullon P., Wilson M., Neumen h. Oxidative injury and inflammation in periodontal diseases, the challenge of antioxidants to free radicals and reactive oxygen species. Crit Rew oral Biol med. 10;458-475.
- Lamele L., Fiocchi R., Vemocchi A. Evaluation of an automated spectrophotometric assay for reactive oxygen metabolites in serum. Clin chem. Lab Med. 2002;40:673-676.
- Tamaki N., Tomofuji T., Maruyama T., et al. Relationship between periodontal condition and plasma reactive oxygen metabolites in patients in the maintenance phase of periodontal treatment. J Periodontol. 2008;79:2136-2142.
CrossRef - Ekuni D., Tomofuji t., Tamaki N., etal. Mechanical stimulation of gingival reduces plasma 8-OHdG level in rat periodontitis. Arch Oral Biol. 2008;53:324-329.
CrossRef - Chapple I. L., Matthews J. B. The role of reactive oxygen and antioxidant species in periodontal tissue destruction. Periodontol 2000. 2007;43:160-232.
CrossRef - Akalin F. A., Baltacioglu E., Alver A., Karabulut E. Lipid peroxidation levels and total oxidant status in serum, saliva and gingival crevicular fluid in patients with chronic periodontitis. J Clin Periodontol. 2007;34:558-565.
CrossRef - Chritou K., Markoulis N., Pastaka C. Reactive oxygen metabolites as an index of oxidative stress in obstructive sleep apnea patients. Sleep breath. 2003;7:105-110.
CrossRef - Komatsu F., Kagawa Y. Investigation of oxidative stress and dietary habits in mangolian people compared to Japanese people. Nutr Metab(Lond). 2006;3;21.
CrossRef - Brownlee M. Advanced protein glycosylation in diabetes and aging. Ann Rev Med. 1993;46:223-234.
CrossRef - Mathews J. B., Wright H. J., Roberts A., Cooper P. R., Chapple I. L. Hypereactivity and reactivity of peripheral blood neutrophils in chronic periodontitis. Clin Exp Immunol. 2007;147:255-264.
CrossRef - Al-Shammari K. F., Giannobile W. V., Aldredge W. A., et al. Effects of non-surical periodontal therapy on C-telopeptide pyridinoline cross- links (ICTP) and interleukin-1 levels. J Periodontol. 2001;72:1045-1051.
CrossRef - Pussinen P. J., Jauhiainen M., Vikuna-Rautiainen T. et al. Periodontitis decreases the antiatherogenic potency of high density lipoprotein. J Lipid Res. 2004;45:139-147.
CrossRef - Mealey B. L., Rose L. F. Diabetes mellitus and inflammaotory periodontal diseases. Curr Opin Endocrinal Diabetes Obes. 2008;15(2):135-41.
CrossRef - Janket S. J., Wightman A., Baird A. E., et al. Does periodontal treatment improve glycemic control in diabetic patients? A meta analysis of intervention studies. J Dent Res. 2005;84:1154-1159.
CrossRef - Grossi S. G., Skrepcinski F. B., Decaro T., Robertson D. .C, Genco R. J. Treatment of periodontal disease in diabetes reduces glycated haemoglobin. J Periodontol. 1997;68:713–19.
CrossRef - Tamaki N., Tomofuji T ., Ekuni D. Short term effects of Non-Surgical periodontal treatment on plasma level of Reactive Oxygen Metabolites in patients with Chronic Periodontitis. J Periodontol. 2009;80:901-906.
CrossRef - Greenstein G. The role of bleeding upon probing in the diagnosis of periodontal disease. A literature review. J Periodontol. 1984;55:684-688.
CrossRef - Ekuni D., Tomofuji T., Sanbe T., et al. Periodontitis induced lipid peroxidation in rat descending aorta is involved in the initiation of atherosclerosis. J Peiodontol Res. 2009. in press.
CrossRef - Tomofuji T., Ekuni D., Yamanaka R., et al. Chronic administration of lipopolysacccharide and proteases induces periodontal inflammation and hepatic steatosis in rats. J Periodontol. 2007;78:1999-2000.
CrossRef - Chapple I. L. Reactive oxygen species and antioxidants in inflammatory diseases. J Clin Periodontol. 1997;24:287-296.
CrossRef - Tomofuji T., Irie K., Sanbe T., et al. Periodontitis and increasing in circulating oxidative stress. Jap Dent Sci Rev. 2009. in press.
CrossRef

This work is licensed under a Creative Commons Attribution 4.0 International License.


