

Manuscript accepted on : 06 March 2017
Published online on: --
Plagiarism Check: Yes
Crop Performance and Water Productivity of Irrigated Rice under Different Water Management Systems
Uttam Kumer Sarker1, Romij Uddin1, Abdur Rahman Sarkar1, Abdus Salam1, Ahmed Khairul Hasan1 and Sang Un Park2
1Department of Agronomy, Bangladesh Agricultural University, Mymensingh-2202, Bangladesh.
2Department of Crop Science, Chungnam National University, 99 Daehak-ro, Yuseong-gu, Daejeon 34134, Korea.
Corresponding Author E-mail: supark@cnu.ac.kr
DOI : http://dx.doi.org/10.13005/bbra/2424

ABSTRACT:
Increment of rice production to feed the growing population under increasing water scarcity is of great concern for recent days. Moreover, the water is a very limiting input for the crop production and its efficiency is relatively low. Physiological attributes and yield performance of high yielding (HYV) rice cultivars need to be evaluated by minimizing water loss. Therefore, thefield experiment was conducted during November, 2015 to May, 2016 under irrigated conditions in Bangladesh to investigate the impact of cultivars and water management on growth dynamics, yield and water productivity. Five HYV boro (dry season irrigated) rice cultivars viz. BRRI dhan28, BRRI dhan29, BRRI dhan60, Binadhan-8 and Binadhan-10along with four water management systems such as continuous saturation (CS), water application at 8, 10 days after disappearance of ponded water (DAD) and BRRI management irrigation systems(AWD) were included in the study. This study aimed to determine suitable cultivar and water management system for better production of rice. The study revealed that cultivars Binadhan-10 had highest value of leaf area index (LAI), number of effective tillers hill-1, and number of grains panicle-1. Growth and yield were increased with water application up to 8- DAD after which these factors declined with increasing water stress at 10- DAD and AWD. The result also showed that the crop grown at CS condition did not increase the yield, rather caused the wastage of irrigation water. The water productivity was the highest (0.240 t ha-1cm-1) in 10- DAD treatment, obviously due to minimum water use but highest yield was observed in 8- DAD because of optimum use of water and non-stress condition. Therefore, the present study was useful for the selection of the most efficient cultivar, which could be strongly recommended to rice growers to improve crop yield and reduce the use of water.
KEYWORDS: growth stage; HYV rice; subtropical environment; water stress; water productivity
Download this article as:| Copy the following to cite this article: Sarker U. K, Uddin R, Sarkar A. R, Salam A, Hasan A. K, Park S. U. Crop Performance and Water Productivity of Irrigated Rice under Different Water Management Systems. Biosci Biotech Res Asia 2017;14(1). |
| Copy the following to cite this URL: Sarker U. K, Uddin R, Sarkar A. R, Salam A, Hasan A. K, Park S. U. Crop Performance and Water Productivity of Irrigated Rice under Different Water Management Systems. Biosci Biotech Res Asia 2017;14(1). Available from: https://www.biotech-asia.org/?p=23048 |
Introduction
In recent years, agriculture is facing two major challenges that include enhancement of food production to supply among growing world population and increasing scarcity of water resources for sustainable production.1 More than 50% of the world’s populations exploit rice as their main staple food. About 60% additional rice than at present will have to produce to meet up the food demands of the expected world population by 2025.2 Rice production under irrigated condition is the leading user of water in the agricultural sector, and its sustainability is intimidated by rising water insufficiency. In consequence, water limitation largely inhibits rice production in Asia3 and rising force to reduce water use due to worldwide water crisis. More than 50% of total freshwater are consumed by irrigated lowland rice where as irrigated flooded rice necessitates two or three times more water than other cereal crops, such as wheat and maize.4 For 1 kg of rice, it is estimated that farmers use 3 to 4 thousand litres of water whereas it actually needs 1.0 to 1.5 thousand litres only. Thus, for irrigation farmers have to pay about 30-40% of the extra cost. This might be due to their ignorance about the need of water for rice cultivation as well as consequence of misuse of water. In addition, rice cultivation is facing struggle with quick urban and industrial development in terms of freshwater resource.5 The requirement for “more rice with less water” is essential for food security, and irrigation plays a vital role in meeting future food needs.6 This issue will necessitate the progress of substitute irrigated rice production methods that involve reduced water than conventional flooded rice.7
Different water saving techniques for rice production have been evolved by researchers such as alternate wetting and drying (AWD),8-9 saturated soil culture,6 direct dry seeding10 and aerobic rice culture.7,11 All the methods have been found to be efficient in reducing water use and improving water productivity, but there are argues on whether these practices will increase or decrease rice yields1). The lower efficiency regarding rice production is associated with drought stress arises from these technologies. This problem recently creates severe threat to ensure food security in the developing world and also in Bangladesh. Although water is used during whole growth periods of rice plant but there are few critical growth stages when drought stress impacts acutely and make a enormous reduction in quantity and quality of yield.
There is inadequate information on the diversity in crop performance under continuous saturation along with other water management systems. Besides, physiological causes of yield difference among high yielding rice cultivars have not been studied comprehensively under Old Brahmaputra Floodplain region, Bangladesh. This information is required to determine physiological and morphological traits to enhance the selection and breeding program of high yielding rice cultivars. There are fewer efforts to study the growth, physiological responses and yield of rice (Oryza sativa L.) to water stress under tropical environment.12 Therefore this study has been carried out to assess the effect of water stress as a measure of water saving technique during the growth period of crop life cycle and yield.
Materials and Methods
Experimental Details
The field trial was carried out at experimental farm of the Agronomy Field Laboratory, Bangladesh Agricultural University, Mymensingh, Bangladesh (latitude: 24°42΄55΄΄, longitude: 90°25΄47΄΄) during boro(dry) seasons of 2015-16 (November to May). The research site (Mymensingh) is belonging to a humid subtropical monsoon climate. The soil of the experimental field was acidic having a pH of 5.8 with medium organic matter and fertility level.13 Treatments consisting of five HYVcultivars of rice viz .BRRI dhan28, BRRI dhan29, BRRI dhan60, BRRI Binadhan-8, Binadhan-10 and four water management systems namely, continuous saturation (CS), water applications made 8, 10 days after disappearance of 4 cm ponded water (DAD), BRRI water management practices (AWD) and . The selected cultivars were the most popular and high-yielding ones cultivated during the boro season. The experiment was conducted following split-plot design allocating water management systems in main plot and cultivars in sub plotand replicated thrice. The size of each plot was 4m × 2.5 m. The distance between individual plot was 0.5 m and that of replication was 1.0 m.
Crop and Water Management
The experimental plot was ploughed, harrowed and puddle to a depth of 15-20 cm. Forty days old seedlings (previously grown in the seedbed) of different cultivars were transplanted on January 19, 2016. Fertilizer was applied @ 150-20-65-18-1.3 in the form of N-P-K-S-Zn. Urea, TSP, MOP, Gypsum and Zinc sulphate were used as fertilizer sources. Except Urea all other fertilizers were applied during the final land preparation. Urea was applied in three different splits at 15, 40 and 70 days after transplanting (DAT), respectively. Four (4) cm of standing water was maintained at the time of transplanting and various water management treatments were assigned after seedling establishment. Water was applied to saturate the soil (without flood) in the CS treatment and for the others treatment, irrigation was applied based on the time period specified for the treatment. The polythene sheets were put in downward 60 cm among different water management systems to prevent seepage and water flow among plots. The irrigation was applied up to 15 days before the harvest of the crop. At early stages of crop growth sometimes weeds were observed and removed by hand. No major insects and diseases were found during the growth period.
Measurements
Observations on phenology of crops were made on weekly basis in the experiment. The anthesis date of rice was recorded following the decimal code scale anticipated by Zadoks et al.14 Date of anthesis was documented when 50% plants reached this period for each plot. Observations on growth dynamics were made at active tillering (AT), panicle initiation (PI), flowering (FL), and physiological maturity (PM). Data on plant height, leaf area index (LAI), crop growth rate (CGR), relative growth rate (RGR), and net assimilation rate (NAR) were collected for each plot. Five healthy plants were selected at random from each treatment on which measurements were made. The leaf blades were detached from the leaf sheath and leaf area was determined by a leaf area meter (LI 3100, Licor, Inc., Lincoln NE, USA). From leaf area data, LAI was calculated accordingly. Then the plant samples were dried using electric oven at 65°C for 72 hour for constant weight, and their dry weights were recorded. LAI, CGR, RGR, and NAR were computed using the standard formulae.15-16 Amount of applied irrigated water was recorded from seedling establishment to 15 days before harvest. Water productivity of rice was calculated by using following formula.17
![]()
Where, Y = grain yield (t ha-1), WR = total amount of water used (cm)
Relative water Content (RWC) was determined according to Smart and Bingham18
Here, FW= Fresh leaf weight, TW= Turgid leaf weight, DW= Leaf dry weight
For FW, fresh leaf sample was cut into a small disc and then fresh leaf weight was measured
For TW, the leaf sample (disc shaped) was soaked in distilled water for 4hr in the dark and thereafter the turgid leaf weight was measured and
For DW, the leaf was dried at 80° C in an electric oven for 24 hr and then weight was taken.
Maturity date was identified when 90% of grains had matured. At maturity, the whole plant was cut at the ground level with a sickle. The harvested crop from each pot was bundled separately and tagged appropriately. After recording data for plant height and panicle length for each plant, plant materials were sun dried for grain collection. Finally, grain and straw yield and yield contributing parameters were recorded separately.
Statistical Analysis
Data on crop growth, yield components, and yield of rice were compiled and tabulated for statistical analysis. The recorded data on various plant characters were statistically analyzed to find out the significance of variation resulting from the experimental treatments. All the collected data were analyzed following analysis of variance (ANOVA) techniqueand mean differences were adjudged by Duncan’s Multiple Range Test19 using a computer operated program namely MSTAT-C.
Results and Discussion
Crop Phenology
Fig. 1 showed the patterns of phenology for 5 cultivars. The average length of life cycle of cultivars was 140 days (d). The BRRI cultivars had different flowering dates and growth duration differing by 12 d. Besides BRRI cultivars had longer duration than BINA cultivars except grain filling period. Crop duration from emergence to FL among all cultivars varied from 100 d to 116 d. Grain filling duration exhibited variation based on cultivar from 29 d for BRRI dhan28 to 34 for Binadhan-10. It was observed that Binadhan-10 had lower duration than other cultivars along with more grain filling period. Higher grain filling duration have positive response on yield.20
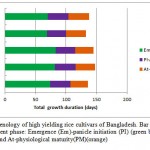 |
Figure 1: Crop phenology of high yielding rice cultivars of Bangladesh. Bar shows the length of each development phase: Emergence (Em)-panicle initiation (PI) (green bars), PI-anthesis (At)(purple bar) and At-physiological maturity(PM)(orange)
|
Growth Parameters
Significant effects of different cultivars and water management conditions on plant height except AT, PI and LAI except AT are presented in Table 1. Plant height increased gradually over time attaining the greatest height at PM. The highest plant height (94.50 cm) at FL was measured for Binadhan-10 while the lowest (84.33 cm) was inBRRI dhan60. Plant height was also significantly (P<0.05) higher under different water management conditions (DAD) than under CS and AWD conditions.Plant height was highest in 8-DAD irrespective of all growth stages (from 85.50 cm to 89.33 cm at CS and 89.92 cm to 94.50 cm at 8-DAD).Although there might be varietal differences in plant growth but intermittent irrigation at optimum DAD level may also enhance plant height. This continues to support the findings of 21-23 among others, who detailed that rice does not need to be continuously submerged to produce taller plant if adequate water is provided at critical growth stages.
Table 1: Plant height and leaf area index of rice as influenced by cultivar and water managementsystems
| Cultivars | Watermanagement | Plant height (cm) | Leaf area Index (LAI) | ||||||
| AT | PI | FL | PM | AT | PI | FL | PM | ||
| BRRI dhan28 | CS | 31.62 | 59.53 | 87.17 j | 87.92 k | 0.04 | 0.80 h | 2.74i | 2.40 j |
| 8- DAD | 37.03 | 63.00 | 92.17 cd | 92.92 cd | 0.07 | 0.94 def | 3.84d-g | 3.01hi | |
| 10-DAD | 35.28 | 62.42 | 90.83 e | 91.58 e | 0.06 | 0.88 fgh | 3.63 fgh | 2.77ij | |
| AWD | 33.28 | 60.64 | 89.33 g | 90.08 gh | 0.05 | 0.82 gh | 3.42 h | 2.72 ij | |
| BRRI dhan29 | CS | 30.69 | 58.86 | 85.50 l | 86.25 m | 0.05 | 0.84gh | 2.84 i | 2.49 j |
| 8- DAD | 35.95 | 61.97 | 91.00 e | 91.75 e | 0.09 | 1.15b | 4.43 c | 3.83 b-e | |
| 10-DAD | 34.61 | 61.08 | 89.17 g | 89.92 h | 0.08 | 0.98 cd | 3.98 de | 3.49d-g | |
| AWD | 32.62 | 59.42 | 87.50 ij | 88.25 jk | 0.07 | 0.89efg | 3.70 e-h | 3.44 efg | |
| BRRI dhan 60 | CS | 28.42 | 56.53 | 84.33 m | 85.08 n | 0.05 | 0.82gh | 2.79 i | 2.46 j |
| 8- DAD | 35.09 | 60.20 | 89.92f | 90.67 fg | 0.07 | 0.99cd | 3.91 def | 3.39 fgh | |
| 10-DAD | 33.61 | 59.53 | 88.17 h | 88.92 i | 0.07 | 0.96cde | 3.69 e-h | 3.32 fgh | |
| AWD | 31.59 | 57.08 | 86.17 k | 86.92 l | 0.06 | 0.86 fgh | 3.54 gh | 3.23 gh | |
| Binadhan -8 | CS | 32.41 | 60.64 | 88.00 hi | 88.75 ij | 0.06 | 0.86 fgh | 2.91i | 2.57 j |
| 8- DAD | 39.62 | 66.75 | 93.17 b | 93.92 b | 0.10 | 1.26 a | 4.92 ab | 4.23 ab | |
| 10-DAD | 37.61 | 64.89 | 92.67 bc | 93.42 bc | 0.09 | 1.04 c | 4.49 c | 3.73 c-f | |
| AWD | 35.46 | 62.87 | 90.00 f | 90.75 f | 0.07 | 0.98 cd | 4.12 d | 3.57 c-g | |
| Binadhan -10 | CS | 34.28 | 64.09 | 89.33g | 90.08 h | 0.06 | 0.93def | 3.04 i | 2.80 ij |
| 8- DAD | 40.28 | 67.53 | 94.50 a | 95.25 a | 0.11 | 1.32 a | 5.15 a | 4.46 a | |
| 10-DAD | 39.62 | 66.09 | 93.00 b | 93.75 b | 0.10 | 1.17 b | 4.81 b | 3.93 bc | |
| AWD | 36.08 | 64.64 | 91.67 d | 92.42 d | 0.08 | 1.03 c | 4.46 c | 3.87 bcd | |
| ANOVA | |||||||||
| Cultivars (V) | ** | ** | ** | ** | ** | ** | ** | ** | |
| Water Management (W) | ** | ** | ** | ** | ** | ** | ** | ** | |
| V × W | NS | NS | * | * | NS | ** | ** | ** | |
| CV (%) | 3.97 | 5.10 | 0.36 | 0.38 | 6.91 | 4.32 | 4.69 | 6.66 | |
Within a column, means followed by same letters are not significantly different at P=0.05 probability level by Duncan’s Multiple Range Test (DMRT)
AT : Active tillering, PI : Panicle imitation, Fl: Flowering, PM : Physiological maturity
*: Significant difference at P ≤ 0.05; **: Significant difference at P ≤ 0.01; NS : Not Significant
LAI of rice with cultivars anddifferent water management condition demonstrated substantial differences across the growth stages except AT. In view of the growth stage, LAI increased stridently, reaching a peak at FL and then decreased irrespective of treatment differences.The rate of decline of LAI after attaining its peak was quicker. Maximum LAI (5.15) was achieved at FL by Binadhan-10.LAI at 8- DAD washigher than all other water management conditions while lowest in CS condition. As it is well known, leaf area index is caused by two major factors, namely, the increase in tiller numbers and leaf size. Higher leaf area was under intermittent irrigation at 8-DAD compared with CS and AWD. Such observations continue to support the findings of Thakur et al.,24 who stated that leaf number and size were significantly increased and produced higher LAI compared with those of CS. Similarly, Lin et al.25 elucidated that intermittent irrigation promoted higher LAI compared with CS while Tadesse et al.26 highlighted that continuous and prolonged flooding resulted in the lower leaf area index, crop growth rate, net assimilation rate and productive tillers. A significant association (R2=0.96, p<0.01) between grain yield and LAI at FL is shown in Fig 2a. Cultivars having a more LAI could possibly absorb more solar radiation, photosynthesize more, and ultimately produce higher yields.
Considering CGR, it is observed that CGR also was raised until FL and then decreased (Table 2). CGR attained maximum of 24.34 g cm-2 day-1 at FL for Binadhan-10 and minimum was noted at BRRI dhan28. CGR with 8-DAD, 10-DAD and AWDwas 62.38, 38.43 and 18.15 % higher, respectively than CS treatments for Binadhan-10. Grain yield variations for cultivars were significantly and positively correlated (R2=0.70, p<0.01) with CGR at FL (Fig. 2b).At early stage of crop growth, RGR was more and tended to show decreasing trend with the progress of plant age. Based on the trend in cultivars,the highest RGR was obtained from Binadhan-8 while being lowest in BRRI dhan28 at FL.The raise of metabolically active tissue that contributed less to the plant growth is ultimately reducing RGR.The tendency of NAR was comparatively equal and downward in mutually cultivars and water management treatments (Table 2). NAR was reduced with the advancement of growth stage and it can be due to the more tillering and leaf area development. The percentage of increase in NAR of 8-DADwas4.62% compared to CSfor Binahdan-10. RWC was significantly affected by both cultivars and water management systems. Thetolerance of cultivars to drought condition greatly depends on intensity of RWC (%).The highest RWC (95.40 %) was showed by Binadhan-10 while lowest RWC (85.05 %) was recorded in BRRI dhan28 at FL. The majoritycultivars had a minute change in RWC at FL and PM of water stress.Water stress significant reduced RWC at vegetative and flowering stages after a certain period.
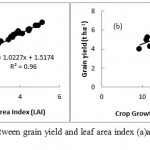 |
Figure 2: Relationship between grain yield and leaf area index (a)and crop growth rate (b) at flowering stage
|
Table 2: Physiological and bio-chemical parameters of rice as influenced by cultivar and water managementsystems
| Cultivars | Water Management | CGR (g cm -2day-1)
|
RGR (g-1g-1day) | NAR (mg cm-2day-1)
|
RWC (%) | |||||||||
| AT-PI | PI-FL | FL-PM | AT-PI | PI-FL | FL-PM | AT-PI | PI-FL | FL-PM | AT | PI | FL | PM | ||
| BRRI dhan28 | CS | 7.56 k | 9.30 l | 6.63 def | 45.15 | 13.20 fg | 5.50 b | 1.253 fg | 0.256 | 0.110 cd | 46.34 i | 54.84 g | 85.05 d | 80.25 e |
| 8-DAD | 11.25 d | 12.88 ij | 11.17 ab | 41.78 | 12.36 g | 6.39a | 1.447 a | 0.273 | 0.140 a | 69.84 c-f | 80.61 def | 91.02 bc | 88.59 bcd | |
| 10-DAD | 10.03 ef | 11.34 k | 7.23 d | 42.37 | 12.29 g | 4.81cd | 1.380 ab | 0.250 | 0.100 de | 70.57 cde | 82.90 b-f | 92.30abc | 90.11a-d | |
| AWD | 8.72 ij | 11.11 k | 5.69 fgh | 43.71 | 13.43 efg | 4.29 de | 1.310 b-g | 0.260 | 0.0800 fg | 67.83 def | 85.32 a-d | 94.19ab | 92.24abc | |
| BRRI dhan29 | CS | 8.68 ij | 13.44 hi | 3.65 i | 41.94 | 15.29 abc | 2.64 ij | 1.320 b-g | 0.360 | 0.0600 hi | 58.82 h | 75.00f | 92.00abc | 89.19a-d |
| 8-DAD | 13.09 b | 16.63 de | 12.09 a | 39.14 | 13.17 fg | 5.69 b | 1.380 ab | 0.300 | 0.130 ab | 71.69 cd | 82.54 c-f | 91.65abc | 89.43a-d | |
| 10-DAD | 11.52 cd | 14.56 gh | 8.37 c | 40.00 | 13.24 fg | 4.63 d | 1.360 bcd | 0.290 | 0.100 de | 73.28bcd | 85.48 a-d | 93.03abc | 91.10a-d | |
| AWD | 9.61 fgh | 14.49 gh | 6.04 d-g | 39.77 | 14.85 a-d | 3.71f | 1.290 c-g | 0.320 | 0.0700 gh | 70.74 cde | 85.97a-d | 93.90ab | 92.00a-d | |
| BRRI dhan60 | CS | 8.06 jk | 11.88 jk | 4.97 gh | 43.43 | 14.79 a-d | 3.80ef | 1.280 d-g | 0.323 | 0.0800 fg | 61.35 gh | 86.27a-d | 95.33a | 93.52abc |
| 8-DAD | 11.40 d | 16.65 e | 10.30 b | 39.68 | 14.50 b-e | 5.25bc | 1.370 abc | 0.340 | 0.120 bc | 69.44 c-f | 80.26 def | 90.95 bc | 88.50 bcd | |
| 10-DAD | 10.43 e | 14.40 gh | 5.710 fgh | 40.14 | 13.95 def | 3.43fg | 1.300 b-g | 0.310 | 0.0700 gh | 73.98bc | 87.47a-d | 93.96ab | 92.22abc | |
| AWD | 8.95 hi | 13.45 hi | 4.77 h | 41.28 | 15.03 a-d | 3.24fgh | 1.260 fg | 0.310 | 0.0600 hi | 64.69 fg | 79.77 def | 92.43abc | 89.96a-d | |
| Binadhan-8 | CS | 9.22 ghi | 14.21 gh | 3.31 i | 40.39 | 15.57 ab | 2.19 j | 1.350 b-e | 0.370 | 0.0500 i | 65.76 efg | 76.23 ef | 89.68 c | 86.81 d |
| 8-DAD | 13.28 b | 22.52 b | 5.57 fgh | 36.83 | 15.85 a | 2.41 j | 1.250 g | 0.363 | 0.0500 i | 77.23 ab | 87.47a-d | 93.18abc | 91.50a-d | |
| 10-DAD | 12.20 c | 15.91 ef | 9.02 c | 37.53 | 13.32 fg | 4.54 d | 1.340 b-f | 0.290 | 0.100 de | 71.47 cde | 81.12 def | 90.71 bc | 88.36 cd | |
| AWD | 10.43 e | 14.89 fg | 6.15 d-g | 38.14 | 14.23 c-f | 3.59fg | 1.270 efg | 0.296 | 0.0700 gh | 71.44 cde | 83.51b-e | 92.41abc | 90.28a-d | |
| Binadhan-10 | CS | 9.69 efg | 14.99 fg | 5.97 e-h | 40.37 | 15.37 abc | 3.62fg | 1.300 b-g | 0.366 | 0.0900 ef | 81.41 a | 92.64a | 95.40a | 94.25a |
| 8-DAD | 15.31 a | 24.34 a | 7.10 de | 36.55 | 15.18 abc | 2.71 hij | 1.360 bcd | 0.376 | 0.0600 hi | 82.42 a | 90.72ab | 94.06ab | 92.82abc | |
| 10-DAD | 13.30 b | 20.75 c | 7.03 de | 36.56 | 15.03 a-d | 3.06 ghi | 1.297 b-g | 0.350 | 0.0700 gh | 80.66 a | 89.41abc | 93.57ab | 92.17abc | |
| AWD | 11.49 cd | 17.71 d | 5.94 e-h | 36.94 | 14.99 a-d | 3.07 ghi | 1.300 b-g | 0.326 | 0.0600 hi | 81.51 a | 91.71a | 94.87a | 93.65ab | |
| ANOVA | ||||||||||||||
| Cultivars (V) | ** | ** | ** | ** | ** | ** | NS | ** | ** | ** | ** | ** | ** | |
| Water Management (W) | ** | ** | ** | ** | ** | ** | ** | ** | ** | ** | ** | * | * | |
| V × W | ** | ** | ** | NS | ** | ** | ** | NS | ** | ** | ** | ** | ** | |
| CV (%) | 3.82 | 4.10 | 9.00 | 3.23 | 4.30 | 7.79 | 3.62 | 11.14 | 10.71 | 4.23 | 5.03 | 2.07 | 2.92 | |
Within a column, means followed by same letters are not significantly different at P=0.05 probability level by Duncan’s Multiple Range Test (DMRT)
AT : Active tillering; PI : Panicle initiation; Fl : Flowering; PM : Physiological maturity; CGR : Crop growth rate; RGR : Relative growth rate; NAR : Net assimilation rate; RWC : Relative water content
*: Significant difference at P ≤ 0.05;
** : Significant difference at P ≤ 0.01; NS- Not Significant
Yield Components and Yield
Yield attributes and yield of cultivars along with water management systems are presented in Table 3.Response of cultivars and water management systems on most of yield attributes and yield were significant except 1000 grain weight and harvest index (%).The cultivar Binadhan-10 produced highest number of effective tillers hill-1 whereas lowest number was noticed in BRRI dhan28.Grain yield variations for cultivars were significantly positively correlated (R2=0.78, p<0.01) with effective tillers hill-1 (Fig. 3a). Similarly, number of grains panicle-1, grain yield and straw yield was higher in Binadhan-10. There was a significant positive correlation (R2=0.89, p<0.01) between grains panicle-1 and grain yield (Fig. 3b). Katsura et al.27 stated that rice yield is mainly dependent on producing ability of dry matter before heading.
Table 3: Yields attributes and yield of rice as influenced by cultivar and water managementsystems
| Cultivars | Water management | Effective tillers hill-1 | No. of grains panicle-1 | 1000 grain weight (g) | Grain yield (t ha-1)a | Straw yield (t ha-1)a | Harvest index (%) |
| BRRI dhan28 | CS | 11.51 k | 78.39 j | 20.75 | 4.01 n | 5.39 gh | 42.71 |
| 8-DAD | 14.27efg | 92.22fg | 23.86 | 5.67efg | 6.71de | 45.81 | |
| 10-DAD | 13.20 hi | 83.76 hi | 22.51 | 5.16 j | 6.14 f | 45.70 | |
| AWD | 12.30 j | 81.30ij | 21.13 | 4.93 k | 5.69 g | 46.44 | |
| BRRI dhan29 | CS | 12.93 i | 81.46 ij | 21.30 | 4.36 lm | 5.12 h | 45.99 |
| 8-DAD | 15.40 c | 99.72 cd | 24.56 | 6.01 cd | 7.11cd | 45.81 | |
| 10-DAD | 14.53 def | 94.08 ef | 24.31 | 5.66 efg | 6.45 ef | 46.73 | |
| AWD | 13.33 hi | 91.99 fg | 22.98 | 5.43 hi | 6.29 ef | 46.33 | |
| BRRI dhan60 | CS | 12.07 jk | 79.62 j | 21.09 | 4.26 m | 5.00 h | 46.05 |
| 8-DAD | 14.60 def | 96.84 de | 24.35 | 5.81 def | 6.96 d | 45.50 | |
| 10-DAD | 14.00 fg | 91.49fg | 23.69 | 5.49 gh | 6.32 ef | 46.47 | |
| AWD | 13.13 i | 88.80 g | 22.45 | 5.24 ij | 6.22 f | 45.72 | |
| Binadhan-8 | CS | 13.07 i | 85.04 h | 22.55 | 4.53 l | 5.41gh | 45.58 |
| 8-DAD | 16.20 b | 105.5 b | 25.12 | 6.40 b | 7.58ab | 45.77 | |
| 10-DAD | 14.73 cde | 99.33 cd | 24.74 | 6.06 c | 6.96 d | 46.56 | |
| AWD | 13.83 gh | 94.71 ef | 22.95 | 5.60 fgh | 6.44 ef | 46.55 | |
| Binadhan-10 | CS | 14.87de | 92.56f | 22.58 | 4.80 k | 5.71 g | 45.64 |
| 8-DAD | 18.47 a | 111.0 a | 25.89 | 6.80 a | 7.96a | 46.07 | |
| 10-DAD | 16.27 b | 105.9 b | 25.72 | 6.45 b | 7.49 bc | 46.27 | |
| AWD | 15.07 cd | 100.8 c | 23.52 | 5.88cde | 6.90 d | 46.01 | |
| ANOVA | |||||||
| Cultivars (V) | ** | ** | ** | ** | ** | * | |
| Water Management (W) | ** | ** | ** | ** | ** | * | |
| V × W | * | * | NS | * | * | NS | |
| CV (%) | 2.61 | 2.07 | 5.18 | 2.34 | 3.72 | 2.36 |
Within a column, means followed by same letters are not significantly different at P=0.05 probability level by Duncan’s Multiple Range Test (DMRT)
*: Significant difference at P ≤ 0.05;
**: Significant difference at P ≤ 0.01;NS- Not Significant
a Grain and straw yieldsarerecorded at 14 % moisture content
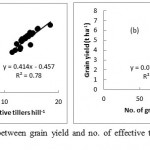 |
Figure 3: Relationship between grain yield and no. of effective tillers hill-1 (a)and grains panicle-1 (b) at harvest
|
Based on different water management, 8- DAD had significantly (P<0.05) higher values of yield attributes and yield compared to others. Effective tillers hill-1 was highest in 8-DAD followed by 10- DAD, AWD and CS irrespective of cultivars. Similar trend was also observed for grain panicle-1. The grain yield in 8-DAD, 10-DAD and AWD was41.67%, 34.38 % and22.50 % higher respectively than that recorded under CS condition for Binadhan-10. Beyond the 8- DAD treatments, the yield tended to decrease and it may be due to encountered moisture stress.The mechanism by which intermittent irrigation for DAD treatments increases grain yield and water productivity is not fully well known. Many agronomic and physiological processes are to be concerned, such as altered hormonal levels in rice plants, increase in proportion of productive tillers and decrease in the leaf angle of the top three leaves at heading time, greater root biomass in deeper soil and higher root oxidation activity (ROA), and an enhancement in carbon remobilization from vegetative tissues to kernels.28-29 Intermittent irrigation promotes abscisic acid (ABA) levels in plants during the soil drying period.30 ABA has a key role in connection to sugar-signaling pathways and increases the ability of plant tissues to respond to subsequent sugar signals31. Moreover, intermittent irrigation markedly increases cytokinin levels (zeatin + zeatin riboside) (Z + ZR) in roots and leaves and leaf photosynthetic rate during the rewatering period. Both Z and ZR play a major role in promoting cell division and delaying senescence.32 High cytokinin concentrations during grain setting and filling periods may contribute to better grain filling by promoting endosperm cell division, delaying senescence, and/or regulating key enzymes involved in the sucrose-to starch pathway in rice kernels.22 On the contrary, in our study the AWD applied which turned in to a severe AWD regime. In that case, photosynthesis is inhibited and plants cannot rehydrate overnight during the soil drying period could markedly reduce grain yield and quality, although it also increases water productivity compared to a CS condition.
Water use and Productivity
Table 4 showed the water utilization and water productivity with different water management treatments. Among all the water management treatments, total water use was maximum for CS (122 cm) and minimum for treatment 10-DAD and AWD (24 cm), 8-DAD (28 cm) and AWD (40cm) respectively. There were 80.33% and 77.05% less water required for 10-DAD, AWD and 8-DAD compared to CS. Among the treatments in which irrigation water applied, water productivity was the highest (0.240 t ha-1 cm-1) in treatment 10-DAD and was found to be least (0.036 t ha-1 cm-1) in CS.
Table 4: Water use and water productivity under different water management systems
| Treatments | No.of irrigations | Frequency of water application (DAT) | Water used for crop establishment (cm) | Irrigation water applied | Total water use | Grain yield (tha-1) | Water productivity (t ha-1 cm-1) |
| (cm) | (cm) | ||||||
| 4.394 | 0.036 | ||||||
| CS | Continuous saturation | Every alternate day | 4 | 118 | 122 | ||
| 6.139 | 0.219 | ||||||
| 8-DAD | 6 | 30,40,50,60,70,80 | 4 | 24 | 28 | ||
| 5.765 | 0.24 | ||||||
| 10-DAD | 5 | 30,42,54, 66,78 | 4 | 20 | 24 | ||
| 5.417 | 0.226 | ||||||
| AWD | 5 | 30, 43, 56,69,82 | 4 | 20 | 24 | ||
| Level of significance | ** | ||||||
| CV (%) | 2.34 |
Within a column, means followed by same letters are not significantly different at P=0.05 probability level by
Duncan’s Multiple Range Test (DMRT)
** : Significant difference at P ≤ 0.01
Conclusions
It is evident from these results that Binadhan-10 has highest values of physiological, yield contributing and yield parameters followed by Binadhan-8. on the other hand, 8-DAD treatments had beneficial effects on physiological parameter compared with CS, 10- DAD and AWD.The highest grain yield was also obtained from 8-DAD. So this cultivar is the best for cultivation in intermittent irrigation at 8- DAD treatment. The greatest water productivity was found with the 10-DAD treatment. This indicates that water productivity at 10-DAD are more than 8-DAD due to reduced amount of water requirement but in respect of yield 8-DAD treatment is more than 10 DAD due to proficient utilization of water.
Acknowledgments
This research work was supported by Ministry of Science and Technology (MOST), Government of the People’s Republic of Bangladesh. The authors are grateful to their support during implementation of the study.
References
- Bouman B. A. M. A conceptual framework for the improvement of crop water productivity at different spatial scales. Syst. 2007;93:43–60.
CrossRef - Fageria N. K. Yield physiology of rice. Plant Nutr. 2007;30:843–79.
CrossRef - Arora V. K. Application of a rice growth and water balance model in an irrigated semi-arid subtropical environment. Water Manage. 2006;83:51–57.
CrossRef - Barker R., Dawe D., Tuong T. P., Bhuiyan S. I., Guerra L. C. The outlook for water resources in the year 2020: challenges for research on water management in rice production. In: Assessment and Orientation Towards the 21st Century. Proceedings of the 19th Session of the International Rice Commission, 7–9 September 1998, Cairo, Egypt. Food and Agriculture Organization. 1998;96–109.
- Bouman B. A. M., Lampayan R. M., Tuong T. P. Water management in irrigated rice: coping with water scarcity. International Rice Research Institute, Los Banos. 2007.
- Tuong T. P., Bouman B. A. M., Mortimer M. More rice less water—integrated approaches for increasing water productivity in irrigated rice-based systems in Asia. Plant Prod. Sci. 2005;8:231–41.
CrossRef - Bouman B. A. M., Peng S., Castaneda A. R., Visperas R. M. Yield and water use of irrigated tropical aerobic rice systems. Water Manage. 2005;74:87–105.
CrossRef - Bouman B. A. M., Tuong T. P. Field water management to save water and increase its productivity in irrigated lowland rice. Water Manage. 2001;49:11–30.
CrossRef - Belder P., Bouman B. A. M., Cabangon R., Guoan L., Quilang E. J. P., Li Y., Spiertz J. H. J., Tuong T. P. Effect of water saving irrigation on rice yield and water use in typical lowland conditions in Asia. Water Manage. 2004;65:193–210.
CrossRef - Tabbal D. F., Bouman B. A. M., Bhuiyan S. I., Sibayan E. B., Sattar M. A. On-farm strategies for reducing water input in irrigated rice: case studies in the Philippines. Water Manage. 2002;56:93–112.
CrossRef - Kato Y., Okami M., Katsura K. Yield potential and water use efficiency of aerobic rice (Oryza sativa L.) in Japan. Field Crops Res. 2009;113:328–34.
CrossRef - Zain N. A. M., Ismail M. R., Puteh A., Mahmood M., Islam M. R. Impact of cyclic water stress on growth, physiological responses and yield of rice (Oryza sativa L.) grown in tropical environment. Rural. 2014;44:2136-41.
CrossRef - UNDP and FAO. Land resources Appraisal of Bangladesh for Agricultural Development, Report. 2. Agro-Ecological Regions of Bangladesh. BARC/UNDP, New Airport road, farmgate, Dhaka, 1207. 1988;212-21.
- Zadoks J. C., Chang T. T., Konzat C. F. A decimal code for the growth stages of cereals. Weed Res. 1974;14:415–21.
CrossRef - Radford P. J. Growth analysis formulae-their use and abuse. Crop Sci. 1967;7:171-75.
CrossRef - Hunt R. Plant Growth Analysis. Studies in Biology, No. 96. Edward Arnold (Publishes) Limited, 41. Bedford Square, London. 1978.
- Michael A. M. Irrigation Theory and Practice. Vika publishing house, New Delhi. 1978.
- Smart R. E., Bingham G. E. Rapid estimates of relative water content. Plant Physiol. 1974;53:258–60.
CrossRef - Gomez K. A., Gomez A. A. Statistical Procedure for Agricultural Research, 2nd Edn., International Rice Research Institute, Los Banos, Manila, The Phillipines. 1984;204-207.
- Yang W., Peng S., Dionisio-Sese M. L, Laza R. C., Visperas R. M. Grain filling duration, a crucial determinant of genotypic variation of grain yield in field-grown tropical irrigated rice. Field Crops Res. 2008;105:221-27.
CrossRef - Mishra A., Salokhe V. Flooding stress: The effects of planting pattern and water regime on root morphology, physiology and grain yield of rice. Agron. Crop Sci. 2010;196:368–378.
CrossRef - Zhang H., Chen T. T., Wang Z. Q., Yang J. C., Zhang J. H. Involvement of cytokinins in the grain filling of rice under alternate wetting and drying irrigation. Exp. Bot. 2010;61:3719–33.
CrossRef - Kima A. S., Chung W. G., Wang Y. M. Improving irrigated lowland rice water use efficiency under saturated soil culture for adoption in tropical climate conditions. Water. 2014;6:2830–46.
CrossRef - Thakur A. K., Rath S., Patil D., Kumar A. Effects on rice plant morphology and physiology of water and associated management practices of the system of rice intensification and their implications for crop performance. Paddy Water Environ. 2011;9:13–24.
CrossRef - Lin X., Zhu D., Lin X. Effects of water management and organic fertilization with SRI crop practices on hybrid rice performance and rhizosphere dynamics. Paddy Water Environ. 2011;9:33–39.
CrossRef - Tadesse T., Dechassa N., Bayu W., Gebeyehu S. Impact of rainwater management on growth and yield of rainfed lowland rice. Wudpecker J. Agric. Res. 2013;2:108–14.
- Katsura K., Maeda S., Horie T., Shiraiwa T. Analysis of yield attributes and crop physiological traits of Liangyoupeijiu, a hybrid rice recently bred in China. Field Crops Res. 2007;103:170-77.
CrossRef - Chu G., Wang Z. Q., Zhang H., Liu L. J., Yang J. C., Zhang J. H. Alternate wetting and moderate drying increases rice yield and reduces methane emission in paddy field with wheat straw residue incorporation. Food Energy Secur. 2015;4:238–254.
CrossRef - Wang Z. Q., Zhang W. Y., Beebout S. S., Zhang H., Liu L. J., Yang J. C., Zhang J. H. Grain yield, water and nitrogen use efficiencies of rice as influenced by irrigation regimes and their interaction with nitrogen rates. Field Crops Res. 2016;193:54–69.
CrossRef - Chen T. T., Xu G. W., Wang Z. Q., Zhang H., Yang J. C., Zhang J. H. Expression of proteins in superior and inferior spikelets of rice during grain filling under different irrigation. Proteomics. 2016;16:102–21.
CrossRef - Rock C. D., Quatrano R. S. The role of hormones during seed development, in: P.J. Davies (Ed.), Plant Hormones, Physiology, Biochemistry and Molecular Biology, Kluwer Academic Publishers, Dordrecht, The Netherlands. 1995;671–97.
CrossRef - Del Pozo J. C., Lopez-Matas M. A., Ramirez-Parra, E. Hormonal control of the plant cell cycle. Plant Physiol. 2005;123:173–83.
CrossRef

This work is licensed under a Creative Commons Attribution 4.0 International License.


