

Manuscript accepted on : 05 June 2016
Published online on: --
Experimental Study of Parameters of Grain Milling Product Separation in Pneumatic Screw Classifier
Eugene Aleksandrovich Phenow, Artem Anatolyevich Mezenov and Yuri Yurievich Gigoolo
Federal State Budgetary Educational Institution of Higher Education Novosibirsk State Agrarian University Postal address: 630039, Novosibirsk region, Novosibirsk, Dobrolubova St., 160.
DOI : http://dx.doi.org/10.13005/bbra/2083

ABSTRACT: Present study was aimed to improve efficiency of sieve and screen separators by reducing specific load on a sieve (screen) through preliminary separation of the initial mixture of crushed material on air delivery stage in pneumatic screw classifier. Parameters of grain milling product separation in pneumatic screw classifier using planning of multifactorial experiment and processing of statistical data are presented. We have built pneumatic screw classifier prototype and performed its production check basing on these results.
KEYWORDS: grain processing; pneumo-centrifugal sorting; pneumatic screw classifier; grain milling products
Download this article as:| Copy the following to cite this article: Phenow E. A, Mezenov A. A, Gigoolo Y. Y. Experimental Study of Parameters of Grain Milling Product Separation in Pneumatic Screw Classifier. Biosci Biotech Res Asia 2016;13(2) |
| Copy the following to cite this URL: Phenow E. A, Mezenov A. A, Gigoolo Y. Y. Experimental Study of Parameters of Grain Milling Product Separation in Pneumatic Screw Classifier. Biosci Biotech Res Asia 2016;13(2).Available from: https://www.biotech-asia.org/?p=13877 |
Introduction
Sorting of a material mixture into several fractions differing in size, density, and aerodynamic properties is one of the most important operations in many industrial branches, where grinding of raw material with subsequent classification of obtained milling products or simply sorting of the original product into several fractions is required. One of the promising ways to intensify mentioned technological processes is to use pneumo-centrifugal devices.
Efficiency of a grain processing facility depends on reliability of technological lines and a number of losses of raw materials at all process flow stages, while product quality becomes top priority. Sorting processes on such facilities are based on screen and sieve separators [11].
Many studies of Russian and foreign scientists are devoted to improvement of their efficiency. Obtained results suggest that efficiency of sieving depends on following factors: specific load on the sieve; homogeneity of granulometric composition, shape and state of processed material surface, methods of cleaning and aligning abilities of sieves [8, 9, 10].
Fractional technology is one of the promising ways to intensify bulk material sorting: fractionation of source material according to aerodynamic properties [13, 14, 15].
In this regard, it is reasonable to divide initial mixture into several fractions similar by particle size and shape and send them to the appropriate systems to enhance sieving efficiency.
This problem may be technically solved by using pneumo-centrifugal separators for fractionation of milling products during their transportation. They are more energy-efficient compared to separators with linear air currents.
Studies aimed to improve efficiency of separation based on the patterns of particle movement in centrifugal force field allowed to elaborate pneumatic screw classifier for separation of grain milling products [7].
Methods
Experimental studies were conducted to confirm basic theoretical regulations, as well as to determine the rational parameters of grain grinding products separation in pneumatic screw classifier. Experimental program included:
study of aerodynamic and physical-mechanical properties of grain grinding products;
design and manufacture of experimental unit to study aerodynamic parameters of the airflow that affect grain milling products separation;
study of influence of the factors on separation process in pneumatic screw channel;
determination of airflow structure in separation zone;
choice of multifactorial experiment plan, establishment of levels and intervals of variation of the studied process parameters;
determination of rational technological and geometrical parameters of the grain grinding product separation;
production check of the experimental classifier unit.
Experimental unit was built for laboratory studies. The unit consisted of pneumatic screw classifier Figure 1, two cyclone-separators each with own ventilator, bunker with dozer, and material lines.
Research single-factor experiments were conducted to determine the significance and optimal interval of factors for subsequent studies. During these experiments we evaluated parameters influencing grain milling product separation in pneumatic screw classifier [2].
It was found that the best results are obtained in selected intervals of technological and design parameters, Table 1.
Table 1: levels of experimental factors
| Factors | Reference designations | Code | Levels of factors | Variation interval | ||
| -1 | 0 | 1 | ||||
| Pitch angle, ˚ | a | X1 | 8 | 12 | 16 | 4 |
| Air flow rate in axial tube, U1, m/s | U1 | X2 | 8 | 10 | 12 | 2 |
| Airflow rate in the medium fraction outlet, U2, m/s | U2 | X3 | 5 | 7 | 9 | 2 |
| Material load on the classifier, q, kg/s | q | X4 | 0.026 | 0.030 | 0.034 | 0.004 |
Total extraction factor η(%) was selected as optimization criterion; it is determined by formula (1):
![]()
Where η1, η2, η3 are extraction factors of large fraction from the first outlet, medium fraction from the second outlet, fine fraction from the third outlet, respectively.
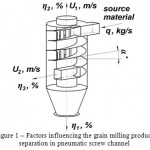 |
Figure 1: Factors influencing the grain milling product separation in pneumatic screw channel |
Extraction factor η1, η2, η3 (%) is characterized by the ratio of extracted particles Pi to their quantity in the initial mixture P0. It is calculated according to the formula:
![]()
Basing on a priori information, it is assumed that the response function is described by a second-order polynomial:
![]()
We selected composite symmetric three-level design B4 considering the number of significant factors and recommendations for choosing experiment designs [5]. This design was selected on the basis of recommendations for choosing designs with the best joint characteristics. Design matrix is shown in Table 2.
Pneumatic screw classifier was built and tested on flour-grinding mill MVS-01 with performance of 1000 kg/h.
The screening and factorial experiments justified values of geometrical and technological parameters of pneumo-centrifugal air separation system. Pneumatic screw classifier was designed and built according to the technical task.
Test program of experimental unit was based on IS 101.3-2001. Test program included: examination of unit construction, assessment of working conditions, determination of performance indexes for optimal performance.
Technical characteristics of the unit are based on the results of laboratory tests, designed and manufactured experimental sample of pneumatic screw classifier. Technical characteristics should contain indicators resulting from cyclone type[6].
Adjustment experiments were conducted in order to determine optimal adjustment operation mode. One should focus on extraction purity of required particle fraction while setting the air flow rate. Three experiments in each mode with each grinding system were conducted.
Material was fed into pneumatic screw classifier through designed receiver with adjustable flow splitter to regulate material load on the classifier.
The experiment began in steady-state mode. Material flow was blocked by the flap, and all outputs were directed to containers; after each repeated experiment material flow was stopped on signal by closing the flap, and time of sampling was placed. Extracts were weighted and sampled for analysis. All output samples had labels.
Unit performance was determined according to the air flow rate per hour.
Analysis of samples taken during unit test consisted of:
collection of sample weights for determination of quality of the source material and extracts from the unit;
determination of fractional composition of source material and extracts.
Obtained results were processed using mathematical statistics, dependency graphs were plotted, the the total extraction factor η(%) with assessment of unit competence in the process flow design.
In order to calculate economic efficiency, we drew milling balance before and after the introduction Table 4 and 5. This document fully reflects all features of technological process in this facility.
Milling balance is a tabular record of distribution of all products on technological systems, as well as extracts of products from all systems. Milling balance reflects not only technological process according to its design, but also process management, therefore it provides a complete analysis of the process flow in the facility.
Calculation of milling balance requires setting the load on I break system as 100%, i.e. grain mass changes in the preparatory division of a mill are not taken into account due to removing of impurities and moisturization of grain. Therefore, the amount of obtained flour and bran, as well as semolina (if present), should be 100%. Mass of all products is expressed in percentage to I break system.
These balances are recorded as tables: for each system separately or for total milling – as so-called cross tables.
Pneumatic screw classifier is a part of the experimental unit. The main body contains pneumatic crew channel with radial flow into axial pipe windows.
Pneumatic screw classifier has following technical characteristics:
Performance, kg/h … … … … … … … … … … … … … … … … … …. 100
Mass concentration, kg/kg … … … … … … … … … … … … … … … ≤ 0.64
Air input rate, m/s. … … … … … …. ≤ 12
Pneumatic screw channel diameter, m … … … … … … … … … … … … … … 0.3
Channel cross-section dimensions m × m … … … … … … … … … … … …. x 0.075 0.075
Pneumatic screw classifier was mounted directly behind the grinding mill of the first break system in production line. Air flow rate in outlet pipes was regulated by TRIAC transducers and grinded grain load – by a splitter set into the drift from grinding mill on the plansifter.
Results
Determination of aerodynamic properties of grain milling showed that particle suspension velocity ranges from 0.5 to 5.5 m/s, estimated equivalent diameter ranges from 122 to 1040 µm, respectively.
Research data on the influence of mean rate ratio in the axial and tangential pipes indicate that extraction factor maxima in pipe samplers are obtained under the ratio of the rate in pneumatic duct to the rate in axial pipe Vpd/Vax ≈ 0.8.
Study of influence of the conical part of the unit on grain milling product separation in pneumatic screw classifier allowed to determine rational angle of conical part disclosure as 60 degrees.
It was also found that grain milling products divided according to suspension velocities after I break system have different internal friction coefficients.
Experiments with design matrix were followed by data processing and building of mathematical model. Quadratic model coefficients were determined according to formulas[5].
Processing of experimental results were conducted using recommendations[1, 3, 4].
In accordance with the hypothesis adopted in this study, we attempted to create a comprehensive study of the pneumatic screw classifier that would ensure the grain milling product separation into three fractions with different suspension velocities. Table 2 presents the results of experimental research.
Table 2: Experimental research results
| Number of experiment | Х1 | X2 | X3 | X4 | Y1 | Y2 | Y3 | S2(Yu) | ||
| 1 | 2 | 3 | 4 | 5 | 6 | 7 | 8 | 9 | 10 | |
| 1 | -1 | -1 | -1 | -1 | 94.99 | 93.61 | 94.08 | 94.23 | 0.49 | |
| 2 | -1 | -1 | -1 | 1 | 88.21 | 89.53 | 88.68 | 88.81 | 0.45 | |
| 3 | -1 | -1 | 1 | -1 | 92.91 | 93.84 | 94.23 | 93.66 | 0.46 | |
| 4 | -1 | -1 | 1 | 1 | 89.83 | 92.32 | 91.24 | 91.13 | 1.56 | |
| 5 | -1 | 1 | -1 | -1 | 97.54 | 96.03 | 96.48 | 96.68 | 0.6 | |
| 6 | -1 | 1 | -1 | 1 | 88.83 | 90.25 | 86.37 | 88.48 | 3.85 | |
| 7 | -1 | 1 | 1 | -1 | 94.28 | 94.92 | 95.82 | 95.01 | 0.6 | |
| 8 | -1 | 1 | 1 | 1 | 89.47 | 90.15 | 90.61 | 90.08 | 0.33 | |
| 9 | 1 | -1 | -1 | -1 | 93.29 | 92.40 | 91.85 | 92.51 | 0.53 | |
| 10 | 1 | -1 | -1 | 1 | 91.37 | 92.52 | 91.97 | 91.95 | 0.33 | |
| 11 | 1 | -1 | 1 | -1 | 91.87 | 93.30 | 94.02 | 93.06 | 1.20 | |
| 12 | 1 | -1 | 1 | 1 | 93.56 | 91.81 | 92.55 | 92.64 | 0.77 | |
| 13 | 1 | 1 | -1 | -1 | 93.44 | 93.02 | 92.21 | 92.89 | 0.39 | |
| 14 | 1 | 1 | -1 | 1 | 88.48 | 88.12 | 87.52 | 88.04 | 0.24 | |
| 15 | 1 | 1 | 1 | -1 | 87.83 | 87.43 | 86.90 | 87.39 | 0.22 | |
| 16 | 1 | 1 | 1 | 1 | 89.30 | 88.80 | 90.07 | 89.39 | 0.41 | |
| 17 | 1 | 0 | 0 | 0 | 91.09 | 92.65 | 94.96 | 92.90 | 3.79 | |
| 18 | -1 | 0 | 0 | 0 | 91.09 | 92.65 | 94.96 | 92.90 | 0.43 | |
| 19 | 0 | 1 | 0 | 0 | 92.00 | 91.31 | 90.69 | 91.33 | 4.26 | |
| 20 | 0 | -1 | 0 | 0 | 92.86 | 91.01 | 95.13 | 93.00 | 3.24 | |
| 21 | 0 | 0 | 1 | 0 | 93.93 | 97.49 | 96.17 | 95.86 | 0.38 | |
| 22 | 0 | 0 | -1 | 0 | 89.72 | 88.50 | 88.98 | 89.07 | 0.59 | |
| 23 | 0 | 0 | 0 | 1 | 89.10 | 88.20 | 87.57 | 88.29 | 0.6 | |
| 24 | 0 | 0 | 0 | -1 | 88.30 | 87.56 | 86.75 | 87.54 | 0.86 | |
| ∑ S2(Yu) | 26.58 | |||||||||
Obtained regression equation h η(х1, х2, х3, х4) based on experimental results and their statistical processing using standard programs.. Mathematical model describing the efficiency of separation process:

Experimental results were processed by statistical methods.
Check of the model adequacy was carried out using Fisher criterion.
Regression equation in decoded form:

Equation (4) was cited to canonical form for the analysis and systematisation:
![]()
As can be seen from equation (6), regression coefficients of canonical equation have different signs, therefore, minimax-type response surface [1] with coordinates of the figure center x1 = 0.4017; x2 = 0.1262; x3 = 0.1124; x4 =-0.364 (factors are, respectively: pitch angle, ° = 13.6068°; air flow rate in axial pipe U1 = 10, 2524 m/s, air flow rate in pneumatic duct pipe U2 = 6.7752 m/s, material load on the classifier, q = 0.0285 kg/s).
Cross-section of X1 and X2 were obtained through substitution of x3=0 and x4=0 in equation (4):
![]()
We differentiated equation (7) for each variable, equated the derivatives to zero and got a system of linear equations consisting of two equations.
Solution of linear system of equations is new response surface center coordinates: x1 = 0.2547; x2 = 0.1368.
After substitution of found values x1 and x2 in equation (7) we obtained the value of the total extraction factor in the surface center YS = 91.69.
Canonical transformation of equation (7) was conducted; it is expressed by the following equation:
![]()
Response surface is a paraboloid (Figure 2). Both factors B11 and B22 have the same signs. Centers of ellipses represent minima, as factors are positive and ellipses are extended along the axis x1:
![]()
In this case factor value x1 of the adopted factor variation interval moves a 0.2547 variation step away from the plan center and makes 13° in-kind; factor value x2 moves a 0.1368 step or 10.3 m/s, while Ys = 91.69% and angle of coordinate axis rotation from the initial state is α = 11°.
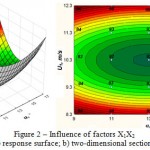 |
Figure 2: Influence of factors X1X2 a) response surface; b) two-dimensional section. |
Analysis of the response surface Figure 2 indicates that the rate changes in axial pipe to the right and to the left from the response surface center leads to a higher extraction factor (92.8–96.4%, which makes 3.7%) than change of pitch angle (95.29–96.40% – 1.1%). Therefore, the rate in axial pipe (X2) has a greater impact on the total extraction factor than the pitch angle (X1).
Study of influence of X1 and X3 on optimization criterion was conducted in a similar way. Regression equation (10) and response surface (Figure 3) were obtained, center of factor variation intervals was shifted, in coded form: x1 = 0.1988; x3 = 0.0191; YS = 91.75, axis rotation angle α = -2.41°, regression coefficients B11 = 1.20665; B33 = -2.24292:
![]()
In this case, coefficients B11 and B33 have different signs. Hyperbola are stretched along the B11 axis with a lower absolute value of coefficient in canonical equation. In this case, the response value increases from the center of figure along this axis and decreases along the B33 factor axis. Center of the response surface is called saddle or minimax, the response surface – hyperbolic paraboloid.
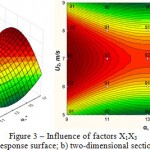 |
Figure 3: Influence of factors X1X3 a) response surface; b) two-dimensional section |
Analysis of the response surface Figure 3 indicates that the rate changes in axial pipe to the right and to the left from the response surface center leads to a lower extraction factor (90.7–93%, which makes 2.5%) than change of pitch angle (90.7–89.5% – 1.3%). Therefore, the rate in pneumatic screw channel pipe (X3) has a greater impact on the total extraction factor than the pitch angle (X1).
Study of influence of X1 and X4 on optimization criterion was conducted in a similar way. Regression equation (11) and response surface (Figure 4) were obtained, center of factor variation intervals was shifted, in coded form x1 = 0.3536, x4 = -0.3369 YS = 91.98, axis rotation angle α = 10.05°, regression coefficients B11 = 1.2968; B44 =-1.866;
![]()
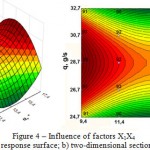 |
Figure 4: Influence of factors X1X4 a) response surface; b) two-dimensional section. |
Analysis of the response surface Figure 4 indicates that the material load changes to the right and to the left from the response surface center leads to a lower extraction factor (93.3–91.4%, which makes 2%) than change of a pitch angle (90.1–91.4% – 1.4%). Therefore, the material load on the classifier (Х4) has a greater impact on the total extraction factor than the pitch angle (X1).
Study of influence of X2 and X3 on optimization criterion was conducted in a similar way. Regression equation (12) and response surface (Figure 5) were obtained, center of factor variation intervals was shifted, in coded form: x2 = 0.1016, x3 = -0.0166 YS = 91.76, axis rotation angle α = -2.25°. Regression coefficients B22 = 3.5197; B33 = 2.2459-:
![]()
Analysis of the response surface Figure 5 indicates that the rate changes in axial pipe to the right and to the left from the response surface center leads to a higher extraction factor (89.5–93%, which makes 3.7%) than change of rate in pneumatic duct pipe (90.7–89.5% – 1.3%). Therefore, the rate in axial pipe (X2) has a greater impact on the total extraction factor than the rate in pneumatic duct pipe (X3).
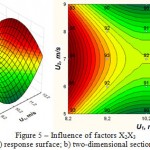 |
Figure 5: Influence of factors X2X3 a) response surface; b) two-dimensional section |
Study of influence of X2 and X4 on optimization criterion was conducted in a similar way. Regression equation (13) and response surface (Figure 6) were obtained, center of factor variation intervals was shifted, in coded form: x2 = 0.0739, x4 = -0.4546; YS = 92.13, axis rotation angle α = -2.41°. Regression coefficients B22 = 3.5202; B44 = -1.7791:
![]()
Analysis of the response surface Figure 6 indicates that the rate changes in axial pipe to the right and to the left from the response surface center leads to a higher extraction factor (90.4–93.9%, which makes 3.8%) than change of material load (93.9–95.7% – 1.9%). Therefore, the rate in axial pipe (X2) has a greater impact on the total extraction factor than material load on the classifier (X3).
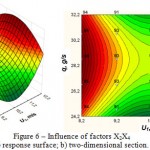 |
Figure 6: Influence of factors X2X4a) response surface; b) two-dimensional section |
Study of influence of X3 and X4 on optimization criterion was conducted in a similar way. Regression equation (14) and response surface (Figure 7) were obtained, center of factor variation intervals was shifted, in coded form: x3= -0.0926, x4 = -0.4669; YS = 92.17, axis rotation angle α = 30.27°. Regression coefficients B33 = -2.4781; B44 = -1.5285:
![]()
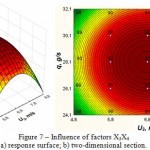 |
Figure 7: Influence of factors X3X4 a) response surface; b) two-dimensional section. |
Response surface Figure 7 is an elliptical paraboloid. Both factors B33 and B44 have the same signs. Centers of ellipses are maxima, because analysis of the response surface indicates that the rate changes in pneumatic duct pipe to the right and to the left from the response surface center leads to a lower extraction factor (90.7–88.2%, which makes 2.8%) than change of material load on the classifier (89.7–88.2% – 1.7%). Therefore, the rate in pneumatic duct pipe (Х3) has a greater impact on the total extraction factor than material load (Х4).
Factors are negative and ellipses are extended along the x3 axis.
Canonical transformation of the experimental model obtained by application of symmetric composite plan type B4 [5] showed that the centers of variation intervals of the studied factors has new coded values: x1 = 0.4017; x2 = 0.1262; x3 = -0.1124; x4 = -0.364, extraction factor η = 91.94%
In-kind values of optimization parameters are:
pitch angle, ° = 13.6°;
air flow rate in axial pipe, U1 = 10 m/s;
air flow rate in pneumatic duct pipe, U2 = 6.8 m/s;
material load on the classifier, q = 0.0285 kg/s.
Production tests were conducted on the grinded grain coming from the first grinding mill.
Extraction factor of each fraction type from the corresponding collector depending on the load is presented in
Table 3; Results of production check of pneumatic screw classifier
| Load on the classifier,
q, kg/h |
Extraction factor (η, %) by fractions | ||||
| Tailing fraction | Coarse grits | Medium grits | Fine grits | Dunst + flour | |
| 100 | 86.78 | 18.95 | 22.87 | 25.15 | 32.48 |
| 86.27 | 19.48 | 26.64 | 24.44 | 32.62 | |
| 85.29 | 18.08 | 24.08 | 23.05 | 30.79 | |
| Mean value | 86.11 | 18.83 | 24.53 | 24.21 | 31.96 |
| 85 | 84.07 | 18.78 | 22.25 | 22.23 | 33.84 |
| 86.24 | 19.55 | 20.78 | 20.16 | 32.05 | |
| 88.13 | 18.82 | 20.94 | 21.06 | 33.27 | |
| Mean value | 86.15 | 19.05 | 21.32 | 21.15 | 33.05 |
| 70 | 83.10 | 6.14 | 9.18 | 8.31 | 27.27 |
| 84.41 | 6.92 | 9.42 | 10.29 | 26.05 | |
| 89.69 | 8.07 | 10.29 | 10.03 | 17.51 | |
| Mean value | 85.73 | 7.04 | 9.63 | 9.54 | 23.61 |
Production check of the grain milling product separation into fraction in pneumatic screw channel with radial drainage showed that the load change doesn’t result in change of extraction rate of tailing fractions. Extraction factor for the remaining fractions (flour grits and dunsts) decreases along with the load Figure 8
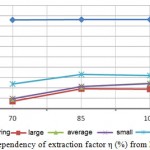 |
Figure 8: Dependency of extraction factor η (%) from load (q), kg/h |
Balance data are recorded as tables: separately for each system or for hole grinding – in so-called cross table. [12] Milling balance reproduces technological design in terms of distribution of all products and number of systems in the grinding scheme. Quantitative characteristic of products defines the modes of all systems, i.e. the balance contains complete information about grinding process. Therefore, the milling balance is a document that fully reflects all technological process features in this facility.
Table 4: Basic quantitative milling balance
| Systems | Products received | Products obtained | |||
| Name | Quantity,% to I br.s. | Name | Quantity,% to I br.s. | Product direction | |
| I br.s. | Grain | 100 | 1st tailing | 67 | II br.s. |
| 2nd tailing | 26 | SP | |||
| 1st pass | 7 | Top grade flour. | |||
| Total | 100 | 100 | |||
| II br.s. | 1st tailing of I br.s. | 67 | 1st tailing | 29 | III br.s. |
| 2nd tailing | 29 | SP | |||
| 1st pass | 9 | Top grade flour. | |||
| Total | 67 | 67 | |||
| SP | 2nd tailing of I br.s. | 26 | 1st tailing | 3.5 | III br.s. |
| 2nd tailing of II br.s. | 29 | 2nd tailing | 2.4 | III br.s. | |
| 3rd tailing | 30 | 1 r.s. | |||
| Pass | 16.9 | 1 r.s. | |||
| tailings | 2.2 | ||||
| Total | 55 | 55 | |||
| III br.s. | 1st tailing of II br.s. | 29 | 1st tailing | 8.9 | Bran |
| 1st tailing of SP | 3.5 | 2nd tailing | 6 | Bran | |
| 2nd tailing of SP | 2.4 | 1st pass | 7 | First grade flour | |
| 2nd pass | 13 | 2 r.s. | |||
| Total | 34.9 | 34.9 | |||
| 1 r.s. | 3rd tailing of SP | 30 | 1st tailing | 16 | 2 r.s. |
| Pass of SP | 16.9 | 2nd tailing | 6.9 | 2 r.s. | |
| 1st pass | 24 | Top grade flour. | |||
| Total | 46.9 | 46.9 | |||
| 2 r.s. | 2nd pass of III br.s. | 13 | 1st tailing | 8.9 | 3 r.s. |
| 1st tailing of 1 r.s. | 16 | 2nd tailing | 3 | 3 r.s. | |
| 2nd tailing of 1 r.s. | 6.9 | 3rd tailing | 4 | 3 r.s. | |
| 1st pass | 20 | First grade flour | |||
| Total | 35.9 | 35.9 | |||
| 3 r.s. | 1st tailing of 2 r.s. | 8.9 | 1st tailing | 6 | Bran |
| 2nd tailing of 2 r.s. | 3 | 2nd tailing | 2.9 | Bran | |
| 3rd tailing of 2 r.s. | 4 | 3rd tailing | 2 | Bran | |
| 5 | First grade flour | ||||
| Total | 15.9 | 15.9 | |||
Mass of all obtained products expressed as a percentage to I br.s.:
| top grade flour | 40%; |
| first grade flour | 32%; |
| bran | 25.8%. |
| feed | 2.2% |
| Total | 100% |
Table 5: Designed quantitative milling balance
| Systems | Products received | Products obtained | |||
| Name | Quantity, %
to I br.s. |
Name | Q-ty, % to I br.s. | Product direction | |
| I br.s. | Grain | 100 | large fraction | 74 | 1st break plansifter |
| medium fraction | 23 | 2nd break plansifter | |||
| fine fraction | 3 | 1 r.s. plansifier | |||
| Total | 100 | 100 | |||
| I br.s. | large fraction on the 1st break plansifter | 74 | 1st tailing | 48 | II br.s. |
| 2nd tailing | 18 | SP | |||
| 1st pass | 8 | top grade flour | |||
| Total | 74 | 74 | |||
| II br.s. | 1st tailing of I br.s. | 48 | 1st tailing | 18 | III br.s. |
| medium fraction on the 2nd break plansifter | 23 | 2nd tailing | 43 | SP | |
| 1st passage | 10 | Top grade flour. | |||
| Total | 71 | 71 | |||
| SP | 2nd tailing of I br.s. | 18 | 1st tailing | 3.8 | III br.s. |
| 2nd tailing of II br.s. | 43 | 2nd tailing | 2.9 | III br.s. | |
| 3rd tailing | 33.2 | 1 r.s. | |||
| Pass | 18.9 | 1 r.s. | |||
| Tailings | 2.2 | ||||
| Total | 61 | 61 | |||
| III br.s. | 1st tailing of II br.s. | 18 | 1st tailing | 3.7 | Bran |
| 1st tailing of SP | 3.8 | 2nd tailing | 2.5 | Bran | |
| 2nd tailing of SP | 2.9 | 1st pass | 6 | First grade flour | |
| 2nd pass | 12.5 | 2 r.s. | |||
| Total | 24.7 | 24.7 | |||
| 3rd tailing of SP | 33.2 | 1st tailing | 20 | 2 r.s. | |
| Pass of SP | 18.9 | 2nd tailing | 8.6 | 2 r.s. | |
| fine fraction on 1 r.s. plansifter | 3 | 1st passage | 26.5 | Top grade flour. | |
| Total | 55.1 | 55.1 | |||
| 2 r.s. | 2nd passage of the III br.s. | 12.5 | 1st tailing | 6.9 | 3 r.s. |
| 1st tailing of 1 r.s. | 20 | 2nd tailing | 3.5 | 3 r.s. | |
| 2nd tailing of 1 r.s. | 8.6 | 3rd tailing | 5.2 | 3 r.s. | |
| 1st pass | 25.5 | First grade flour | |||
| Total | 41.1 | 41.1 | |||
| 3 r.s. | 1st tailing of 2 r.s. | 6.9 | 1st tailing | 6.2 | Bran |
| 2nd tailing of 2 r.s. | 3.5 | 2nd tailing | 3.4 | Bran | |
| 3rd tailing of 2 r.s. | 5.2 | 3rd tailing | 2 | Bran | |
| 1st pass | 4 | First grade flour | |||
| Total | 15.6 | 15.6 | |||
Mass of all obtained products expressed as a percentage
to I br.s.:
| top grade flour | 44.5%; |
| first grade flour | 35.5%; |
| bran | 17.8%. |
| feed | 2.2% |
| Total | 100% |
Input air flow rate Uin = 12 m/s, pitch angle of pneumatic screw channel a° =13°; air flow rate in axial pipe U1=10.3 m/s; air flow rate in pneumatic duct pipe U2=6.8 m/s.
Conclusion
Following conclusions can be drawn basing on conducted experiments:
Air flow rate in axial pipe U1, m/s, has the biggest impact on extraction factor in the investigated range;
Air flow rate in pneumatic duct pipe U2, m/s, also significantly influences the extraction factor of fractions.
Material load on the classifier q, kg/s, has a lesser impact on the extraction factor of fractions.
Pitch angle a° has the least impact.
Production tests and operation of the classifier prototype designed and built according to materials of the present study have demonstrated that the device is functional, the total extraction factor of required fractions ≈ 92%.
Introduction of pneumatic screw classifier allowed to extract 30% of flour and dunsts at the stage of transportation of grinding products after the first break system from grinding mill to plansifter and led to an increase in total flour output by 8% through reduction of losses of flour and dunsts in tailings on break plansifter.
References
- Adler, Yu.P., E.V. Markova, Yu.V. and Granovsky, 1976. Planning of experiment for choosing of optimal conditions. Мoscow: Nauka, pp: 280.
- Mezenov, A.A., K. Turov and E.A. Pshenov, 2012. Evaluation of parameters influencing grain milling product separation in pneumatic screw classifier. Vestnik Orel GAU, 1(34): 139-143.
- Melnikov, S.V., V.R. Aleshkin and P.I. Roshchin, 1980. Design of experiments for research of agricultural processes. Leningrad: Kolos, pp: 168.
- Nalimov, V.V. and N.A. Chernova, 1965. Statistical techniques of extreme experiment design. Moscow: Nauka, pp: 65.
- Brodsky, V.Z., L.I. Brodsky, T.I. Golikova, et al., 1982. Tables of experiment designs for factor and polynomial models (reference book). Moscow: Metallurgiya, pp: 752.
- OST 10 1.3-2000. Machine technology in crop production. Testing programs and techniques, 2000. Introduced 01.03.2001. RF Ministry of Agriculture, pp: 21.
- Turov, A.K., A.A. Mezenov and E.A. Pshenov. Pat. 2430795 Russian Federation, IPC В 07 В7/08. Pneumatic screw classifier. Applicant and patentee FSBEI HE Novosibirsk State Agrarian University. No. 2010109692/03; Appl. 15.03.10; publ. 10.10.11, Newsletter. No. 28. 6 p.
- Barsky, M.D., 1980. Fractionation of powders. Moscow: Nedra.
- Gortinskij, V.V., A.B. Demsky, M.A. Boriskin, 1980. Separation processes on grain mills. Moscow: Kolos.
- Bernotat, S., et al., 1978. Some aspects about the separation in a cross flow air-classifier. Chemical Engineering Science, 33: 751-757.
- Glebov, A.A. and A.B. Demsky, 2006. Technological equipment of industrial plants (milling plants): textbook. Мoscow: Delhi print.
- Mogucheva, E.P. and L.V. Ustinova, 2001. Designing of mills: Tutorial. Alt. State University named after I.I. Polzunov. Barnaul: Pub.AltSTU.
- Pshenov, E.A., 2010. Separation of powder materials in pneumatic screw stream. Science. Technology. Innovation: materials of all Russian sc. conf. of young scientists. (Novosibirsk, 3-5 December 2010): NSTU publishing. P. 1, pp: 303-304.
- Gloeckner, H., T. Hagemeier, C. Roloff, D. Thévenin and J. Tomas, 2014. Experimental Investigation on the Multistage Particle Classification in a Zigzag Air Classifier. Proceedings of the World Congress on Engineering 2014 Vol II, WCE 2014, July 2-4, London, U.K.
- Klumpar I., F. Currler and T. Ring, 1996. Air classifiers. Chemical engineering, pp: 77-92.

This work is licensed under a Creative Commons Attribution 4.0 International License.


