

Manuscript accepted on : 15 March 2016
Published online on: 07-04-2016
O. A. Konovalova, N. V. Kalacheva, G. V. Cherepnev, M. V. Trushin
Kazan Federal University, Kremlevskaya str., 18, 420008, Kazan, Russia
DOI : http://dx.doi.org/10.13005/bbra/2062

ABSTRACT: A comparative study of the physical adsorption of RNAse A and RNAse Bacillus pumilis onto a negatively charged surface of mica, a hydrophobic surface of pyrolytic graphite and a surface of lipid layers of dipalmitoylphosphatidylcholine (DPPC) was performed by atomic force microscopy. It was found that microbial RNAse, unlike RNAse A, 1) is adsorbed onto the negatively charged surface of mica in the form of monomers and dimers; 2) exhibits enhanced tropism to the hydrophobic surface of pyrolytic graphite; 3) modifies morphotopography and thickness of the lipid bilayer of DPPC. The detected surface-dependent differences in adsorption of RNAses are consistent with the features of their structure and cytotoxic properties.
KEYWORDS: microscopy; morphotopography ; adsorption of pancreatic
Download this article as:| Copy the following to cite this article: Konovalova O. A, Kalacheva N. V, Cherepnev G. V, Trushin M. V. Surface-dependent differences in the adsorption of pancreatic and microbial ribonucleases visualized by atomic force microscopy. Biosci Biotech Res Asia 2016;13(1) |
| Copy the following to cite this URL: Konovalova O. A, Kalacheva N. V, Cherepnev G. V, Trushin M. V. Surface-dependent differences in the adsorption of pancreatic and microbial ribonucleases visualized by atomic force microscopy. Biosci Biotech Res Asia 2016;13(1). Available from: https://www.biotech-asia.org/?p=7625 |
Introduction
Atomic force microscopy (AFM) is one of the modern methods of investigation used to study the surface structure at the nanometer scale. Using AFM, it is possible to successfully analyze the dynamics of adsorption and conformation of various substances, including protein molecules on atomically smooth surfaces [1-6]. The study of the physical adsorption of proteins on different surfaces helps to reveal the peculiarities of their functioning in contact with the cell membrane and other biological substrates and contributes to the understanding of the role of interphase phenomena in biological processes [2,4,5]. Along with the study of adsorption, methods of atomic force microscopy are widely used to study the local structure of the cell membrane and artificial bilayer structures, as they allow one to obtain a valuable information about conformational changes in lipid membranes when interacting with different biomolecules to detect subtle structural features of the lipid layers and to estimate their morphometric parameters [6-9].
The object of this work is cationic RNAses, which attract the attention of researchers as potential anticancer drugs of new generation [10-12]. Active study of the effect of electrostatic properties of RNAses on their cytotoxicity has made a significant contribution to the understanding of the mechanism of interaction of molecules of RNAses to the surface of tumor cells. In particular, the selectivity of the action of RNAses could be explained from the position of the electrostatic interaction of cationic RNAses to the negatively charged surface of tumor cells, which contain increased amounts of anionic phospholipids in the outer monolayer of the membrane [13]. However, the selectivity of the action of RNAses on cells cannot be mediated only by their electrostatic properties [14]. In the work [15], it was shown that the internalization of certain cytotoxic RNAses occurs via clathrin- and dynamin-independent endocytosis, after which they were translocated through the membrane of endosomes and enter to the cytosol, where the realization of their cytotoxicity is occurred. In the process of translocation through the membrane, the protein is forced to interact with a hydrophobic region of a lipid bilayer. In this case, any exogenous protein molecule interacts with the thermodynamic barrier that can be over comed by protein only in case of availability of regions with pronounced hydrophobic properties. In this regard, the consideration of the hydrophobic properties of the RNAses is a necessary step in deciphering the mechanism of their biological activity.
Currently, a number RNAses was obtained and studied from different sources;all of them have unique structures and its physico-chemical and biological properties [16, 17]. Entering to the body, they could potentially act on different cells and subcellular targets. Therefore, study of the adsorption of RNAses in physical models, simulating their interaction with the cytoplasmic membrane and intracellular structures, seems very promising.
In this work, AFM methods were used for a comparative study of physical adsorption of pancreatic and microbial RNAses at the negatively charged mica surface and the hydrophobic surface of the pyrolytic graphite, and the features of the surface structure of the lipid layers after their interaction with RNAses were investigated.
Material and methods
Objects. Binaseis secreted by gram-positive spore-forming soil bacterium Bacillus pumilis. The old name of this species is Bacillus intermedius [18]. Amino acid sequence of binase includes 109 amino acid residues, molecular weight is 12300 Da [19]. Binase spatial structure was identified using the nuclear magnetic resonance spectroscopy (PDB ID: 1BUJ) [20]. In our experiments, we used electrophoretic homogeneous preparation of monomer binase obtained using the methodology described in [21].
BP-RNAse, or pancreatic RNAse A (RNAse A), firstly was isolated from the pancreas of the ox ofBos taurus [22]. Amino acid sequence of BP-RNAse consists of 124 amino acid residues, molecular weight – 13680 Da. The spatial structure of BP-RNAse is determined by using nuclear magnetic resonance spectroscopy (PDB ID: 7RSA) [23]. In our experiments, we used the drug crystal monomer of the native BP-RNAse (Serva, Germany).
AFM and sample preparation
To study the adsorption of RNAses, we used two different atomic-smooth surfaces: negatively charged hydrophilic mica and hydrophobic highly orientated pyrolytical graphite (pyrographite).Lipid layers were prepared from dipalmitoylphosphatidylcholine (DPPC) (Serva, Germany).
Enzyme preparations were dissolved in sodium phosphate buffer (pH 7.2) to the appropriate concentrations. The area of the used freshly cleaved surfaces of mica and pyrolytic graphite were 1.0 and 0.5 cm2, respectively. The solutions of RNAse in a volume of 20 µl were placed on the surface of the chip used. The duration of interaction between enzyme and mica was 30 s, 2 and 5 min, after that the pyrolytic graphite and the mica was washed with deionized water and quickly dried in a weak stream of air at room temperature.
Visualization of the process of adsorption of RNAse A and binase on mica and pyrolytic graphite was carried out on atomic force microscope Solver P47H, the scanner 50×50 μm and Solver Pro, scanner 3×3 μm (CJSC “NT-MDT”, Russia). The surface scanning was performed in air at room temperature in tapping mode with standard silicon cantilevers NSG11 and NSG10S (radius of curvature – 10 nm), using three methods of scanning: constant amplitude, the phase contrast and the signal of error. The size of scans: 1×1 µm, 2×2 µm, 5×5 µm, 10×10 μm. Resolution: 512×512 points.
Artificial lipid membranes were prepared by fusing small monolamellar vesicles with mica [7]. In the first step, we received multilamellar vesicles. For this purpose, 2 mg of DPPC was dissolved in 1 ml of methanol. After reaching homogeneity, the mixture was blowed with nitrogen stream to evaporate the solvent, and with the aim of complete removal of methanol it was left under vacuum ~4·10-1 mm Hg for 12 hours. Then, the dried sample was hydrated with distilled water (with the addition of HEPES) to a concentration of 1 mM. To obtain a homogeneous aqueous dispersion, the sample was heated to 60°C with agitation. The second stage involved the obtaining of monolamellar vesicles. Small monolamellar vesicles were obtained by ultrasonic disintegration of suspension of multilamellar vesicles. The sonication lasted until the suspension became completely transparent. Next, 100 μl of DРРСsolution (1 mM) was placed on an inclined surface of a freshly cleaved mica. The sample was incubated at a temperature of 50°C (above the temperature of DPPC phase transition) for 10 min. On the obtained lipid bilayer, RNAse was placed – 20 µl (50 µg/ml) and incubated for 10 min at 37°C. Then, the sample was washed with bidistilled water, dried at room temperature for 30 min, and visualized by AFM.
Visualization of the surface of the lipid layers was performed in air at room temperature in tapping and contact modes using AFM Solver P47H, scanner 50×50 µm, Solver Pro, scanner 3×3 μm. For tapping mode, we used standard silicon cantilevers NSG11, the radius of curvature of the tip was less than 10 nm. For contact mode,we used cantilevers CSG11 with a stiffness of 0.03 N/m. Scannings in both cases were performed with a resolution of 512×512 points.
To describe the microgeometry of the surface lipid layers, we calculated phenomenological characteristics: the arithmetic mean of surface roughness, -the RMS amplitude of the surface roughness, and – the scale heights, the entropy according to prescribed formulas [24]. For calculation, we used the AFM images obtained in the topography mode.
All experiments were repeated 3-5 times. For statistical analysis we used Microsoft Excel, Origin 6, MATLAB R2009b software.
The kinetics of RNAse adsorption on two different surfaces was investigated on the degree of filling protein to the surface of the sorbent Q for the period time of sorption Dt.
The degree of filling surface by the protein was determined using the formula:
Q=Γ/Γ0, (1)
where G is the amount of substance sorbed over a period of time Dt, Г0isthe area of surface contact of the solution and the sorbent (pyrolytic graphite or mica).
Assessment of the degree of surface Q filling by the protein was carried out by programs written in MATLAB R2009b. One of them counted the degree of protein coverage of the surface using AFM-images obtained in the topography mode, the other using the AFM-images obtained in the mode of phase contrast. The number of samples of AFM images ranged from 7 to 15 for each tested interaction time.
Results
Visualization of the adsorption of RNAses on mica and pyrographite.
In the preliminary experiments, we carried out a selection of optimal conditions for the adsorption of RNAses, which was based on a clear visualization of molecules and aggregates of adsorbed proteins on the surface of the substrate. We selected the following optimal concentrations of enzyme: no more than 50 μg/ml for mica [5], and no more than 10 μg/ml for pyrolytic graphite. The interaction of RNAses with mica and pyrolytic graphite did not exceed 5 min. Increasing the concentration and time of interaction led to the increased amount of adsorbed protein on the substrate and hampered interpretation of the results.
Used RNAses had almost the same molecular weight, which allowed not taking into account the force of their gravitational attraction due to adsorption to the substrate.
Visualization of the adsorption of RNAses at different contact time with the surface of mica and pyrolytic graphite are presented in Fig. 1 and Fig. 2.
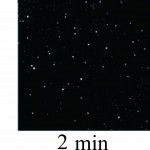 image description |
Figure 1: AFM images of adsorbed molecules of RNAse A (a) and RNAse Bi |
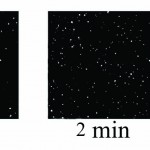 image description |
Figure 1:(b) obtained in the topography mode, depending on the time of contact with mica surface in 30 seconds, 2 minutes, 5 minutes at pH 7.2. The enzyme concentration was 50 μg/ml. Scan size 5×5 μm. |
Topographic images of the surface samples showed different degree of aggregation of the studied enzymes during their adsorption on the negatively charged mica surface at physiological pH. For RNAse A, formation of aggregates was low and little dependent on the time of interaction with the substrate (Fig. 1A). For binase,after 2 minutes, there was the appearance of dimeric forms, which were absent in RNAse A (Fig. 3). With increasing time of contact of binase with mica, dimeric molecules were replaced by aggregates of enzyme molecules; at that, there were kept also monomeric forms of RNAse (Fig. 1B).
Adsorption of enzymes on uncharged hydrophobic surface of pyrolytic graphite qualitatively differed from their adsorption on mica. RNAse molecules adsorbed on the mica were just structures that could be differentiated by size and shape; while in case of their adsorption on pyrolytic graphite the picture was much more complicated (Fig. 2). While the adsorption of RNAse A (10 μg/ml) on pyrolytic graphite, after 30 s there was aggregation of proteins in the form of elongated formations, which over time took on the form of flaky heterogeneous structures (Fig. 2A). Binasein the same conditions and with the same concentration was visualized as a dense layer of oval and slightly elongated structures, which over time became more elongated and were arranged one after another in the network with characteristic holes of different size (2 min) (Fig. 2B).
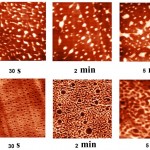 |
Figure 2: AFM images of adsorbed molecules of RNAse A (a) and RNAse Bi |
Three-dimensional AFM images adsorbed on pyrolytic graphite molecules of RNAse A (a) and binase (b) also differ sharply. RNAse A is adsorbed in the form of separate units, the height of which is 8 nm (Fig. 4A), while binase tends to form a nonuniform mesh structures with peaks and ridges with a height of 4 nm and 3 nm, respectively (Fig. 4B).
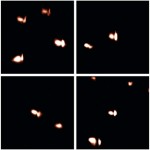 |
Figure 3: The presence of dimeric forms binase in different parts of the scanning sample of the mica. scan size: 0.5 × 0.5 µm. The interaction of the protein with mica: was 2 min |
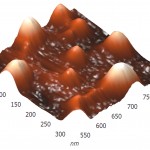 |
Figure 4(a): Three-dimensional AFM images adsorbed on pyrographite molecules of RNAse A (a) and RNAse Bi |
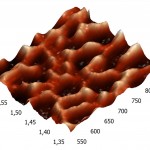 |
Figure 4(b): Three-dimensional AFM images adsorbed on pyrographite molecules of RNAse A. (b). The contact time of the enzyme with 2 minutes of the pyrographite, the concentration was 5 µg/ml, pH 7.2. The scan size 0.3 × 0.3 μm. |
The kinetics of RNAse adsorption on mica and pyrographite.
Time dynamics of the occupancy rate of the studied RNAseson Q mica surface is presented in Fig. 5. It follows from Fig 5 that the degree of surface filling by protein in RNAse A is less than in binase. At that, in both RNAses we observed increase of filling protein of surface with increasing duration of contact. At the same time, the difference in the degree of adsorption of RNAse A and binase for Dt = 30°C and Dt=2 min is small.
Filling by RNAses of a surface of pyrolytic graphite is significantly different and significantly higher compared to the mica (Fig. 6). The degree of filling of the surface of pyrolytic graphite by binase changes slightly over time, and is in the range of 50-70%. At the same time, RNAse Ain the first 30 s constitutes approximately 20% and it increases in proportion to the duration of contact with the surface.
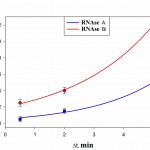 |
Figure 5: The degree of filling protein to the surface of the mica Q during the time interval Dt at a concentration of 50 μg/ml, pH 7.2. |
The interaction of RNAses with artificial lipid membranes.
The ability of lipids to form a stable film on the hydrophilic surface enables visualization and analysis of the surface of artificial membranes using atomic force microscopy. Figs. 7 and 8A present the AFM images of lipid layers DPPC in tapping mode.
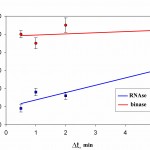 |
Figure 6: The degree of filling protein to the surface of pyrographite Q during the time interval Dt at a concentration of 10 μg/ml, pH 7.2 |
In this image you can see various options for the merger of lipid membranes with mica. The darkest part of the image corresponds to the plane of the mica, where the bilayer is not formed. This usually occurs due to a short incubation time, or due to an insufficient concentration of lipid. The lightest areas of the image (the so-called “islands”) are consistent with lipid layers. The height of the single bilayer is 4.9±0.6 nm. White “islands” in the image correspond to areas where there was the formation of the lipid membrane already formed on the bilayer. The thickness of such double-layer membranes is slightly more than the sum of the two single ones (10.2±0.7 nm). The membrane thickness measured in the contact mode was 4.0±0.1 nm (Fig. 7a). This decrease in the thickness of the membrane is most likely connected with a closer contact of the probe with the sample than in tapping mode.
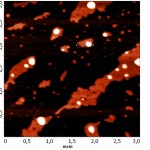 |
Figure 7(a) : The AFM images of the lipid layer DPPC in tapping mode
|
After incubation of lipid membranes with binase, we recorded the reduction of the thickness of the bilayer up to 2.1 ±0.1 nm, and changes in the structure of the surface layers were detected.
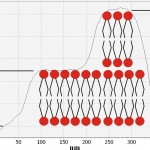 |
Figure 7 (b): The sectional profile of the selected fragment on the AFM image |
To increase the resolution of AFM images of lipid layers, we used additionally AFM Solver Pro, scanner 3×3 μm. The resulting images more clearly demonstrated the visual changes in the surface structure of the lipid layers after interaction with binase (Fig. 9), and the calculated phenomenological parameters confirmed this fact. All the characteristics (roughness, elevation of heights, entropy) was significantly increased compared with the control ones (Fig. 10).After interaction with RNAse Athese characteristics did not change significantly in comparison with control.
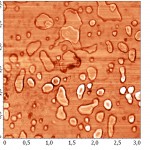 |
Figure 8(a): The AFM image of the lipid layer DPPC mode topography before interaction with binase (50 µg/ml). |
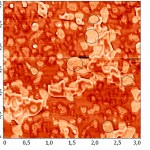 image description |
Figure 8(b): The AFM image of the lipid layer DPPC mode topography after interaction with binase (50 µg/ml). |
Discussion
Adsorption of exogenous water-soluble proteins is the first stage of their interaction with the cell. The process of adsorption is determined mainly by ionic, hydrogen Van-der-Waals, and hydrophobic types of interactions that occur between the surface and adsorbing protein molecules realizing in accordance with the laws of thermodynamics if free Gibbs energy of the system decreases [25].
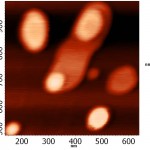 |
Figure 9(a): Enlarged AFM images of lipid layers DPTC in mode of topography (a) before interaction with binase (50 µg/ml). |
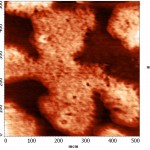 |
Figure 9(b): Enlarged AFM images of lipid layers DPTC in mode of topography (b) after interaction with binase (50 µg/ml). |
Adsorption of cationic RNAses to the negatively charged mica surface in the general form simulates their interaction with the negatively charged cytoplasmic membrane. As a substrate we used one of the varieties of mica – muscovite. This is a group of minerals with a characteristic chemical composition: 4[KAl2(AlSi3O10)(OH)2]. The presence in the structure of muscovite layers of potassium ions determines the separation of sheets of mica, consisting of double layers of SiO4tetrahedra. Interlayer potassium ions extremely easily replaced with water molecules [26, 27], making space for adsorption of protein. The oxygen atoms of the SiO4 tetrahedra at interaction with water solutions of various substances, including proteins acquire a negative charge. These properties allow the use of muscovite in the study of adsorption of RNAse as a structural analogue of the surface of tumor cells that have a higher negative charge compared with the surface of normal cells [28]. This model is especially relevant for the cationic RNAses, having the ability to selectively act on cells, including tumor ones [13].
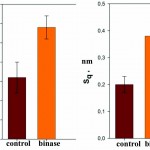 |
Figure 10: Phenomenological parameters (-elevation, an arithmetic average roughness, -is the RMS roughness, entropy) of the surface lipid layer before and after interaction with binase (50 µg/ml). |
Studied in the work cationic RNAses exhibit different toxicity against tumor cells. Pancreatic RNAse (RNAse A) in native state is not cytotoxic [29], while binase, in some cases, selectively inhibits the growth of certain malignant cell lines [11]. Previously, we investigated the peculiarities of the electrostatic interaction of these RNAses with mica by AFM. We have shown that binase much more effectively than pancreatic RNAse adsorbs on negatively charged substrate. The process of adsorption of RNAses depends on the distribution of charge on the surface of protein globule and is accompanied by aggregation of protein molecules [5]. The results presented in this work confirm our previous observations. However, it is necessary to emphasize the following important aspect. Under certain conditions,binase forms dimers on the atomically flat surface of mica (but not pyrographite). The same orientation of the subunits in the dimeric structure of the binase form (Fig. 3) in relation to each other suggests that dimerization may be due to complex intermolecular electrostatic and hydrophobic interactions between molecules. The obtained experimental results are in good agreement with the theoretical ones. In previously published work [30], we found in silicothat in the molecule of binase there is a hydrophobic (НФ) segment, in which structure we identified amino acid residues required for the dimerization. Thermodynamic parameters of the НФ segment show that it is capable of thermodynamically favorable interaction with the lipid bilayer and sterically available for the dimerization of monomers binase. Dimerization of the monomers, as is known, is one of the criteria of cytotoxicity of a number of RNAses toward tumor cells [31].
The adsorption of RNAses on the uncharged surface of pyrolytic graphite are carried out mainly by Van-der-Waals forces of attraction of non-polar radicals of proteins to hydrophobic areas of the substrate that usually is accompanied by partial denaturation (change in conformation) of the protein. Dehydration of hydrophobic areas of the substrate lowers the free energy of Gibbs of the system, and therefore makes the protein adsorption is more preferable. The change of the Gibbs free energy explains why proteins adsorb to most surfaces having hydrophobic areas, even in the presence of electrostatic repulsion between the surface and the protein [25]. In this regard, we can conclude that a greater or lesser affinity of the protein to the surface will depend on the relative numbers of hydrophobic clusters in the protein molecule.
Our results confirm that RNAses are adsorbing on the surface of pyrolytic graphite more preferably than on mica. The presence of NF segment in binase potentially should improve binase affinity to the hydrophobic surface of pyrolytic graphite. Indeed, if we compare the AFM images of RNAse adsorbed on pyrolytic graphite, it becomes obvious that binase more effectively fills the surface of the substrate in comparison with pancreatic RNAse. This conclusion is also supported by quantitative calculations of the surface area occupied by adsorbed drugs.
The nature of the adsorption of pancreatic and microbial RNAses is also different. This is likely due to differences in the structure of RNAses under study. The lack of cysteine in the structure benase, and, as a consequence, the impossibility of formation of stabilizing covalent disulfide bonds, makes the protein molecule more labile, and it is “spread” on the hydrophobic surface of pyrolytic graphite.
Molecules RNAse A, unlike binase, are aggregated on the hydrophobic surface of the pyrolytic graphite in the form of elongated structures in direction to up. This is most likely due to the higher polarity of RNAse A compared to binase. The dipole moments of RNAse A and binaseare 545 D and 225 D, respectively [5]. The presence of high dipole moment, characterizing the skewness of a distribution of negative and positive charges in a protein molecule, determines the most probable spatial orientation of the dissolved protein molecules that are close to uncharged substrate surface. When random collisions are occurred, molecules of RNAse Aare oriented in such a way that due to electrostatic interaction their form aggregates of up-elongated shape (Fig. 2), which is converted to a flaked structure. Besides, the RNAse molecule A is stabilized by four covalent disulfide bonds that inhibit its “spreading” over the surface of pyrographite.
Investigation of the surface structure of the lipid layers after their interaction with RNAseA and binase showed that they also differ, in particular, by morphological characteristics. Especially noticeable changes were detected in layers after their contact with binase. However, the main difference is that after treatment with binase, the height of a lipid bilayer was decreased compared with control, whereas RNAse A had no effect on this parameter. It may be explained in the following way. As it was mentioned above, in the molecule binase (but not inRNAse A) we identified the hydrophobic segment that is able to thermodynamic interactions with the lipid bilayer. This interaction can result in binase embedding to the lipid bilayer; as is well known, the embedding of the protein into the membrane violates the strict organization of the lipid bilayer and is accompanied by a change of its thickness [32].
Conclusion
The detected AFM-differences in the adsorption of RNAse from Bacillus pumilis (binase) and pancreatic RNAse on charged and hydrophobic surfaces are consistent with the peculiarities of the structure and cytotoxic properties of these enzymes. More high affinity of binase to negatively charged substrate, in comparison with RNAse A, correlates with its selective effect on some tumour cell lines. On the other hand, the results demonstrating binase adsorption on the hydrophobic surface of the pyrographite, and the change in the structure of a lipid bilayer under its influence help us to better understand the peculiarities of interaction between binase and cytoplasmic membrane.
References
- Allen M.J., Bradbury E.M. and Balhorn R.// AFM analysis of DNA-protamine complexes bound to mica. Nucleic Acids Research. V.25. P.2221-2226
- Qian Tang, Chun-Hua Xu, San-Qiang Shi, Li-Min Zhou // Formation and characterization of protein patterns on the surfaces with different properties. Synthetic Metals. 2004.V.147. P. 247-252
- Konovalova O.A., Nevzorova T.A., Vinter V.G. and Salakhov M.Kh. // Optimization of DNA visualization using atomic force microscope Solver P47H. Instruments and Experimental Techniques. 2005. V.6. P. 110-114.
- Lyubchenko Y.L. Shlyakhtenko L.S. // AFM for analysis of structure and dynamics of DNA and protein-DNA complexes. Methods. 2009. V.47.№3. P. 206-213.
- Konovalova O.A.,Kalacheva N.V., Shirshikov F.V., Salakhov M.Kh. // Study of characteristics of electrostatic interaction between RNAses and mica surface using atomic force microscopy. Nanotechnologies in Russia. 2011. V. 6.№ 7. P. 510-515.
- Doktycza M.J.,Sullivanc C.J., Hoytc P.R., Pelletiera D.A., Wud S., Allisonc D.P. // AFM imaging of bacteria in liquid media immobilized on gelatin coated mica surfaces. Ultramicroscopy. 2003. V. 97. P. 209-216.
- Czajkowsky D.M. Shao Z. // Supported Lipid Bilayers as Effective Substrates for Atomic Force Microscopy. Methods in cell biology. 2002. V. 68.P. 231-241.
- Goksu E.,Vanegas J. // AFM for structure and dynamics of biomembranes. Biochimica et Biophysica Acta. 2009. V. 1788. P. 254-266.
- Seantier B.,Giocondi M.C., Grimellec C. // Probing supported model and native membranes using AFM.Current Opinion in Colloid & Interface Science. 2008. V. 13. P. 326-337.
- Lee J.E., Raines R.T. //Ribonucleases as novel chemotherapeutics: the ranpiRNAse example. BioDrugs. 2008. V 22. №1. P.53–58.
- Makarov A.A., Kolchinski A., IlinskayaO.N. // Binase and other microbial RNAses as potential anticancer agents. Bioessays. 2008. V. 30. P. 781-790.
- Edelweiss E., Balandin T.G., Ivanova J.L., Lutsenko G.V., Leonova O.G., Popenko V.I., Sapozhnikov A.M., Deyev S.M. // BaRNAse as a new therapeutic agent triggering apoptosis inhuman cancer cells. PLoS ONE. 2008. V. 3. №6. e2434.
- Ardelt W., Ardelt B., Darzynkiewicz Z. // Ribonucleases as potential modalities in anticancer therapy. Eur. J. Pharmacol. 2009. V.625. P. 181-189.
- Notomista E., Mancheno J.M., Crescenzi O., Di Donato A., Gavilanes J., D’Alessio G. // The role of electrostatic interactions in the antitumor activity of dimeric RNAses. FEBS J. 2006. V. 273. P. 3687-3697.
- Haigis M.C., Raines R.T. // Secretory ribonucleases are internalized by a dynaminindependent endocytic pathway. J. Cell Sci. 2003. V. 116. P. 313-324.
- Fang E.F., Ng T.B.//Ribonucleases of different origins with a wide spectrum of medicinal applications. Biophys. Acta. 2011. V. 1815, P. 65-74.
- Luhtala N.,Parker R. // T2 Family Ribonucleases: Ancient enzymes with diverse roles. Trends Biochem Sci. 2010. V. 35. № 5. P.253-259.
- Sharipova M.R., Toymentseva A.A., Sabirova A.R., Mukhametzyanova A.D., Akhmetova A.I., Mardanova A.M., Balaban N.P. // A new phylogenetic position of strain Bacillus intermedius 3-19.Microbiology. 2011. V. 80. P. 432-435.
- Aphanasenko G.A., Dudkin S.M., Kaminir L.B., Leshchinskaya I.B., Severin E.S. // Primary structure of ribonuclease from Bacillus intermedius FEBS Lett. 1979. V. 97. P. 77-80.
- Reibarkh M.Ya., Nolde D.E., Vasilieva L.I., Bocharov E.V., Shulga A.A., Kirpichnikov M.P., Arseniev A.S. // Three-dimensional structure of binase in solution. FEBS Lett. 1998. V. 431. P. 250-254.
- Golubenko I. A., Balaban N. P., Leshchinskaya I. B., Volkova T. I., Kleiner G. I., Chepurnova N. To., Afanasenko G. A., Dudkin S. M. // Ribonuclease of Bacillus intermedius 7P. Purification by chromatography on phosphocellulose and some characteristics of homogeneous enzyme. Biochemistry. 1979. T. 44. P. 640-648.
- Richards F.M., Wyckoff H.W. // Bovine pancreatic ribonuclease. The enzymes / P. D. Boyer ed.; New York : Academic Press, 1971. V. 4. P. 647-806.
- Wlodawer A., Svensson L.A., Sjölin L., Gilliland G.L. // Structure of phosphate-free ribonuclease A refined at 1.26 Å. Biochemistry.1988. V. 27. P.2705-2717.
- Arutyunov A., Tolstikhina A. L., Demidov V. N. // System parameters for the analysis of roughness and microrelief of the surface of materials in scanning probe microscopy. Factory laboratory. Diagnostics of materials. 1999. V. 65. No. 9. S. 31-41
- Norde W., Lyklema J. // Why proteins prefer interfaces. J. Biomater. Sci. Polymer Edn., 1991, V. 2.P.183-202
- Kiselyova O.I., Yaminsky I.V.// Atomic force microscopy of protein complexes. In “Atomic Force Microscopy: Biomedical Methods and Applications” (Methods in Molecular Biology, V. 242), Ed. by P.C. Braga, D. Ricci. Humana Press. 2003.P. 217–230.
- Sakuma H., Kawamura K. // Structure and dynamics of water on muscovite mica surfaces. Geochim. Cosmochim. Acta. 2009. V. 73. P. 4100-4110.
- Annexin V.,Sugimura M., Donato R., Kakkar V.V., Scully M.F. // As a probe of the contribution of anionic phospholipids to the procoagulant activity of tumour cell surfaces Blood Coagul. Fibrinolysis. 1994. V. 5. P. 365-373
- Piccoli R., Gaetano S.D., De Lorenzo C., Grauso M., Monaco C., Spalletti-Cernia D., Laccetti P., Cinatl J., Matousek J., D’Alessio G. // A dimeric mutant of human pancreatic ribonuclease with selective cytotoxicity toward malignant cells. Proc. Natl. Acad. Sci. USA. 1999. V. 96. P.7768-7773.
- Shirshikov F.V., Cherepnev G.V., Ilinskaya O.N., Kalacheva N.V. // A hydrophobic segment of some cytotoxic ribonucleases. Medical Hypotheses. 2013.V.81.P.328-334.
- Di Donato A., Cafaro V.and D’Alessio G.//Ribonuclease A can be transformed into a dimeric ribonuclease with antitumor activity. Biol. Chem. 1994. V.269.P.17394-17396.
- Gennis R. Biomembranes: Molecular structure and functions. Publishing house “Mir”, M., 1997. 624 p.

This work is licensed under a Creative Commons Attribution 4.0 International License.


