

Manuscript accepted on : 10 March 2016
Published online on: --
Amr Amin1,2*, Mohammed Mukhtar1, Essam Noor Eldin1, Fahd Gethami3, Fayez Hafez3, Sameer Fatani1, Neda Bogari4, Mohammed Noor Eldin1,2, Abdullatif Babakr1, Soud Khogeer1and Ahmed Fawzy5*
1Biochemistry Department, Faculty of Medicine, Umm Al-Qura University, Makkah, Kingdom of Saudi Arabia. 2Oncology Diagnostic Unit, Faculty of Medicine, Ain Shams University, Cairo, Egypt. 3King Faisal Hospitals, Shesha, Makkah, Kingdom of Saudi Arabia. 4Medical Genetics department, Faculty of Medicine, Umm Al-Qura University, Makkah, Kingdom of Saudi Arabia. 5Division of Human Genetics and Genome Research, Department of Molecular Genetics and Enzymology, National Research Centre, 33Bohouth St. Dokki, Giza, Egypt Corresponding Author's Email: aaamin@uqu.edu.sa
DOI : http://dx.doi.org/10.13005/bbra/2032

ABSTRACT: Hepatic fibrosis detection is considered as a major independent predictor of treatment response in patients with chronic hepatitis C virus (HCV). Liver biopsy was represented as the gold standard method for evaluating liver fibrosis and has prone sampling errors and completions. Right now, usages of non-invasive predictors of fibrosis are considered less accurate than liver biopsy. We are aiming to reduce the use of the liver biopsy and instead evaluate the performance value of serum hyaluronic acid (HA), Collagen type IV (Coll-IV), and aspartate aminotransferase (AST) to platelet ratio index (APRI) as non-invasive diagnostic and stratification markers for hepatic fibrosis. In this study, we have recruited 104 subjects from Saudi population effected with chronic hepatitis C genotype 4. The enzyme-linked immunosorbent assay (ELISA) method was implemented for Liver histopathological staging (F), serum hyaluronic acid and Collagen-IV. APRI was calculated from serum AST activity and platelet count. The results of our current study indicated both Collagen-IV and APRI significantly distinguished fibrotic patients from non-fibrotic group. The HA, APRI, and Coll-IV results discriminate early F0/F1 from F2/F3 (p<0.001). A combination of direct and indirect tests (Coll-IV and APRI) improved the performance with sensitivity and specificity. The combination of APRI and Collagen-IV has a high diagnostic value in predicting moderate and severe fibrotic stages and could be clinically used as a diagnostic test especially for those HCV patients who could not be submitted for liver biopsy.
KEYWORDS: Hepatic fibrosis; chronic hepatitis C; HCV genotype 4; serum hyaluronic acid (HA); serum Collagen type IV (Coll-IV); AST to platelet ratio index (APRI); Receiver operating characteristics
Download this article as:| Copy the following to cite this article: Amin A, Mukhtar M, Eldin E. N, Gethami F, Hafez F, Fatani S, Bogari N, Eldin M. N, Babakr A, Khogeer S, Fawzy A. Prediction of Hepatic Fibrosis in Patients with Chronic Hepatitis C Genotype 4: A non-Invasive biochemical analysis. Biosci Biotech Res Asia 2016;13(1) |
| Copy the following to cite this URL: Amin A, Mukhtar M, Eldin E. N, Gethami F, Hafez F, Fatani S, Bogari N, Eldin M. N, Babakr A, Khogeer S, Fawzy A. Prediction of Hepatic Fibrosis in Patients with Chronic Hepatitis C Genotype 4: A non-Invasive biochemical analysis. Biosci Biotech Res Asia 2016;13(1). Available from: https://www.biotech-asia.org/?p=7748 |
Introduction
Hepatitis C is a global socio-medical health problem and the Hepatitis C virus genotype 4 (HCV-4), most dominant genotype in Saudi Arabia (1-4). Despite the reported declines in HCV prevalence, the disease continue to represent a major public health problem in the country with a significant morbidity and mortality as well as a great burden on the country’s healthcare system (5). Chronic infection with HCV induces the progression of liver fibrosis. HCV infection of the human liver myo-fibroblast triggers extracellular matrix overproduction, thereby contributing to the development of HCV-related liver fibrosis which implies possible progression to cirrhosis (6, 7). HCV genotypes may be correlated with severity of liver disease (8).The genotypes of HCV are unequally distributed throughout the world where, Types 1 and 3 are most common in Europe and the United States, while, Genotype 4 is common in the Middle East, Egypt, and central Africa (9). Genotyping in HCV patients is important for designing the therapeutic strategies where patients with genotype 4 (G4) chronic hepatitis C (CHC) are considered as a difficult population to treat (10).
Fibrosis and cirrhosis are different degrees of loss of structure and function of the liver. Currently, the only effective treatment for cirrhosis is liver transplantation, while early diagnosis and treatment of fibrosis is possible and will improve survival and reduce the need for liver transplantation (11, 12). Fibrosis stage is one of the factors that affecting the decision to treat HCV-patients soon or delay the treatment (13). The reference standard for diagnosing the extent of fibrosis in chronic liver disease is the invasive liver biopsy (LB), which provides useful information on numerous processes such as inflammation, necrosis or steatosis, but may be accompanied by potential serious complications that have led to develop noninvasive methods to replace LB (10, 14, 15). In addition, other disadvantages of liver biopsy are reported including that it does not efficiently reflect the fibrotic changes occurring in the entire liver due to the sample size. Biopsies from different areas have shown different stages of fibrosis causing the disagreements between pathologists as well as the increased cost of treatment and prolonged hospitalization (16, 17).
Nowadays, non-invasive liver tests including serum tests and imaging (Fibro-scan) are alternatives to biopsy in Europe and other areas of the world (18). Both have demonstrated a reasonable ability to identify significant fibrosis and replaced the histological procedure in clinical practice in the staging of fibrosis in patients with hepatitis C (11). Since the typical mechanism underlying the development of hepatic fibrosis is an imbalance between the deposition and removal of extracellular matrix, direct markers evaluate the turnover or metabolism of the extracellular matrix in the peripheral blood and hence, the assessment involves dynamic processes such as fibrogenesis or fibrolysis rather than existent fibrosis. Different direct markers are used where, liver fibrosis prediction including cytokines and several glycoproteins such as hyaluronic acid produced by hepatic stellate cells and the collagen family, as its production is associated with the deposition of the matrix that contributes to fibrosis (19-22).
On the other hand, indirect markers reflect liver changes induced by fibrosis, where they use the employment of a single or combined routine hematological or biochemical tests that reflect alteration of hepatic function. The most frequently included indirect markers are platelets count, the ratio of aspartate to alanine transaminases (AST/ALT ratio), and the ratio index of AST to platelets (APRI). Until now, the accuracy of these indirect markers is controversial (12, 17). Moreover, a major limitation of all these non-invasive liver tests is the absence of uniformly established and validated cut-offs for fibrosis stages (11). Various direct and indirect tests have been combined in patented commercial algorithms that improve the diagnostic accuracy of tests. Establishing accurate staging of liver disease is very important for enabling both therapeutic decisions and prognostic evaluations. The determination of the non-invasive markers accuracy in staging of liver fibrosis is important, especially in the regions where different HCV genotypes – that associated with more severity of liver disease -are common rather than those widespread in Europe(9). The rate of adoption of different direct and indirect non-invasive biomarkers in prediction of liver fibrosis differs from country to country, but remains limited (23). As liver fibrosis differs in the distribution within the liver and in the fibrogenic process itself ,therefore, each non-invasive biomarker or panel is in need to be evaluated across a variety of clinical cohorts in addition to genotyping identification(9). We are aiming in this study to assess the efficiency and the performance of a panel of non-invasive markers (including two direct markers -Collagen-IV and Hyaluronic acid- and one indirect marker, APRI) to predict fibrosis stage in our patients with chronic HCV-4.
Patients and methods
Patients Selection
This study was conducted in accordance with the declaration of Helsinki (24). The ethical committee and institutional review board (IRB) of the faculty of Medicine, Umm Al-Qura University, Saudi Arabia, approved the protocol including both well-constructed questionnaire and an informed consent that obtained from individual patients. Out of 202 patients with chronic hepatitis liver disease who attended the outpatient clinic of King Faisal Hospital, in Makkah, Saudi Arabia during 2012 to 2014 (with indicated liver biopsy), a total of 167 positive HCV-RNA-patients were enrolled in this study. The diagnosis of chronic liver disease (CLD) was done on the basis of clinical picture, ultra-sonography findings, liver function profile, and endoscopy. Liver fibrosis staging indicated for these patients were carried out through histopathological examination of liver biopsy, classified using METAVIR classification. Detailed clinical history and clinical examinations were undertaken. All 167 patients were checked for HCV-genotype using nested PCR/RFLP technique. One hundred four patients (104) were genotyped as genotype-4 (66 men and 38 women, aged 32 – 68 years). In addition; fifty healthy control-volunteers were recruited with no significant history of liver disease, negative for HCV-Ab/HBsAg/HBcIgG, and with normal liver enzymes at the time of collection. The fibrosis staging used in the analysis of the study was classified according to METAVIR scoring system (F) into F0 = no significant fibrosis, F1 = portal fibrosis without septa, F2 = portal fibrosis with rare septa, F3 = abundant bridging fibrosis, and F4 = cirrhosis or advanced scarring of the liver versus healthy individuals (25).
Methodology
Biochemical and Immunological Quantitative Analysis
All groups underwent activity assessment of liver enzymes [(Aspartate aminotransferase (AST) and Alanine aminotransferas (ALT)], complete blood picture (CBC), and quantitative measurements of hyaluronic acid (HA), Collagen IV in addition to Aspartate-Platelet Ratio Index (APRI) score-calculation. CollagenIV (Coll-IV) was measured using the ELISA Kit for Collagen Type-IV (SEA180Hu, Cloud-Clone Corporation, USA) using pre-coated micro-titer plate coated with an antibody specific to Coll-IV. The concentration of Coll-IV in the samples is determined by comparing the absorbance of the samples to the standard curve. Hyaluronic acid (HA) was measured using the TECO® ELISA assay kit (TE1017-2, TECO medical Group, Switzerland) using a micro-titer pre-coated plate with HA binding protein (HABP) and HRP conjugated HABP for detection. The concentration of HA in the samples is determined by comparing the absorbance of the samples to the standard curve. APRI is a simple and inexpensive calculation method based on the platelet count and AST value to check for liver fibrosis. The score is calculated according to the following the formulation (26, 27):
APRI = AST (IU/L) / AST upper normal limit (IU/L) /Platelet count (109/L) X 100
Note: 40 IU/L is the upper limit for AST
Molecular Analysis
HCV RNA was extracted from fifty μl of serum using high pure viral RNA extraction kit according to the manufacturer’s instructions (ROCHE Diagnostic GmbH, Mannheim, Germany). cDNA was synthesized from 7 μl of RNA with 200 U of AMV reverse transcriptase (Promega, USA) AMV reverse transcriptase 5X reaction buffer, 10 mM of the dNTPs in the presence of 40 U random primers and 20 U of RNase inhibitor (Promega, USA).
Nested PCR (28): c-DNA was transcribed using specific outer antisense primer from 5’ noncoding region (NCR)-core region. . Direct PCR was performed with the cDNA in the reaction mixture of a total reaction volume of 25 μl containing 250 μmol/μldNTPs, 0.75 U Taq DNA polymerase, PCR buffer (10 X), 2.5 mmol/μl MgCl2, (MBI Fermentas, Lithunia), and 20 pmol primers, P1 and P2 for 5’-NCR–core region (Table 1). Nested PCR was performed in the reaction mixture containing PCR buffer (10X), 2.5 mmol/μl MgCl2, 250 μmol/μl dNTPs, 0.75 U Taq DNA polymerase, 20 pmol primers P3 and P4 for 5’-NCR–core region (table2). Both the 1stand 2nd rounds of nested-PCR were composed of thirty five cycles programmed as the following conditions: denaturation at 94°C for 3 min, followed by 35 cycles of amplification for 45 s each at 94 °C, 55 °C, and 72 °C and finally 5 min at 72 °C for final extension. The 2ndamplified product was then electrophoresed with ethidium bromide in a 2 % agarose gel (Sigma-Aldrich, USA) and visualized using a BIORAD UV-transilluminator for identifying desired 234bp fragment using molecular weight marker.
Table1: primers sequence used for the nested PCR
| Name | Location | Sequence |
| Outer P1 | 030-054 | 5’GTGAGGAACTACTGTCTTCACGCA G3′ |
| Outer P2 | 307-331 | 5’TGCTCATGGTGCAGCGTCTACGAGA3′ |
| Inner P3 | 046-065 | 5’TTCACGCAGAAAGCGTCTAG3′ |
| Inner P4 | 262-282 | 5’CTATCAGGCAGTACCACAAGG3′ |
RFLP genotyping
HCV genotype identification was carried out using restriction fragment length polymorphism (RFLP) method as described (28). Briefly, 10 μl from the nested PCR products of from the 5’ non-coding region 234bp, were digested by restriction endonuclease enzymes for 2 hours at 37oC by both MvaI/HinfI in buffer H and RsaI/HaeIII in buffer L (Boehringer Manheim, Germany). Bands corresponding to specific 5’ NCR sequences were visualized under UV transilluminator and identified according to specific recognition sequence.
Statistical analysis
All statistical analysis was performed using statistical package of social sciences (SPSS) program (Version 20) including Mann-Whitney and Kruskal-Wallis tests, (CDC, Atlanta, USA). The probability value, p<0.05 was regarded as statically significant. ROC was performed to determine the cutoff point which maximizes the total of both sensitivity and specificity. Student t-test and ANOVA were used for comparison. Pearson’s correlation coefficient was used to examine the relation between each two tests.
Results
One hundred four patients out of 167 of HCV-infected patients were diagnosed as genotype 4 (62.3%). The molecular weight of PCR product from the inner primers was 234bp fragment (data not shown). Patterns of RFLP digestion for genotype 4 using restriction endonucleases, RsaI, HaeIII showed two different patterns (114/102 bp and 114/58/44bp).
Descriptive characteristics of all patients showed that the age of the patients was 45.3± 1.5 years. Sixty four patients were male (61.5%) and 40 patients were female (38.5%). Histopathological date revealed the stages of the fibrosis, F0 for 12 patients (11.5%), F1 for 18 patients (17.3%), F2 for 52 patients (50%), where, 22 patients (21.1%) were categorized as severe liver fibrosis F3. No cases were classified for of stage F4, hence, not included in the study. A significant increases in both APRI and Coll-IV levels in the fibrotic HCV-infected patients (genotype 4) compared to control group, (Mean ± SEM 1.06 ± 0.06 and 1.3 ± 0.05ng/ml versus 0.45 ± 0.02 and 0.87 ± 0.05ng/ml for APRI and Coll-IV, respectively) (p< 0.01) (table 3). However, no significant difference in HA levels was observed between the two groups. In addition, no significant difference between male and female was recorded. Significant increase was recorded between the three selected biomarkers, APRI, Coll-IV, and HA between the four fibrosis stages, early (F0 and F1), moderate (F2), and severe (F3) ((p< 0.01) (Table 2).
Table (2):= Mean levels of non-invasive diagnostics in Fibrotic HCV-4 patients with different METAVIR stages and controls.
| Control
(n=50) |
Fibrotic HCV-4
(n=104) |
t – test | P value | F0
(n=12) |
F1
(n=18) |
F2
(n=52) |
F3
(n=22) |
F -test
|
P value | |
| APRI
Score |
0.45±0.02
|
1.06±0.06
|
51.12 | 0.001* | 0.55±0.09
|
0.71±0.08
|
1.10±0.06
|
1.54±0.14
|
15.72 | 0.001* |
| COLL-IV
ng/ml |
0.87±0.05
|
1.30±0.05
|
31.17 | 0.001* | 0.97±0.13
|
1.05±0.10
|
1.30±0.05
|
1.71±0.08
|
12.18 | 0.001* |
| HA
ng/ml |
90.0±11.0
|
102.0±7.0
|
0.79 | 0.37* | 34.0±3.0
|
71.0±9.0
|
110.0±6.0
|
176.0±0.08
|
37.35 | 0.001* |
For Fibrosis prediction, cutoff values for the three markers were calculated using ROC curves and the area under the curve (AUC) to predict fibrosis of HCV-4 infected patients for APRI, Coll-IV, and HA, the cut off values were (0.6, 0.97, and 93.9 ng/ml respectively) with area under the curve of (AUC 0.931, 0.819, and 0.563, respectively) and with sensitivities of (80.4%, 75%, 53.8%, respectively) and specificities of (76.7%, 73.0%, and 60%, respectively) ( Table 3 & Figure 1). Using the cut-off value of 110ng/ml, HA showed 64.9% Se, 100% Sp with AUC of 0.994 for severe fibrosis F≥2. Cut-off value of Coll-IV 1.3ng/ml showed severe liver fibrosis prediction of 65% Se, 86.7% Sp with AUC 0.829. The cut-off value of APRI 0.91 revealed 81.1% Se, 93.7% Sp and AUC of 0.917. All studied markers showed increase in NPV for stage F≥2 versus early stages with area under the curve reached 0.917 in case of APRI (Table 4). While, HA failed to discriminate early fibrosis stage F0/F1 with specificity of 53.3%, it showed excellent ability as a screening test for severe stage (F3) with highest specificity and PPV reached 100%. APRI scores revealed an excellent screening ability for early fibrosis prediction with both specificity and PPV of 100% and NPV 96% using cutoff value of 0.91. Double combination of both indirect marker (APRI) and direct marker (Coll-IV) improved the sensitivity (91.8%) and specificity (78.7%) with positive predictive value and accuracy of (86.5% and 86.6% respectively). Highest sensitivity (92%) was revealed in case of combination of the three markers as a panel, with a specificity, positive predictive value and accuracy of (81.2%, 88.4%, and 87.8%, respectively). Using Pearson’s correlation that revealed highly significant positive correlation between each two markers of the study, especially between APRI and Coll-IV, r = 0.72, p< 0.01 (Table 4).
Table (3): Diagnostic accuracy of different studied markers for fibrosis prediction using optimal ROC curves.
| Fibrosis stage | Cut off ≥ | Sea
% |
Spb
% |
NPVc
% |
PPVd
% |
AUC | |
| HA
ng/ml |
F0,1,2,3
Vs Cont. |
93.9 | 53.8 | 60.0 | 38.4 | 73 | 0.563 |
| F2,3
Vs F0,1 |
110 | 64.9 | 100.1 | 53.6 | 100 | 0.944 | |
| Coll-IV
ng/ml |
F0,1,2,3 Vs Cont. | 0.97
|
73.0 | 75.0
|
58 | 85 | 0.819 |
| F2,3
Vs F0,1 |
65.0 | 1.3 | 86.7 | 92.3 | 50.1 | 0.829 | |
| APRI | F0,1,2,3
Vs Cont. |
80.4 | 0.60 | 76.6 | 87.7 | 65.2 | 0.931 |
| F2,3
Vs F0,1 |
81.1 | 0.91 | 93.7 | 96.9 | 66.7 | 0.917 |
Vs: versus; Cont.: control; Se: sensitivity; Sp: specificity. a: true positives/true positives + false negatives; b: true negatives/true negatives + false positives; c: true positives/true positives + false positives; d: true negatives/true negatives + false negatives. HA: hyaluronic acid; NPV: negative predictive value; Coll–IV: Collagen-IV; APRI: Aspartate/Platelet count Ratio Index; PPV: positive predictive value. AUC: The area under the curve representing the accuracy of the test (The higher value near to 1.0 is the more discrimination ability of the test).
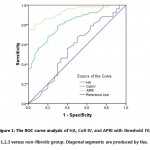 |
Figure 1: The ROC curve analysis of HA, Coll-IV, and APRI with threshold F0, 1,2,3 versus non-fibrotic group. Diagonal segments are produced by ties |
Table 4: Correlation between APRI, HA, and Collagen IV biomarkers
| Collagen IV
ng/ml |
APRI | ||
| HA
ng/ml |
Pearson Correlation
Sig. (2-tailed) |
0.55*
0.001 |
0.44*
0.001 |
| Collagen IV
ng/ml |
Pearson Correlation
Sig. (2-tailed) |
_____________ | 0.72*
0.001 |
Discussion
In the present study, we were found a panel of direct non-invasive serum markers of extra-cellular matrix (ECM), Hyaluronic acid (HA), Collagen IV (Coll-IV), and indirect marker (Aspartate/Platelet count Ratio Index, APRI) individually and in combine to be a significant predictors of liver fibrosis in HCV-4 infected patients in comparison to liver biopsy results.
Worldwide, thirty millions out of 150 million chronic hepatitis C patients are exposed to health deterioration due to cirrhosis progression (29).Chronic infection with HCV triggers extracellular matrix over-production induces the progression of liver fibrosis, thereby, contributing to the development of HCV-related liver fibrosis (6, 7).An association is reported between different HCV genotypes and severity, aggressiveness, and histological pattern of liver fibrosis (8, 29-32). Hepatitis C virus genotype 4 (HCV-4) is the most prevalent genotype in Saudi Arabia with a significant morbidity and mortality as well as a great burden on the country’s healthcare system (2-4, 29). Liver fibrosis stratification is an essential factor that should be considered in the management of patients with HCV (33). Despite genotype identification and fibrosis stratification in HCV patients is important for designing the therapeutic strategies, a great debate is still current about the best simple efficient method used for liver fibrosis assessment that could help hepatologists in the decision of management (34) which could reduce 30% of the HCV related-deaths by 2030 (35).
While liver biopsy is still used in the USA for liver fibrosis assessment, it has been largely replaced in Europe and other areas of the world by blood markers and/or fibro-scan (18).A growing medical attention is performed to select non-invasive bio markers that can accurately predict the fibrosis progression. Although, fibrosis diagnosis of F0-F2 is considered a factor in decision of speed up treatment of HCV-infected patients (13), the results of fibrosis prediction tools to discriminate the stages of fibrosis between F1 and F3 are not completely validated. Combinations of simple laboratory tests that reflect the underlying pathophysiology of liver fibrosis increase possibility to exclude severe fibrosis (34).
Among 167 positive HCV-RNA infected-patients subjected for genotyping in this study, only 104 patients (62%) were HCV-4 using nested PCR/RFLP analysis. Liver biopsy was indicated and performed for all patients. Fibrosis was staged on a scale as described before according to the METAVIR score system (25). None of the patients staged as F4 could be collected from histopathology and hence, not involved in the study. All 104 positive HCV-RNA genotype 4 patients were recruited and compared to 50 healthy-control group. In the present study, we evaluated the accuracy of a panel of direct non-invasive serum markers of extra-cellular matrix (ECM), Hyaluronic acid (HA), Collagen IV (Coll-IV), and indirect marker (Aspartate/Platelet count Ratio Index, APRI) individually and in combine to predict liver fibrosis in HCV-4 infected patients in comparison to liver biopsy results. While Figure 1 showed increase in the mean levels for the three examined markers with different liver fibrosis stages (F0,1,2,3), Table (2) revealed that only two of them, Coll-IV and APRI markers showed significant increase in leveling the fibrotic HCV-4 patients (Mean ± SEM 1.3 ± 0.05ng/ml and 1.06 ± 0.06 ng/ml versus healthy group mean levels of 0.87 ± 0.05ng/ml and 0.45 ± 0.02ng/ml for Coll-IV and APRI, respectively) (p< 0.01), respectively.
In our study, using area under the ROC curve, APRI provided the best accurate results of discrimination ability to exclude patients without fibrosis from those HCV-4 with early fibrosis changes parallel to METAVIR score of at least F0/1(AUC, 0.931) in comparison to the other two non-invasive liver fibrosis tests, Coll-IV and HA AUC 0.819 and 0.563, respectively, the APRI cut-off point being >0.6 for HCV-4 patients showed higher sensitivity (80.4%) with moderate specificity (76.6%)and with predictive values;87.7% PPV and 65.2 % NPV in HCV-4 indicating moderate ability to predict fibrotic changes. However, using of cut off value 0.91 increased the specificity to 93.7 with sensitivity 81.1% and PPV of 96.9% in discrimination of moderate and severe fibrosis stages (F≥2) compared to early stages F0 and F1 (AUC 0.917). In another study, it has been set almost the same cut off value 0.9 for severe fibrosis prediction in HCV-infected patients with 78% sensitivity and 68.6% specificity (36). Close cutoff values to that results in our study were reported by Lin et al., who performed a large meta-analysis included more than 8,700 patients on hepatitis C virus (HCV) mono-infected and HCV / human immunodeficiency virus (HIV) co-infected individuals reporting APRI cut off value 0.7 with an estimated sensitivity of 77% and specificity of 72% for detection of liver fibrosis associated with hepatitis and cut off value of 1.0 for fibrosis F≥2 using METAVIR classification with sensitivity and specificity of 61% and 64%, respectively) (27). Liu et al. reported lower APRI cut off values, 0.11 and 0.18 for different ages of patients to identify CHB patients with insignificant fibrosis (37), where, Yilmaz et al. chose an optimal cut off value >0.44 for CHC patients with sensitivity 72.7% and a specificity of 62.4% for diagnosis of fibrosis {1-4 (38)}. Another study calculated an optimal cut-off of 0.98 (AUC 0.85), resulting a sensitivity of 75% and specificity of 86%for prediction of advanced fibrosis stages in NAFLD patients (39). These results of APRI support our suggestion that these variations in APRI cut off values may be related to many factors including differences in sample size, different etiology of liver fibrosis (NAFLD, CHB, Co-infection with HIV, CHC with genotype variations), with the influence on the mechanism of fibrosis progression.
The ROC curves showed that the optimal cutoff value that maximizes the sum of both sensitivity and specificity of Coll-IV to screen HCV-4 patients for fibrosis was >0.97 ng/ml with a moderate sensitivity, specificity, NPV and PPV of75%, 73%, 58%, and 85%, respectively. The diagnostic efficacy was shown with Coll-IV cutoff value of 1.3 ng/ml to distinguish both moderate and severe stage F ≥2 of fibrosis with sensitivities 65%, and specificity of 86.7%. These findings are close to those reported by many researchers elsewhere (with different cut-off values) who studied the coll-4 but in different liver pathogenic disease-induced fibrosis including NAFLD and HCV-patients (40-45). A study by Aida et al. reported lower cut off value 0.770 ng/ml to diagnose severe fibrosis stage F<2 in HCV-infected patients increased to 0.827 ng/ml in case of NAFLD (36). Higher cutoff level ≥5.0 ng/mL was selected by Sakugawa et al. for Coll-IV with AUC of 0.82, NPV of 83.6%, and PPV of 86% for the detection of severe fibrosis in 112 patients with NAFLD (42). We hypothesized that there is a significant correlation between Coll-IV serum concentration and fibrosis progression but both selected cut-off values and the stage stratification ability depend on the type of liver pathogenesis that induce fibrosis. More specific studies with large sample size are needed to establish the cut off value and to direct the clinical utility according to the difference in liver pathogenesis and the difference of geographical distribution of genotypes of viral hepatitis.
Although, non-significant difference was found in HA levels in fibrotic group compared to control, a significant increase was revealed between different fibrosis stages, F0 (34±3.0ng/ml), F1 (71±9.0ng/ml), F2 (110±6.0ng/ml), F3 (176±0.08ng/ml), p>0.01. Geramizadeh et al., showed significant increase of HA concentrations for 93 HBV infected-patients 59.7 ± 10.5 ng/mL for stages 0–2, 149.4 ± 15.9 ng/mL for stages 3–4, and 284.5 ± 14.5 ng/mL for stages 5–6 (46). We selected the cut-off value 93.9 ng/ml as the upper limit of normal HA with achieving best sensitivity and specificity (53.8% and 60%, respectively) and predictive values of 57.6% and 60% for both PPV and NPV, respectively. Where, increasing the HA cut off value to 110 ng/ml revealed a significant difference to discriminate severe fibrosis stage (F≥2) compared to early stages (F>2) with 64.9% sensitivity and a specificity of 100% with high PPV 100% and NPV of 53.6% and AUC of 0.944 indicating good diagnostic ability to predict both moderate and severe fibrosis (F≥2). We compared our results to those reported for HA to diagnose or stratify fibrosis, Stibbe et al. reported HA cut off value 0.86ng/ml distinguishing F0123 from F4 (p<0.001) in 89 patients of chronic viral hepatitis B and C with a corresponding AUC (95% CI) which was in concordance with cut off value 0.799 ng/ml selected by Aida et al. to discriminate severe fibrosis, stage 3/4 in 187 chronic hepatitis C (36, 47). Resino et al. studied 201 HIV/Hepatitis C co-infected patients for fibrosis prediction using noninvasive HA measurement, reporting HA cut-off 1182 ng/ml to exclude cirrhosis (F4) with a NPV of 99% and cut-off value 2400 ng/ml to confirm cirrhosis (F4) (48). Geramizadeh et al., reported HA cut off value <113 ng/ml for fibrosis detection in 93 HBV infected-patients with sensitivity 92%, specificity 95%, NPV 89%, and PPV 94%, the cut off raised to >181 ng/ml for severe fibrosis detection, achieving 100% sensitivity, 95% specificity, 100% NPV, and 78% PPV (46). Halfon et al. reported HA cut off values to predict significant fibrosis, severe fibrosis, and cirrhosis of 121, 160, and 237 ng/ml, respectively with PPV of 94%, 100%, and 57%, respectively (49). Several studies have been performed with HA using other ranges of cut-off values (16 – 160 ng/ml) to exclude cirrhosis with variable PPV indicating HA as a biomarker for high score fibrosis and cirrhosis. However, setting of these previously described cut-offs reduces our data sensitivity in excluding severe fibrosis (42, 50-56). These above values variations (from 0.799ng/ml to 2400 ng/ml) may be related to the difference in manufacturing kits.
Significant correlations using Pearson correlation (2-tailed) between the three parameters was shown, (p>0.001), table (5). Testing the pattern of stages results using Scheffe method (Post Hoc analysis), significant correlation between both early stages, F0 and F1, moderate, and severe stages (F2 and F3) was recorded. Enhancement of diagnostic performance for the detection of different liver fibrosis stages was achieved using combination of the three studied tests. Improvement in the sensitivity, specificity, and accuracy was observed for each biomarker when combined with each other. Increased sensitivity 91.8% was shown in case of both APRI and Coll-IV combination with specificity, NPV, and PPV 78.7%, 86.6%, and 86.5%, respectively. Higher sensitivity (92%) was achieved in case of the three markers combined panel, with specificity, PPV, NPV and accuracy (81.2%, 88.4%, 86.6%, and 87.8%, respectively).
Conclusion
Among non-invasive liver fibrosis biomarkers, APRI has the highest diagnostic value in discriminating liver fibrosis stages (F2-3) for patients with HCV genotype 4. Clinically, combination of direct and indirect non-invasive serum biomarkers, Collagen IV and APRI is suggested to screen HCV-4 patients for moderate and severe fibrosis. This allows physicians to define severe fibrotic patients, especially for those patients who couldn’t be submitted for liver biopsy.
Acknowledgment
We thank all the participants in the study for their enthusiastic collaboration, in particular the personnel of the governmental clinics in Makkah. We acknowledge the Institute of Scientific Research and Revival of Islamic Heritage at Umm Al-Qura University for his financial support for this study.
Conflict of interest
We declare no conflict of interest. No, there are any competing financial interests in relation to the work described.
References
- Vukovic VR, Baskic D, Mijailovic Z, Djurdjevic P, Jovanovic D, Mitrovkic S, et al. Popovic S. Association between risk factors, basal viral load, virus genotype and the degree of liver fibrosis with the response to the therapy in patients with chronic hepatitis C virus infection. Vojnosanit Pregl 2015;72:505-509.
- Al Ashgar HI, Khan MQ, Al-Ahdal M, Al Thawadi S, Helmy AS, Al Qahtani A, Sanai FM. Hepatitis C genotype 4: genotypic diversity, epidemiological profile, and clinical relevance of subtypes in Saudi Arabia. Saudi J Gastroenterol 2013;19:28-33.
- Abdel-Moneim AS, Bamaga MS, Shehab GM, Abu-Elsaad AA, Farahat FM. HCV infection among Saudi population: high prevalence of genotype 4 and increased viral clearance rate. PLoS One 2012;7:e29781.
- Abozaid SM, Shoukri M, Al-Qahtani A, Al-Ahdal MN. Prevailing genotypes of hepatitis C virus in Saudi Arabia: a systematic analysis of evidence. Ann Saudi Med 2013;33:1-5.
- Abdo AA, Sanai FM, Al-Faleh FZ. Epidemiology of viral hepatitis in Saudi Arabia: are we off the hook? Saudi J Gastroenterol 2012;18:349-357.
- Chen SL, Morgan TR. The natural history of hepatitis C virus (HCV) infection. Int J Med Sci 2006;3:47-52.
- Aoudjehane L, Bisch G, Scatton O, Granier C, Gaston J, Housset C, et al. Infection of Human Liver Myofibroblasts by Hepatitis C Virus: A Direct Mechanism of Liver Fibrosis in Hepatitis C. PLoS One 2015;10:e0134141.
- Takada N, Takase S, Enomoto N, Takada A, Date T. Clinical backgrounds of the patients having different types of hepatitis C virus genomes. J Hepatol 1992;14:35-40.
- Chakravarti A, Dogra G, Verma V, Srivastava AP. Distribution pattern of HCV genotypes & its association with viral load. Indian J Med Res 2011;133:326-331.
- Bonnard P, Elsharkawy A, Zalata K, Delarocque-Astagneau E, Biard L, Le Fouler L, et al. Comparison of liver biopsy and noninvasive techniques for liver fibrosis assessment in patients infected with HCV-genotype 4 in Egypt. J Viral Hepat 2015;22:245-253.
- Crossan C, Tsochatzis EA, Longworth L, Gurusamy K, Davidson B, Rodriguez-Peralvarez, et al. Cost-effectiveness of non-invasive methods for assessment and monitoring of liver fibrosis and cirrhosis in patients with chronic liver disease: systematic review and economic evaluation. Health Technol Assess 2015;19:1-409, v-vi.
- Caviglia GP, Touscoz GA, Smedile A, Pellicano R. Noninvasive assessment of liver fibrosis: key messages for clinicians. Pol Arch Med Wewn 2014;124:329-335.
- Shiffman ML, Benhamou Y. Patients with HCV and F1 and F2 fibrosis stage: treat now or wait? Liver Int 2013;33 Suppl 1:105-110.
- Denzer U, Arnoldy A, Kanzler S, Galle PR, Dienes HP, Lohse AW. Prospective randomized comparison of minilaparoscopy and percutaneous liver biopsy: diagnosis of cirrhosis and complications. J Clin Gastroenterol 2007;41:103-110.
- Skladany L, Jarcuska P, Oltman M, Hrusovsky S. [Percutaneous biopsy of the liver]. Vnitr Lek 2003;49:679-683.
- Fallatah HI. Noninvasive Biomarkers of Liver Fibrosis: An Overview. Advances in Hepatology 2014;2014:15.
- Martinez SM, Crespo G, Navasa M, Forns X. Noninvasive assessment of liver fibrosis. Hepatology 2011;53:325-335.
- Friedrich-Rust M, Rosenberg W, Parkes J, Herrmann E, Zeuzem S, Sarrazin C. Comparison of ELF, FibroTest and FibroScan for the non-invasive assessment of liver fibrosis. BMC Gastroenterol 2010;10:103.
- Kassaye S, Li Y, Huhn G, Peters MG, French AL, Tien PC, et al. Direct and Indirect Serum Markers of Liver Fibrosis Compared with Transient Elastography among Women in the Women’s Interagency HIV Study. J AIDS Clin Res 2015;6.
- Neuman MG, Cohen LB, Nanau R. Hyaluronic acid as a non-invasive biomarker of liver fibrosis. Clin Biochem 2015.
- Orasan OH, Sava M, Iancu M, Cozma A, Saplontai-Pop A, Sarlea Tarmure S, Lungoci C, et al. Serum hyaluronic acid in chronic viral hepatitis B and C: a biomarker for assessing liver fibrosis in chronic hemodialysis patients. Int Urol Nephrol 2015;47:1209-1217.
- Zhu C, Qi X, Li H, Peng Y, Dai J, Chen J, et al. Correlation of serum liver fibrosis markers with severity of liver dysfunction in liver cirrhosis: a retrospective cross-sectional study. Int J Clin Exp Med 2015;8:5989-5998.
- Baranova A, Lal P, Birerdinc A, Younossi ZM. Non-invasive markers for hepatic fibrosis. BMC Gastroenterol 2011;11:91.
- World Medical A. World Medical Association Declaration of Helsinki: ethical principles for medical research involving human subjects. JAMA 2013;310:2191-2194.
- Bedossa P, Poynard T. An algorithm for the grading of activity in chronic hepatitis C. The METAVIR Cooperative Study Group. Hepatology 1996;24:289-293.
- Zarski JP. What is the performance of the Aspartate Aminotransferase to platelets Ratio Index in patients With Chronic Liver Disease? Hepat Mon 2011;11:1000-1001.
- Lin ZH, Xin YN, Dong QJ, Wang Q, Jiang XJ, Zhan SH, et al. Performance of the aspartate aminotransferase-to-platelet ratio index for the staging of hepatitis C-related fibrosis: an updated meta-analysis. Hepatology 2011;53:726-736.
- Constantine NT, Abdel-Hamid M, Oldach D. Rapid genotyping of hepatitis C virus. N Engl J Med 1995;333:800.
- Kohli A, Shaffer A, Sherman A, Kottilil S. Treatment of hepatitis C: a systematic review. JAMA 2014;312:631-640.
- Osoba AO. Hepatitis C virus genotypes in Saudi Arabia. Saudi Med J 2002;23:7-12.
- Sebastiani G, Gkouvatsos K, Pantopoulos K. Chronic hepatitis C and liver fibrosis. World J Gastroenterol 2014;20:11033-11053.
- Lau DT, Luxon BA, Xiao SY, Beard MR, Lemon SM. Intrahepatic gene expression profiles and alpha-smooth muscle actin patterns in hepatitis C virus induced fibrosis. Hepatology 2005;42:273-281.
- Dienstag JL. The role of liver biopsy in chronic hepatitis C. Hepatology 2002;36:S152-160.
- Udell JA, Wang CS, Tinmouth J, FitzGerald JM, Ayas NT, Simel DL, et al. Does this patient with liver disease have cirrhosis? JAMA 2012;307:832-842.
- Volk ML, Tocco R, Saini S, Lok AS. Public health impact of antiviral therapy for hepatitis C in the United States. Hepatology 2009;50:1750-1755.
- Aida Y, Abe H, Tomita Y, Nagano T, Seki N, Sugita T, et al. Serum immunoreactive collagen IV detected by monoclonal antibodies as a marker of severe fibrosis in patients with non-alcoholic fatty liver disease. J Gastrointestin Liver Dis 2015;24:61-68.
- Liu HB, Zhou JP, Zhang Y, Lv XH, Wang W. Prediction on liver fibrosis using different APRI thresholds when patient age is a categorical marker in patients with chronic hepatitis B. Clin Chim Acta 2011;412:33-37.
- Yilmaz Y, Yonal O, Kurt R, Bayrak M, Aktas B, Ozdogan O. Noninvasive assessment of liver fibrosis with the aspartate transaminase to platelet ratio index (APRI): Usefulness in patients with chronic liver disease: APRI in chronic liver disease. Hepat Mon 2011;11:103-106.
- Kruger FC, Daniels CR, Kidd M, Swart G, Brundyn K, van Rensburg C, et al. APRI: a simple bedside marker for advanced fibrosis that can avoid liver biopsy in patients with NAFLD/NASH. S Afr Med J 2011;101:477-480.
- Li CH, Piao DM, Xu WX, Yin ZR, Jin JS, Shen ZS. Morphological and serum hyaluronic acid, laminin and type IV collagen changes in dimethylnitrosamine-induced hepatic fibrosis of rats. World J Gastroenterol 2005;11:7620-7624.
- Murawaki Y, Koda M, Okamoto K, Mimura K, Kawasaki H. Diagnostic value of serum type IV collagen test in comparison with platelet count for predicting the fibrotic stage in patients with chronic hepatitis C. J Gastroenterol Hepatol 2001;16:777-781.
- Sakugawa H, Nakayoshi T, Kobashigawa K, Yamashiro T, Maeshiro T, Miyagi S, et al. Clinical usefulness of biochemical markers of liver fibrosis in patients with nonalcoholic fatty liver disease. World J Gastroenterol 2005;11:255-259.
- Walsh KM, Fletcher A, MacSween RN, Morris AJ. Basement membrane peptides as markers of liver disease in chronic hepatitis C. J Hepatol 2000;32:325-330.
- Grigorescu M. Noninvasive biochemical markers of liver fibrosis. J Gastrointestin Liver Dis 2006;15:149-159.
- Yoneda M, Mawatari H, Fujita K, Yonemitsu K, Kato S, Takahashi H, et al. Type IV collagen 7s domain is an independent clinical marker of the severity of fibrosis in patients with nonalcoholic steatohepatitis before the cirrhotic stage. J Gastroenterol 2007;42:375-381.
- Geramizadeh B, Janfeshan K, Saberfiroozi M. Serum hyaluronic acid as a noninvasive marker of hepatic fibrosis in chronic hepatitis B. Saudi J Gastroenterol 2008;14:174-177.
- Stibbe KJ, Verveer C, Francke J, Hansen BE, Zondervan PE, Kuipers EJ, de Knegt RJ, et al. Comparison of non-invasive assessment to diagnose liver fibrosis in chronic hepatitis B and C patients. Scand J Gastroenterol 2011;46:962-972.
- Resino S, Bellon JM, Asensio C, Micheloud D, Miralles P, Vargas A, et al. Can serum hyaluronic acid replace simple non-invasive indexes to predict liver fibrosis in HIV/Hepatitis C coinfected patients? BMC Infect Dis 2010;10:244.
- Halfon P, Bourliere M, Penaranda G, Deydier R, Renou C, Botta-Fridlund D, et al. Accuracy of hyaluronic acid level for predicting liver fibrosis stages in patients with hepatitis C virus. Comp Hepatol 2005;4:6.
- Rostami S, Parsian H. Hyaluronic Acid: from biochemical characteristics to its clinical translation in assessment of liver fibrosis. Hepat Mon 2013;13:e13787.
- McHutchison JG, Blatt LM, de Medina M, Craig JR, Conrad A, Schiff ER, et al. Measurement of serum hyaluronic acid in patients with chronic hepatitis C and its relationship to liver histology. Consensus Interferon Study Group. J Gastroenterol Hepatol 2000;15:945-951.
- Nassef YE, Shady MM, Galal EM, Hamed MA. Performance of diagnostic biomarkers in predicting liver fibrosis among hepatitis C virus-infected Egyptian children. Mem Inst Oswaldo Cruz 2013;108:887-893.
- Lydatakis H, Hager IP, Kostadelou E, Mpousmpoulas S, Pappas S, Diamantis I. Non-invasive markers to predict the liver fibrosis in non-alcoholic fatty liver disease. Liver Int 2006; 26:864-871.
- Gressner OA, Weiskirchen R, Gressner AM. Biomarkers of liver fibrosis: clinical translation of molecular pathogenesis or based on liver-dependent malfunction tests. Clin Chim Acta 2007; 381:107-113.
- Vizzutti F, Arena U, Nobili V, Tarquini R, Trappoliere M, Laffi G, et al. Non-invasive assessment of fibrosis in non-alcoholic fatty liver disease. Ann Hepatol 2009; 8:89-94.
- Naveau S, Raynard B, Ratziu V, Abella A, Imbert-Bismut F, Messous D, et al. Biomarkers for the prediction of liver fibrosis in patients with chronic alcoholic liver disease. Clin Gastroenterol Hepatol 2005; 3:167-174.

This work is licensed under a Creative Commons Attribution 4.0 International License.


