

Manuscript accepted on : 15 February 2016
Published online on: 22-02-2016
Effect of Silica on Carbohydrate Content of Mixed Culture Phaeodactylum sp. and Chlorella sp.
Eko Agus Suyono*, Sri Nopitasari, Muhammad Zusron, Pretty Khoirunnisa, Dinda Ayu Islami and Cakra Buana Prabeswara
Laboratory of Biotechnology, Faculty of Biology, Universit as Gadjah Mada Jl. Teknika Selatan, Sekip Utara, Yogyakarta, Indonesia 55281
DOI : http://dx.doi.org/10.13005/bbra/2011

ABSTRACT: Microalgae is one organism that can be used as raw material for bioethanol production. Growth and composition of microalgae cells affected by strain and environmental conditions, including temperature, pH and nutrients. Nutrients are used for the growth of one of silica, except that the silica used to form frustule on diatoms. This study aimed to determine the effect of silica on growth, dry weight, and carbohydrate produced from mixed cultures Phaeodactylum sp. and Chlorella sp. Cultivation is carried out for 21 days on a laboratory scale using a medium F / 2. Culture growth was measured by counting cell density. The dry weight is calculated every 7 days to obtain a biomass productivity. Carbohydrate content was measured by the phenol-sulfuric method. samples were taken on days 0, 7, 14 and 21. It could be concluded that the highest quota of carbohydrate per cell was obtained on Si 90 ppm, accounted for 0.03977 mg / cell. Furthermore, total carbohydrate content and the highest percentage in the mixed culture Phaeodactylum sp. and Chlorella sp. were found in treatment of 30 ppm and 6 ppm, amount of 289.93 mg / L and 40.45%, respectively. Thus the mixed culture was prospective as bioethanol feed stock.
KEYWORDS: mixed culture; Phaeodactylum sp.; Chlorella sp.; carbohydrate; bioethanol
Download this article as:| Copy the following to cite this article: Suyono E. A, Nopitasari S, Zusron M, Khoirunnisa P, Islami D. A, Prabeswara C. B. Effect of Silica on Carbohydrate Content of Mixed Culture Phaeodactylum sp. and Chlorella sp. Biosci Biotech Res Asia 2016;13(1) |
| Copy the following to cite this URL: Suyono E. A, Nopitasari S, Zusron M, Khoirunnisa P, Islami D. A, Prabeswara C. B. Effect of Silica on Carbohydrate Content of Mixed Culture Phaeodactylum sp. and Chlorella sp. Biosci Biotech Res Asia 2016;13(1). Available from: https://www.biotech-asia.org/?p=6659 |
Introduction
Indonesia is currently experiencing a crisis of national energy security aspects, especially fuel oil (BBM) is evidenced by oil production in 2009 only reached 981 thousand barrels per day1. Microalgae can be used as a source of biomass for biofuels2, due to the characteristics of rapid growth, the capacity of fixation of CO2 are higher than land plants and the absence of lignin so that the process of saccharification can be carried easily3. One of biofuels are being developed such as bioethanol and biodiesel. Bioethanol from microalgae produced through the fermentation process. Ethanol from microalgae polysaccharides hydrolyzed into sugars fermentation4. Microalgae biomass is a source of carbo hydrates. Through the process of fermentation, carbohydrates can be processed into ethanol5.
Mixed cultures or consortium derived from several types of microalgae and bacteria is potentially able to optimize the growth of culture6. This is achieved by the symbiotic relationship of the various niches that exist in the consortium. By using the mixed culture of the selected local strains, the previous research has showed that cells microalgae could grow faster and had high biomass yield because the cells were capable for utilizing organic carbon sources optimally7. Microalgae have klorofill a and b are helped to obtain energy through photosynthesis process that can produce carbohydrates. The use of mixed cultures or consortium derived from several types of microalgae potentially able to optimize the growth of culture6.
Growth and composition of microalgae cells affected by strain and environmental conditions, including light, temperature, pH and nutrients8, 9, 10, 11. Nutrients are used for the growth of one of silica, other than that used to form frustule on diatoms 12, 13, 14. Silica is important for growth and the formation of pectin include carbohydrate compounds9. This study aimed to determine the effect of silica on growth, dry weight, and carbohydrate content generated from mixed cultures Phaeodactylum sp. and Chlorella sp. But until now, there are still many obstacles faced to gain and carbohydrate biomass from microalgae adequate as bioethanol. To increase the production of microalgae biomass, it is often done by developing potential strains in the form of a single culture (monoculture), which has a rapid growth and carbohydrate content and high lipids8.
Materials and Methods
Materials used in this study is a mixed cell culture comprising the cell diatom Phaeodactylum sp. and Chlorella sp., sea water, distilled water, filter paper, 90% acetone, chlorine for sterilization, used thiosulfate to neutralize chlorine, phenol 5%, concentrated H2SO4, acetic acid 1% and 0.06%, 6% NaOH, alcohol 70%, buffer pH 4.0, 7.0, and 9:21, 1 M HCl and KOH 1 M; medium constituent chemical composition, macronutrient: NaNO3 (79 g / L), NaH2PO4.2H2O (5.65 g / L); Trace metal solution: FeCl.6H2O (3.15 g / L), Na2EDTA.2H2O (4.36 g / L), CuSO4.5H2O (0,01g / L), Na2MoO4.2H2O (0.006 g / L), ZnSO4 .7H2O (0.022 g / L), CoCl2.4H2O (0.01 g / L), MnCl2.4H2O (0.18 g / L), and SiO2 (30 g / L); Vitamins: Cyanocobalamin / Vitamin B12 (0.001 g / L), HCl Thiamine / Vitamin B1 (0.001 g / L), and Biotin (0.01 g / L). Citric acid is used to adjust the pH of the medium. Nile Red (SIGMA) and DMSO is used for lipid staining.
Manufacture of medium and stock culture
Medium Formulation f/2 + Si16. Stock macronutrient, EDTA alkaline solution, iron stock, and stock micronutrients sterilized using an autoclave at a temperature of 121⁰C for 15 minutes17. Stock vitamin sterilized using a Millipore Filter. Overall reconstituted stock solution by using distilled water. Counting the number of cells in mixed cultures were used to determine the density of the culture. After the cell count reaches 104 cells 20x assumed cultured cells Phaeodactylum sp. and Chlorella sp., have the same number, then the culture and then in the sub-culture. A medium that has been prepared is then divided into 350 mL bottle was then added 100 mL. Further bottles were aerated with a hose connected to the aerator and closed cotton. Cultivation using medium F / 2 + silica in liquid form taken 1 ml of liquid silica solution with a concentration of 30 mg / L.
Counting of cells
Cell counting is done every day by taking a 0.9 mL sample of the culture using a micropipette. The sample is added with 70% alcohol as much as 0.1 mL as a fixative and mixed homogeneously. The number of cells calculated using Haemacytometer Nebauer 1 mm in light microscope which has been installed OPTILAB. The number of cells counted in the fifth chamber.
Dry weight biomass and productivity
Dry weight of samples taken on days 0, 7, 14 and 21 as much as 2 mL for laboratory scale. Samples are concentrated in 2 ml conical tube that has been dried and weighed. Samples were then centrifuged at a speed of 3300 rpm for 10 minutes and the supernatant was discarded. Then washing with distilled water sample is centrifuged at a speed of 3300 rpm for 10 minutes and the remaining water is dumped. The sample was then dried in an incubator at a temperature of 40⁰C until the sample weight is stable.
Counting carbohydrate content
The method used in measuring the carbohydrate content is phenol-sulfuric method that samples were taken on days 0, 7, 14 and 21, as many as 10 ml then put in 15 mL conical tube, then centrifuged at a speed of 3300 rpm for 15 min, the supernatant was discarded then washed with distilled water. Samples in centrifugation back with a speed of 3300 rpm for 10 minutes. Pellets added 0.5 mL of 5% phenol and 1 mL of H2SO4 and incubated 30 minutes. Samples were taken 2 mL were transferred into a spectrophotometer cuvette is then inserted and calculated absorbance and concentration at a wavelength of 490 nm18. Manufacture of blank solution of 0.5 mL of distilled water + 0.5 mL of phenol 5% + 1 mL H2SO4. Manufacture of standard glucose solution prepared at a concentration of 0.025 g / L, 0.05 g / L, 0.1 g / L, 0.25 g / L and 0.5 g / L.
Data analysis
Data cell count, lipid content, and the biomass created histograms and compared from the first day until the 21st day. Furthermore, the Analysis of Variance (ANOVA) and Duncan’s Multiple Range Test (DMRT) with IBM SPSS Statistics 20 to determine differences in dry weight, lipid content, and mixed culture Phaeodactylum sp. and Chlorella sp.
Results and Discussion
Cell growth is one of the parameters for measuring biomass in cultures of microalgae. Cell growth can be seen from the increase in cell number. Knowing the life cycle and these phases in microalgae, will maximize productivity.
In this study, using the media F / 2 + Si. The treatment with the addition of nutrients, among others 6 ppm silica (silica limit), 10 ppm, 30 ppm (control), 50 ppm, 70 ppm and 90 ppm (silica excess). Silica is a micronutrient that helps growth frustule bersilikon phytoplankton, especially diatoms12,13,14. Various studies on silicate waters and experimental bioassay enrichment of nutrients concluded that the elements Si be a limiting factor and regulating the growth of phytoplankton in coastal waters and the sea, including in the estuaries 19,20,21,22, although that role is determined by the mass balance of the elements nutrients other major namely Nitrogen (N) and phosphate (P)23.
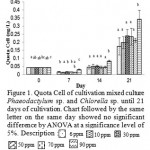 |
Figure 1: Quota Cell of cultivation mixed culture Phaeodactylum sp. and Chlorella sp. until 21 days of cultivation. Chart followed by the same letter on the same day showed no significant difference by ANOVA at a significance level of 5%. Description : |
To determine the change in metabolism that occur in mixed cultures Phaeodactylum sp. and Chlorella sp. during cultivation, an analysis of the quota cells (Figure 1). The highest cell quota is on day 21 by treatment with 90 ppm Si (Si excess) of 0.341667×10⁻⁶ (ng / cell) and the lowest in the treatment of 0.174269×10⁻⁶ Si 6 ppm (ng / cell) (Figure 1). On the 7th day quota cell biomass is lower than the H-0 This suggests a different strategy in optimization of photosynthesis. In the light penetration optimal conditions, microalgae choose to increase the number of cells so that each cell is able to obtain the maximum light to photosynthesize. In this study on day-7 cell biomass lower quota in because the cells were active in cell division. Meanwhile, on the 21st day cell quota has increased but the number of cells is reduced. Mutualistic relationships between species causing these species mutual support its growth, by producing compounds that can be used other species to support cell growth24.
The dry weight of the mixed culture microalgae Phaeodactylum sp. and Chlorella sp. influenced by the number of cells counted. Cells form large and dense cell contents on the species Phaeodactylum sp., Make the dry weight of the cells to be great, especially on day 7 while Chlorella sp. Small cell shape but much during and after the log phase. Phaeodactylum sp. Bohlin has long been regarded as a representative of a diatom model, but the uncertainty about its life cycle25. This is due to pleiomorphism with three basic morphotypes: triradiate, fusiform and oval. In liquid medium, the cells triradiate gradually convert into fusiform morphotype, passing through an intermediate form. Triradiate morphotype even claimed as teratological, without a clear ecological, and ignored in many research trials. So it is assumed the shape pleiomorphism microalgae Phaeodactylum sp. then chances are the contents of the cell and cell shape affects the dry weight. In this study found Phaeodactylum sp. in the form of oval and fusiform.
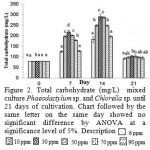 |
Figure 2: Total carbohydrate (mg/L) mixed culture Phaeodactylum sp. and Chlorella sp. until 21 days of cultivation. Chart followed by the same letter on the same day showed no significant difference by ANOVA at a significance level of 5%. Description : |
Figure 2 showed that the total carbohydrate content is highest at 30 ppm Si treatment in normal conditions and the lowest total carbohydrates present in Si 6 ppm treatment days 7, 14 and 21. The total carbohydrate content of the highest achieved at day 14 on treatment The 30 ppm. On the 14th day low cell density but a high content of carbohydrates and lipids, the possibility of the silica used to help supply nutrients to prepare the storage product (savings product). While the 7th day of high cell density, content of carbohydrates and lipids is still small, the possibility of silica helps the growth and reproduction of cells and the possible contents of the cell is still small.
Carbohydrates are the main products of photosynthesis reaction. Microalgae produce carbohydrates from the dark reaction of photosynthesis is carbondioxide into carbohydrates reduced by the Calvin cycle by using energy derived by NADPH and ATP15, 26 which will be used as feedstock for ethanol. Ethanol has been reported to produce at least 20% higher energy than the energy used in the production process. In addition, the process of production and combustion of ethanol can reduce 12% of greenhouse gases compared to fossil fuels27.
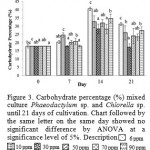 |
Figure 3: Carbohydrate percentage (%) mixed culture Phaeodactylum sp. and Chlorella sp. until 21 days of cultivation. Chart followed by the same letter on the same day showed no significant difference by ANOVA at a significance level of 5%. Description |
Figure 3 shows the total carbohydrate content was highest at 30 ppm Si treatment of 216.9 mg / L and the lowest at 6 ppm Si treatment of 124.49 mg / L. On day 14 in the treatment of 30 ppm Si has the highest total carbohydrate content of 289.93 mg / L. Figure 4 shows the percentage of carbohydrate or carbohydrate content per dry weight, percentage carbohydrate 7th day highest at 10 ppm Si, amounted to 24.53% and the lowest at 30 ppm Si amounted to 17.77% of the total dry weight. Then on day 14 the highest percentage of carbohydrates in Si 6 ppm by 40.45% and the lowest at 30 ppm Si amounted to 28.15% of the total dry weight.
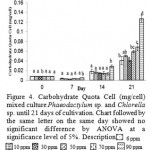 |
Figure 4: Carbohydrate Quota Cell (mg/cell) mixed culture Phaeodactylum sp. and Chlorella sp. until 21 days of cultivation. Chart followed by the same letter on the same day showed no significant difference by ANOVA at a significance level of 5%. Description |
Figure 4 showed that the highest quota of carbohydrate per cell found in Si 90 ppm and treatment of carbohydrate per cell quota lowest for the treatment of Si 30 days to 7, 14 and 21 ppm. Quota carbohydrate per cell highest at 90 ppm Si treatment in a row on day 7,14 and 21 is 0.005119 mg / cell, 0.028864 mg / cell, 0.126514 mg / cell or after conversion 5.118672 mg / cell, 28.86405 pg / cell, 126.5139 mg / cell. While the quota of carbohydrate per cell lows in the treatment Si 30 ppm respectively at day 7, 14 and 21 is 0.002517 mg / cell, 0.014774 mg / cell, 0.03977 mg / cell or after conversion 2.516753 mg / cell, 14.77369 pg / cell , 39.77017 pg / cell. The 90 ppm in treatment have low cell density but high in carbohydrates in the cells the possibility of silica used to help supply nutrients to prepare the storage product (savings product). While on treatment of 30 ppm Si high cell density, the quota of carbohydrates is still small, the possibility of a silica helped growth, cell reproduction and the possibility of doing the cell contents are still few.
Carbohydrates result of photosynthesis is stored in the form of starch, cellulose and hemicellulose. Deposits are then hydrolyzed to glucose and galactose get subsequently fermented to produce ethanol. In addition, some microalgae including Chorella sp. capable of converting carbon-containing substrate into ethanol in the dark. Another method is through the genetic engineering of microalgae to produce ethanol directly into his body28, 29.
There are several environmental factors that affect the production of carbohydrates in microalgae. Light affects the production of carbohydrates and lipids in the cell microalgae. The efficiency of light becomes a major limiting factor in large-scale cultivation and outdoor. High light intensity in the raceway pond causing a high rate of photosynthesis and the availability of N high in the medium causes the protein synthesis to be higher, so that the carbohydrate content in dry weight being low30.
Ethanol produced by fermentation in batch and fed batch using Saccharomyces microbes and can produce high ethanol, about 12-14%. However, the ability of the organism is usually limited because it can only be used a substrate C6 sugars (hexoses). Over the past two decades, efforts to engineer ethanol-producing microbes mesophilic intensively carried out in order to be able to use sugar pentose and hexose. By way of entering and expressing the genes that play a role in the assimilation and metabolism of pentose sugars31.
Excess ethanol compared to gasoline are: (a) bioethanol safely used as fuel, the flash point of ethanol three times higher than gasoline; and (b) hidokarbon fewer emissions. Disadvantages of bioethanol compared to gasoline: (a) a cold engine is more difficult to make a starter; and (b) ethanol reacts with metals such as magnesium and aluminum. As an alternative; used a mixture of bioethanol with petrol. This mixture is known as gasohol32.
Conclusion
It could be concluded that the highest quota of carbohydrate per cell was obtained on Si 90 ppm, accounted for 0.03977 mg / cell. Furthermore, total carbohydrate content and the highest percentage in the mixed culture Phaeodactylum sp. and Chlorella sp. were found in treatment of 30 ppm and 6 ppm, amount of 289.93 mg / L and 40.45%, respectively.
Acknowledgement
All authors would like to sincerely acknowledge to Directorate General of Higher Education, Ministry of Education and Culture, Indonesia for funding this research, Biotechnology Laboratory, Faculty of Biology Universitas Gadjah Mada, for supporting this research.
References
- Bayu, Asep., Biodiesel dari Mikroalga Laut: Potensi dan Tantangan. Journal Oseana, 2010; 35 (1): 15-24.
- Nigam, P.S., Sighn, A., Production of liquid biofuel from renewable resources. Energ. Combust, 2011; 37(1):52-68.
- Harun, R., W. S. Y. Jason, T. Cherrington and M. K. Danquah, Microalgal biomass as a cellulosic fermentation feedstock for bioethanol production. Renewable Sustainable Energy Reviews. Uncorrected Proof, 2010.
- HahnHagerdal,B.,Karhumaa,K.,Fonseca.C.,Spencer-Martine, I.,Gorwa, Grauslund, N.F., Toward industrial pentose- fermenting yeast strain, Microbiol. Biotechnol, 2007; 74:937-953.
- Schenk, P. M., S. R. Thomas-Hall, E. Stephens, U. C. Marx, J. H. Mussgnug, C. Posten, O. Kruse and B. Hankamer, Second generation biofuels: high- efficiency microalgae for biodiesel production, Bioenergy Research., 2008; 1(1): 20-43.
- Kazamia, E., D. C. Aldridge & A. G. Smith, Synthetic ecology – A way forward for sustainable algal biofuel production?. Journal of Biotechnology, 2012; 162: 163-169.
- Friday, E.T, Mixed cultivation of Euglena gracilis and Chlorella sorokiniana: a production method of algae biomass on a large scale, Journal of Applied Biosciences, 2010, 35: 2225-2234.
- Chisti, Y. Biodiesel from microalgae. Biotechnology Advances., 2007; 25: 294-306.
- Kahlil, Y.E.,M.M.S. Asker, El-sayed, I.A.Kobbia.. Effect of ph on growth and biochemical responses of Dunaliella bardawilang Chlorella ellipsoidea, World Jornal of Microbiol. Biotechnol., 2010; 26:1225-1231
- Zhiguo Ju, Lixiao Ding, Qingwu Zheng, Zhigang Wu, and Faxin Zheng. Diatoms as a Model System in Studying Lipid Biosynthesis Regulation. International Journal of Environtmental Science and Development., 2011; 2(6):1-6.
- Suyono, E.A., Aminin, Pradani, L., Mu’avatuna,U.,Habiba,R.N.,Ramdaniya, Rohma, E.F,.Combination of Blue, Red, White and Ultraviolet Light For Increasing Carotenoids and Biomass of Microalga Haematococcus pluvialis, Procedia Environmental Sciences., 2015; 28: 399 – 405.
- Schlesinger, W. H. Biogeochemistry: an analysis of global change. San Diego: Academic Press, 1997; p.588.
- Kennington, K., J.R. Allen, A. Wither, T.M. Shammon, and R.G.Hartnoll. Phytoplantkon and nutrient dynamics in the north-east Irish Sea. Hydrobiologia., 1999; 393:57–67.
- Durr, H. H., M. Meybeck, J. Hartmann, G. G. Laruelle, and V. Roubeix. Global spatial distribution of natural riverine silica inputs to the coastal zone. Biogeosciences, 2011; 8:597-620.
- Taiz, L. and E. Zeiger. Plant Physiology. 3rd Edition.. Sunderland: Sinauer Associates, 2002; pp.116-119.
- Guillard, R. R. L. & Ryther, J. H. Studies of marine planktonic diatoms I. Cyclotella nana Hustedt, and Detonula confervacea (Cleve) Gran. Canadian Journal of Microbiology, 1962; 8: 229-239.
- Andersen, R. A. Algal Culturing Techniques. London: Elsevier Academic Press, 2005; 1: 239-252.
- Dubois, M., J. Gilles, J. Hamilton, P. Rebers and F. Smith. 1956. Colorimetric method for determination of sugars and related substance. Analitycal Chemistry. 28 (3): 350-356.
- Fehling, J., K. Davidson, C.J.S. Bolch, T.D. Brand, and B.E. Narayanaswamy. The relationship between phytoplankton distribution and water column characteristics in North West European Shelf Sea Waters. PLoS ONE, 2012; 7(3): 34-98.
- Wu, J.T. and T.L. Chou. Silicate as the limiting nutrient for phytoplankton in a subtropical eutrophic estuary of Taiwan. Estuarine, Coastal and Shelf Science, 2003; 58:155-162.
- Brzezinski, M.A., R.J. Olson, and S.W. Chisholm. Silicon availability and cell-cycle progression in marine diatoms. Marine Ecology, 1990; 67:83-96.
- Turner, R.E., N. Qureshi, N.N. Rabalais, Q. Dortch, D. Justic , R.F. Shaw, and J. Cope. Fluctuating silicate: nitrate ratios and coastal plankton food webs. Proceedings of the National Academy of Sciences of the USA (PNAS),1998; 95:13048-13051.
- Del Amo Y., Brzezinski M.A, The chemical form of dissolved Si taken up by marine diatoms. Journal of Phycology, 1999; 1(35): 1162-1170.
- Mata, T. M., A. A. Martins and N. S. Caetano. Microalgae for biodiesel production and other applications: a review. Renewable Sustainable Energy Reviews, 2010; 14: 217-232.
- Bartual, A., Villazán, B., & Brun, F. G. Monitoring the long-term stability of pelagic morphotypes in the model diatom Phaeodactylum tricornutum. Diatom Research, 2011; 26(2): 243-253.
- Masojidek, J., M. Kobližek and G. Torzillo. Photosynthesis in Microalgae. In: A. Richmont (ed) Handbook of Microalgal Culture: Biotechnology and Applied Phycology. Oxford: Blackwell Publishing Ltd, 2004; 1: 20–39.
- Hill, J., E. Nelson, D. Tilman, S. Polasky and D. Tiffany, Environmental, Economic, and Energetic Costs and Benefits of Biodiesel and Ethanol Biofuels. Proceeding of The National Academy of Science, 2006; 103: 11206-11210.
- John, R. P., G. S. Anisha, K. M. Nampoothiri and A. Pandey. Micro and macroalgal biomass: a renewable source for bioethanol. Bioresource Technology, 2011; 102: 186–193.
- Suyono, E. A. and E. Albers. Growth optimality and ethanol production from Tetraselmis Isolated from Ancol, Indonesia, Chalmers Expo 2012, Gothenburg, Sweden, 2012.
- Huo, Y.X., K.M.Cho, J.G.L.Rivera, E.Monte, C.R.Shen, Y.J.Yan, J.C.Liao. Conversion of proteins into biofuels by enginering nitrogen flux.Nat. Biotechnol, 2011; 29:346-351.
- Dien, B.S., M.A. Cotta, and T.W. Jeffries, Bacteria Engineered For Fuel Ethanol Production: Current Status, Applied Microbiology Biotechnology, 2003; 63: 258-266.
- Syahruddin, K., M. Sjahrul., Hanapi Usman, Pemanfaatan Medium Ars-chat Pada Produksi Biomassa Fitoplankton Laut yang Potensial Sebagai Bahan Baku Biofuel Jenis Bioetanol. Seminar Nasional FMIPA UNDIKSHA III. F. MIPA Kimia Universitas Hasanuddin. Makasar, 2013; 1: 354-355
(Visited 642 times, 1 visits today)

This work is licensed under a Creative Commons Attribution 4.0 International License.


