

Manuscript accepted on : 09 March 2016
Published online on: 22-03-2016
Arash Ghenaat1 and Adel Johari Moghadam2*
1AJA University of Medical Sciences , Tehran , Iran
2Department of Cardiology , AJA University of Medical Sciences , Tehran , Iran
Corresponding Author Email : adeljoharim@yahoo.com
DOI : http://dx.doi.org/10.13005/bbra/2053

ABSTRACT: Thrombosis is a common disease among communities and considered as one of the main causes of death in developed countries. Because of major role of blood parameters in the creation and development of this disease and methods of bypass graft to treat it, understanding that how the blood function in vessels is important. In this study, a constant flow of blood to the femoral pulse using the assumption of non-Newtonian fluid and rigid-wall vessels with bypass linked with angles of 30, 45 and 60 degrees and the percentage of stenosis 40, 70 and 100% of the simulation. The results showed that the use of bypass in the vessel containing the stenosis, will reduce average shear stress exerted on the main artery and bypass the angle ° 45 is the best performance of the other angles. Also the effect of the magnetic field and gravity as the wall shear stress was investigated. The results show that an increase in Hartmann number can increase average of pressure, also by applying a magnetic field velocity profile to be flatter and increase the velocity gradient increases shear stress near the wall.
KEYWORDS: Thrombosis; Bypass; Femoral vessel; Pulse flow; non-Newtonian; Magnetic field velocity
Download this article as:| Copy the following to cite this article: Ghenaat A, Moghadam A. J. Design and Simulation of Blood Flow to Obtain Optimum Angle and The Effect of Magnetic Fields on Blood Circulation in Femoral Artery Bypass Surgery. Biosci Biotech Res Asia 2016;13(1) |
| Copy the following to cite this URL: Ghenaat A, Moghadam A. J. Design and Simulation of Blood Flow to Obtain Optimum Angle and The Effect of Magnetic Fields on Blood Circulation in Femoral Artery Bypass Surgery. Biosci Biotech Res Asia 2016;13(1). Available from: https://www.biotech-asia.org/?p=7369 |
Introduction
Arterial diseases are the most common causes of death in the world, especially in developed countries. Therefore, understanding the causes and progression of these diseases have a great importance. Atherosclerosis as a specific form of arteriosclerosis is one of the most common arterial diseases which caused by accumulation of cholesterol and other fats in prone area of blood vessels such as two branches and curvy vessels and also where vessels have sudden expansion which can cause cross section reduction of these parts. Coronary, carotid and femoral arteries are important in occurrence of these vascular diseases. Many studies have shown a clear relation between the flow patterns and atherosclerosis tissues. For example, in all the above areas, shear stress and shear stress gradients are low and high respectively.
Bypass surgery is an effective method for the treatment of thrombosis nowadays. Development of intimal hyperplasia caused the failure of this surgery due to various field of flow in veins such as rotation, vortex movements, distribution of shear stress on vessel walls and etc. which are all associated with this phenomenon. Statistical studies in USA (2000) suggested 30-60% failure in bypass grafts in 5-10 years [1] and 15-30% of these failed surgeries will lead to death [2]. Factors involved in the failure of these surgeries include bypass connection techniques, bypass location, poor design of bypass, and etc. Bypass configuration should be chosen to minimize the turbulent flow and numerical simulation techniques are a reasonable way to achieve this goal. Systole and diastole flow blood in the arteries of body and cause fluctuating motion of blood. [3] Various models have been proposed due to simulation of blood velocity in oscillation mode which are divided into two categories. These categories are mathematical simulation of blood oscillating motion and experimental measurements to gain oscillating motion graph. Calculated blood flow speed through mathematical formulas are different with reality. Despite to the difference between oscillating, physiological motion of blood and sine or cosine oscillating motion, using these mathematical formulas would be useful and important in analytical methods. [4] Experimental measurements of blood fluctuation have been done by various methods such as Doppler ultrasonic and electromagnetic methods which is include electromagnetic flow-meter and Doppler ultrasonic flow-meter.[5]
Experimental and mathematical models of arteries clogging and solving the hemodynamic issues which are associated with thrombosis have been done in both numerical and analytical approaches. Estimating the geometry and shape of thrombosis are the most important part of problem solving in these issues which would be done by experimental measurement methods and averaging and estimating by mathematical functions. [6]
Methods
Geometric model of femoral bypass
In this study, three-dimensional model of femoral artery bypass with rigid wall is considered [7]. Stenosis percent was 40, 70 and 100%. The geometry of the vessel shown in Figure 1 in two dimensions.
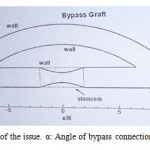 |
Figure 1: The geometry of the issue. α: Angle of bypass connection. β: The main vain angle |
In this model α values are 30, 45 and 60 degrees and β degree was considered 0. Stenosis percentage defines by [(Ai-As)/Ai] which Ai means cross-sectional area of unclogging and As refers to narrowest section of clogging area. In all cases, distance between two connections and length of clogging area were considered 16R and 4R (R: radius of the vessel) respectively. As it shown in figure 1, stenosis is in the center of bypass geometry. The full stenosis was simulated by removing part of the main vessel.
In order to reduce the computing time of flow simulation, disorganized networks were used. Desired geometry was modeling in SolidWorks software and then grid by Gambit software. It is notable that network congestion will be more close to the walls. More network compression also was used at junctions (input and output location of bypass) and stenosis location (contraction surface). An example network used in this study has been shown in figure 2. [8]
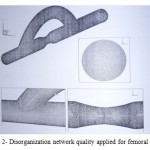 |
Figure 2: Disorganization network quality applied for femoral bypass |
The equations and boundary conditions
Formula 1 shows the equation of vessels in stenosis location.
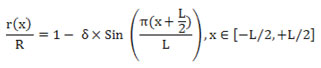
Formula 1- The equation of vessels in stenosis location. L: length of stenosis. δ: Maximum height of stenosis
Vessel diameter was considered 0.0068m as a standard and bypass diameter was considered same as vessel. It should be noted that ideal geometry was used in this study. This is due to incomplete circular cross-section and variable cross-section of real vessels. This simplification suggests that some vessels would have more risk to reclogging than others. [9]
Pulse flow was generated by an equation (Formula 2) with 230 mean Reynolds and a second cardiac cycle which was defined by V. Deplano and M. Siouffi. [10] This equation was selected due to its widespread uses in laboratory and numerical experiments.
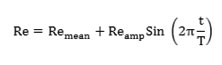
Formula 2- Sinusoidal equation based on Reynolds. Remean: Reynolds average. Reamp: Reynolds range of fluctuation
Non-slip boundary condition was used for the walls. The vessel displacements and strains which are caused by heart fluctuations, were withdrawn. Vessel walls were considered impenetrable as well. Due to changes of speed with time in any moment, a flow diagram (Figure 3) in femoral vessel which indicates the phase changes in blood flow over time was used in oscillating mode. The blood flow was considered quiet and incompressible, pulse steady state (unstable), Newtonian and non-Newtonian. In the case of Newtonian blood viscosity is 0.00345 Pascal. [9] Cross and Carreau-Yasuda models were used to indicate viscosity in the case of non-Newtonian.
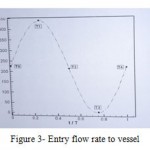 |
Figure 3: Entry flow rate to vessel |
The used equations for continuity and momentum of fluid to analysis and decomposition in the presence of a magnetic field and gravity is shown below (Formula 3).
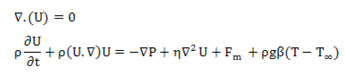
Formula 3- Equations of continuity and momentum of fluid. U: Velocity vector. P: Pressure. ρ: Density. η: Viscosity fluid. g: Acceleration of gravity. β: Volume expansion coefficient
Results
The simulation results will be shown in several sections in which the influence of parameters such as stenosis percent, bypass angle, magnetic field, and pulse flow on the speed, pressure loss, shear stress, backflow and several other effects are examined.
Comparison between the three models
In this section, fluid flow in the center of the main vessel and the average shear stress on their walls were simulated by Newtonian, Cross and Carreau-Yasuda models. A comparison between these three models showed that flow rate in main vessel decreases through the bypass and increases in the obstruction location. Finally, the flow rate will be increased with the addition of fluid from the bypass to the main vessel at the second junction site. Shear stress also increased at the junction site of the bypass and obstruction location. It was also illustrated that Cross and Carreau-Yasuda models are like Newtonian and non-Newtonian models respectively. Carreau-Yasuda model was used for next steps of this study.
Velocity profile
The maximum and minimum values of axial velocity in the main vessel can be seen in the table 1. In all three Reynolds, the maximum velocity was observed in 70% stenosis with 60 degree of bypass angle.
Table 1: Maximum and minimum of axial velocity at Reynolds 125, 250 and 400 (m/s)
| Bypass angle (30˚) | Bypass angle (45˚) | Bypass angle (60˚) | ||||||||
| 125 | 250 | 400 | 125 | 250 | 400 | 125 | 250 | 400 | ||
| 40% stenosis | Max | 0.10795 | 0.20993 | 0.31982 | 0.11131 | 0.21619 | 0.34128 | 0.12073 | 0.23214 | 0.3639 |
| Min | 0 | 0 | -0.0038 | 0 | -0.0015 | -0.0053 | 0 | -0.003 | -0.009 | |
| 70% stenosis | Max | 0.12502 | 0.23546 | 0.35046 | 0.14126 | 0.26151 | 0.38719 | 0.15718 | 0.29092 | 0.4279 |
| Min | 0 | -0.0052 | -0.0209 | -0.0004 | -0.009 | -0.0278 | -0.003 | -0.020 | -0.042 | |
Impact of the bypass on wall shear stress
Figure 4 shows the distribution of shear stress in the bottom wall of the main vessel without and with bypass by 30, 45 and 60 degrees angles for Reynolds 250 and 70% stenosis. According to the figure, due to decrease of blood flow in a vessel with bypass, shear stress is less in comparison of the vessel without bypass. In bypass mode, the flow rate into the main vessel will be more by increasing the bond angle. It is notable that due to this phenomenon shear stress will be increased in this area as well. After stenosis location, a strong vortex flow will be created especially in non-bypass mode which is the main reason of negative shear stress. These events demonstrate the need and importance of bypass surgery.
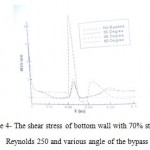 |
Figure 4: The shear stress of bottom wall with 70% stenosis, Reynolds 250 and various angle of the bypass |
Mean of wall shear stress
According to the figure 5, the average of shear stress in 45˚ bypass is lower than two other angles. For example, in Reynolds 400, the shear stress of 60˚ to 45˚ is 4.9%. Due to the increase in shear stress causes damage to the vessel walls, bypass with 45˚ angle can be choose as the optimum angle for these type of surgeries.
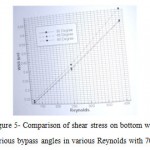 |
Figure 5: Comparison of shear stress on bottom wall between various bypass angles in various Reynolds with 70% stenosis |
Backflow
In Figure 6, different areas of the vessel and bypass marked with numbers. The results illustrated that the vortex flow will be increased at the entrance of the bypass (Area 1) due to more flow rate in main vessel by increasing the bond angle. There is no vortex flow in area 2 in non-bypass mode, but it will be formed in presence of bypass with three angles which are used in this study. Vortices will be formed in onward place by increasing the bond angle. Our results showed the forming place of vertices for 30˚, 45˚, and 60˚ of bond angle will be 0.02705, 0.02388, and 0.02231 m to the entrance of bypass, respectively. The length of vortex in area 2 was 0.01315, 0.01272, and 0.01223 m for bond angles of 30˚, 45˚, and 60˚ respectively which represents the reduction of vortices length by increasing the bond angle in this area.
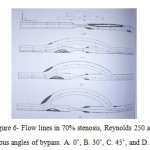 |
Figure 6: Flow lines in 70% stenosis, Reynolds 250 and various angles of bypass. A. 0˚, B. 30˚, C. 45˚, and D. 60˚ |
Magnetic field
The applied magnetics force on blood flow acts as a resisting tensile force which cause slowing of this flow and thus increase the apparent viscosity. In addition, the magnetic field makes boundary layers thicker and increase the velocity gradient near the walls which increase shear stress.
Pulsed flow
When the cardiac cycle fluctuations are taken into account, we are faced with frequent changes of flow that affect other hemodynamic properties. Using three cycles is necessary to remove the influencing factors on blood flow.
The maximum velocity in the center of main vessel is shown in table 2 for Reynolds 230, 45˚ of bypass angle in 70% stenosis. Velocity was measured in various times and three oscillation time (0.2, 0.4, and 0.6)
Table 2: Maximum velocity on central line of stenosis in the main vessel at various time of oscillation
| Oscillation | t1= 2.25s | t2= 2.5s | t3= 2.75s | t4= 3s |
| 0.2 | 0.1725 | 0.1265 | 0.0888 | 0.137 |
| 0.4 | 0.2111 | 0.1195 | 0.0425 | 0.1415 |
| 0.6 | 0.2475 | 0.11 | 0.008 | 0.1473 |
The effect of gravitational acceleration
Results were evaluated in four states considering the gravitational acceleration:
Horizontal vessel (β= 0˚, g= 0 m/s2)
Horizontal vessel (β= 0˚, g= -9.806 m/s2)
Vertical vessel (β= 90˚, g= -9.806 m/s2) – (Blood flow in the opposite direction of gravity)
Vertical vessel (β= 90˚, g= -9.806 m/s2) – (Blood flow in the direction of gravity)
For this examination, the central velocity of main vessel in stenosis location of a vessel with 40% stenosis, Reynolds 125 and 45˚ of bypass angle were measured. Our results indicated that the maximum velocity in stenosis location is 0.11137 m/s for first case and it was 0.1174 m/s in presence of gravity (second case). In the third case, the maximum velocity reached to 0.10614 m/s in upward flow and in forth case the maximum velocity increased to 0.1206 by effect of gravity. The results show the influence and importance of gravity, especially in the third and fourth cases.
Discussion and Conclusion
Arterial diseases are the most common causes of death in the world, especially the developed countries and atherosclerosis is the most common one of these types of diseases. Atherosclerosis causes due to accumulation of cholesterol and fat in vessels and reduce the cross-section. Bypass surgery is the most effective treatment strategy for these patients. Bypass surgery technique and choosing the best location and bond angle for bypass are key points of this strategy. In general, according to the results, it can be said that choosing the bypass location and right bond angle [11] with respect to the other parameters such as blood flow rate [12], shear stress [13], and gravitational acceleration effects [14] have very important impacts on success of bypass surgery. It is notable that non-Newtonian assumption for blood in the vessels has a particular significance and should not ignore. [15]
The results show that increasing the Reynolds number, bypass angle, and stenosis percent increase the maximum and minimum values of velocity and shear stress. [16-18] Rising too quickly of blood flow causing detachment of plaques from the stenosis and send them to veins with smaller diameter which may cause a heart attack. Bypass surgery caused a sharp decline in the average of shear stress. Same to the other results [19], our results indicated that bypass with 45˚ angle has the lowest shear stress in comparison to the 30˚ and 60˚ and from this point of view, this angle would be the best angle for bypass. However, consideration of gravitational acceleration terms can help to improve bypass surgery outcome. When flow is against the gravity, the average of shear stress is more than aligned flow with gravity. On the other hand the backflow will be observed when flow is against the gravity. Hence it can be concluded that bypass surgery is more appropriate for vessels with blood flow in the opposite direction of gravity. [20, 21] In all three domains of the oscillation, the backflow also observed in pulsatile flow of down vessel wall before and after the stenosis site in the maximum flow rate. According to this, the length of vortices will be increased due to amplitude amplification. It is notable that the backflow was not observed in minimum flow rate of 0.2 and 0.4 amplitude. The backflow was observed in upper wall of bypass in all three amplitude with maximum flow rate, but it was formed in 0.2 amplitude of minimum flow rate.
Through extensive research on the dynamics of biological fluid in the presence of a magnetic field it has been found that of blood as a biological fluid as a magnetic behavior. This property are attributed to the intercellular proteins, the cell membrane, and hemoglobin as a form of iron oxide. [22, 23] Thus the magnetic field leads to a reduction in axial velocity of blood. According to the results, the exerted magnetic force on the blood act as a resisting tensile force and normalize the blood flow and also increase the apparent viscosity. In addition, the effect of the magnetic field leads to a reduction in the thickness of the boundary layer, thus shear stress will increase due to increasing the velocity gradient near the walls.
References
- J.P. Ku, C.J. Elkins, C.A. Taylor, Comparison of CFD and MRI flow and velocities in an in vitro large artery bypass graft model. Annals of biomedical engineering 33 (2005) 257-269.
- Y. Fan, Z. Xu, W. Jiang, X. Deng, K. Wang, A. Sun, An S-type bypass can improve the hemodynamics in the bypassed arteries and suppress intimal hyperplasia along the host artery floor. Journal of biomechanics 41 (2008) 2498-2505.
- J. Wen, G. Ding, W. Jiang, Q. Wang, T. Zheng, Numerical Simulation of Compliant Artery Bypass Grafts Using Fluid–Structure Interaction Framework. ASAIO Journal 60 (2014) 533-540.
- S.W. Jordan, M.A. Corriere, C.Y. Vossen, F.R. Rosendaal, E.L. Chaikof, Flow simulated throbin generatio profiles as a predictor of thrombotic risk among pre-menopausal women. Thrombosis and haemostasis 108 (2012) 258-265.
- B. Gholami, A. Comerford, M. Ellero, A multiscale SPH particle model of the near‐wall dynamics of leukocytes in flow. International journal for numerical methods in biomedical engineering 30 (2014) 83-102.
- F. Giordano, W.P. Fox, S. Horton, A first course in mathematical modeling, Cengage Learning, 2013.
- P.W. Longest, C. Kleinstreuer, Particle-hemodynamics modeling of the distal end-to-side femoral bypass: effects of graft caliber and graft-end cut. Medical engineering & physics 25 (2003) 843-858.
- N. Wilson, K. Wang, R.W. Dutton, C. Taylor, A software framework for creating patient specific geometric models from medical imaging data for simulation based medical planning of vascular surgery, Medical Image Computing and Computer-Assisted Intervention–MICCAI 2001, Springer, 2001, pp. 449-456.
- J. Janela, A. Moura, A. Sequeira, A 3D non-Newtonian fluid–structure interaction model for blood flow in arteries. Journal of Computational and Applied Mathematics 234 (2010) 2783-2791.
- V. Deplano, M. Siouffi, Experimental and numerical study of pulsatile flows through stenosis:: Wall shear stress analysis. Journal of biomechanics 32 (1999) 1081-1090.
- M.A. Ikbal, S. Chakravarty, K.K. Wong, J. Mazumdar, P.K. Mandal, Unsteady response of non-Newtonian blood flow through a stenosed artery in magnetic field. Journal of Computational and Applied Mathematics 230 (2009) 243-259.
- E. Zohravi, E. Shirani, M. Sadeghi, Hemodynamic analysis of pulsatile blood flow in a complete bypass graft with different anastomosis angles. Scientia Iranica Transaction B, Mechanical Engineering 22 (2015) 423.
- M.S. El-Kurdi, L. Soletti, A. Nieponice, G. Abuin, C. Gross, S. Rousselle, H. Greisler, J. McGrath, Ovine femoral artery bypass grafting using saphenous vein: a new model. Journal of Surgical Research 193 (2015) 458-469.
- A.A. Owida, H. Do, Y.S. Morsi, Numerical analysis of coronary artery bypass grafts: An over view. Computer methods and programs in biomedicine 108 (2012) 689-705.
- S.F. Sia, Y. Zhang, Y. Qian, K.A.A. Kadir, H.M. Nor, M.K. Morgan, Hemodynamic effects resulting from a common carotid to middle cerebral bypass with varying degrees of proximal internal carotid stenosis. (2014).
- P.M. McGah, D.F. Leotta, K.W. Beach, R.E. Zierler, J.J. Riley, A. Aliseda, Hemodynamic conditions in a failing peripheral artery bypass graft. Journal of vascular surgery 56 (2012) 403-409.
- A. Qiao, Y. Liu, Numerical study of hemodynamics comparison between small and large femoral bypass grafts. Communications in Numerical Methods in Engineering 24 (2008) 1067-1078.
- J. Vimmr, A. Jonášová, Non-Newtonian effects of blood flow in complete coronary and femoral bypasses. Mathematics and Computers in Simulation 80 (2010) 1324-1336.
- E. Van der Zaag, D. Legemate, M. Prins, J. Reekers, M. Jacobs, Angioplasty or bypass for superficial femoral artery disease? A randomised controlled trial. European journal of vascular and endovascular surgery 28 (2004) 132-137.
- S. Giordana, S. Sherwin, J. Peiró, D. Doorly, J. Crane, K. Lee, N. Cheshire, C. Caro, Local and global geometric influence on steady flow in distal anastomoses of peripheral bypass grafts. Journal of biomechanical engineering 127 (2005) 1087-1098.
- J. Kedora, S. Hohmann, W. Garrett, C. Munschaur, B. Theune, D. Gable, Randomized comparison of percutaneous Viabahn stent grafts vs prosthetic femoral-popliteal bypass in the treatment of superficial femoral arterial occlusive disease. Journal of vascular surgery 45 (2007) 10-16.
- P.W. Longest, Computational analyses of transient particle hemodynamics with applications to femoral bypass graft designs. (2003).
- E. Terreno, D.D. Castelli, A. Viale, S. Aime, Challenges for molecular magnetic resonance imaging. Chemical reviews 110 (2010) 3019-3042.

This work is licensed under a Creative Commons Attribution 4.0 International License.


