

Manuscript accepted on :
Published online on: 13-01-2016
Genetic Identification of Kazakhstan Oat Varieties
Myrzan Zh. Nurpeissov1, Aigul I. Abugaliyeva2, Tim Langdon3
1Kazakh National Agrarian University, Almaty, Kazakhstan 2LLP “Kazakh Research Institute of Agriculture and Plant Growing”, Kazakhstan 3Aberystwyth University, Aberystwyth, Ceredigion, United Kingdom
DOI : http://dx.doi.org/10.13005/bbra/1895

ABSTRACT: The present article deals with the study of intracultivar polymorphism of five oat varieties represented by different lines from various types of variety testing and place of growth to confirm the assumption of genetic homogeneity of varieties, using SSR markers (simple sequence repeats). General screening of oat accessions of Kazakh and foreign selections has been conducted to identify the genetic relationships between the varieties and breeding numbers. Eleven genomic and expressed sequence tags (EST)-derived primer pairs were designed and selected according to their high polymorphism. Thus, the use of eleven SSR primers revealed genetic heterogeneity of all five varieties, indicating the presence of intracultivar polymorphism of varieties based on one or two loci out of all investigated microsatellite loci. Cluster analysis of the Kazakh and foreign oat accessions, aimed at detection of the genetic relationships between the varieties, allowed classification of the genotypes into two clusters. In turn, the first cluster was divided into two subclusters with the similarity quotient of 0.77-0.89 and 0.93-0.98, respectively. The first subcluster was comprised of seven varieties and breeding numbers of Kazakh selection including two out of five studied varieties, plus one sample of foreign selection. The second subcluster mainly included varieties and breeding numbers of Kazakh selection including the rest of the studied varieties with very close similarity quotient of 0.93-0.98. The second type of cluster combined varieties and breeding numbers of Kazakh selection and five varieties of foreign selection with the similarity quotient of 0.47-0.93.
KEYWORDS: Avena L; oat; variety; polymorphism; simple sequence repeats (SSR)
Download this article as:| Copy the following to cite this article: Nurpeissov M. ZH, Abugaliyeva A. I, Langdon T. Genetic Identification of Kazakhstan Oat Varieties. Biosci Biotechnol Res Asia 2015;12(3) |
| Copy the following to cite this URL: Nurpeissov M. ZH, Abugaliyeva A. I, Langdon T. Genetic Identification of Kazakhstan Oat Varieties. Biosci Biotechnol Res Asia 2015;12(3). Available from: https://www.biotech-asia.org/?p=3729> |
Introduction
A number of new varieties of cultivated plants are increasing every year and their genotyping requires more sophisticated methods. The most informative type of DNA-markers is the one based on polymorphism of microsatellite genome repeats (SSR-simple sequence repeats). These are simple sequences, which can consist of 4, 3, 2 and even a single nucleotide. The source of their polymorphism is a site, i.e. a specific variation of the repeat length, which in turn is caused by the difference in the number of repeat units. The abundance of microsatellite sequences in eukaryotic genome, their high level of polymorphism, co-dominant inheritance and simplicity of detection by polymerase chain reaction (PCR) and electrophoresis make them high quality markers, convenient for genetic analysis (Morgante, 1993).
From the genetic point of view, oat, compared with other grains, has been studied insufficiently (Loskutov, 2005). Up to now, the genetic study of hexaploid oat was more complex as compared to other crops mainly due to the large size of the genome (Bennett and Smith, 1976), a huge number of linkage groups, and polyploidy, which causes peculiar complexity when identifying multilocus linkage map by one probe due to the migration of fragments from different loci, which can complicate the interpretation of allelic relationships and genetic analyses (Ianucci et al. 2011).
The amplified fragments length polymorphism (AFLP) (Achleitner et al. 2008; Fu et al. 2005; Fu and Williams 2008), the randomly amplified polymorphic DNA (RAPD) (Baohong et al. 2003; Paczos-Grzeda 2004), and the microsatellites were used previously to assess genetic diversity of oat. In particular, microsatellites were used to analyze genetic diversity of Avena spp. (Li et al. 2000, 2007), and to study the changes in allelic diversity in oat breeding for over 100 years in Nordic countries (Nersting et al. 2006), such as Canada (Fu et al., 2007) and Northern Europe (He and Bjornstad, 2012). These SSR markers were also used to study genetic diversity and identification of genplasm of local oat varieties (Avena sativa L) from two collections – “Plant Genetic Resources Centre” (CRF-INIA, Madrid, Spain) and the Andalusian Network of Agriculture Experimentation (RAEA) adapted for the Southern Spain (Montilla-Bascón et al., 2013). Selected SSR markers have shown great potential for studying genetic diversity of oat varieties, as well as demonstrated high resolving power when determining inter- and intracultivar polymorphism in the oat varieties.
It is clear that microsatellite markers are widely used in the study of genetic resources of the Avena L. They are effective in genetic-passportization of germplasm, determining genetic diversity, identifying parental forms, as well as in varietal identification and construction of genetic maps of species belonging to particular genus. This demonstrates a high potential of the use of this type of DNA markers in the solution of various problems in genetics and breeding of the Avena L grain varieties.
SSR markers can be used also in solving topical issues of protection of breeders’ rights to breeding achievements, which are closely related to the varietal and species identification of plants.
This fact served the basis for the active use of SSR markers in genetic studies and varietal identification of the Avena L. Kazakhstan has a domestic oat breeding, including 12 registered varieties of oat, and in this work we tested the applicability of SSR markers for the molecular identification of oat varieties.
Genetic identification of varieties involves the study of genetic polymorphism within the variety. Since oat is self-pollinating cropper, it is assumed that the cultivated varieties are genetically homogeneous. To confirm the assumption of genetic homogeneity of varieties, we studied intracultivar polymorphism of the following oat varieties from: competitive, state variety testing, the collection of Aktobe experimental station (Tsygankov V. I.), and the collection of the Kazakh Research Institute of Agriculture and Plant Growing (KazNIIZiR) (Sariev B.S.).
Materials and Methods
Five oat varieties were selected for studies: Zhorga, Baige, Pegas, Skakun and Alaman. Each variety was represented by different lines from different types of variety testing and places of growth, to avoid errors resulting from mutations. The Zhorga variety was represented by 7 accessions: 6 SVT (state variety testing) lines and 1 accession from Aktyubinsk Agricultural Experimental Station (AES). The Baige variety was represented by 5 accessions: 4 SVT lines and 1 AES accession. The Pegas variety included 4 SVT lines. The Skakun variety included 6 accessions: 2 SVT lines and 4 AES accessions. The Alaman variety was represented by 11 accessions: 9 SVT lines, 1 CVT (competitive variety testing ) accessions, and 1 AES accesions.
The oat seedlings were grown in greenhouses in plastic growth chambers 1х1 sq.m in size. Each pot was filled with soil (peat:sand – 3:1) at a temperature of 200C and a relative humidity of 65%.
Seedlings leaves were cut, and DNA extraction was performed according to the CTAB Protocol (Murray and Thomson, 1980).
Eleven SSR primer pairs derived from genomic and EST libraries of oats and barley were selected according to their high polymorphism.
At the first stage it was necessary to evaluate the possibility of using these markers in the ongoing work, refine the PCR parameters for each marker, and determine the polymorphism of the studied loci in the parental forms. The choice of primers annealing temperature is a key factor for achieving highly specific PCR. If the temperature is too high, the annealing will not occur, while too low temperature will dramatically increase the amount of nonspecific products of PCR reaction.
Thus, 34 cycles of amplification by heating of the reaction mixture for 5 min at a temperature of 95ºC was set for markers. Each cycle consisted of denaturation at a temperature of 95ºC for 0.5 min, followed by primer specific annealing. The best result for HMG F1R1 markers was obtained at the annealing temperature of 600C and annealing time of 0.5 min; for HMGin, HMGsmB – at 560C; for 14279, 10002, 3127F1R1, 13088, and 0075 – at 580C and elongation at a temperature of 720C for 1.5 and 3min, respectively. After completing 34 cycles, the final elongation was carried out for 5, 3 and 10 min at a temperature of 720C and 600C, respectively.
Results and discussion
The study of polymorphism of microsatellite DNA loci of oat was conducted at the Laboratory of Plant Genome and Chromosome Biology of the Aberystwyth University in the UK.
The resulting data on the polymorphism of the studied SSR loci were used for drafting molecular-genetic formulae of KazNIIZiR oat varieties, which were proposed as genetic passports required in determining the authenticity of a given material. Research work to create variety’s genetic passport involves conducting genotyping based on analysis of microsatellite DNA loci of required amount of plant samples of the studied variety. The SSR loci were used for genetic identification of oat samples. Eleven SSR primer pairs derived from genomic and EST libraries of oats and barley were designed and selected according to their high polymorphism. In terms of HMG locus (3 primer pairs), polymorphism was detected by the English scientists only in wild forms of oat. Therefore, the level of intracultivar polymorphism was studied by three loci.
The next stage was the formation of multiplex sets out of tested SSR markers. Used DNA markers were grouped into multiplex sets in accordance with the size of amplified fragments in such a way that each set included SSR markers with non-overlapping size ranges of amplified sequences. This was necessary to prevent overlapping of fluorescence spectra of PCR products when conducting the analysis of their size using capillary electrophoresis. In addition, the annealing temperature of the primers, which were included in multiplex set, was taken into account. Multiplex sets, tested in the course of work, included from two to three SSR markers. This was both due to the possibility to select the combinations of markers with non-overlapping size ranges of amplified fragments, and also due to different amplification “quality” for each of the markers, included in the multiplex set, depending on their combination. Based on the selected multiplex sets, we identified an amplification level sufficient for infallible genotyping.
Analysis findings of three microsatellite DNA loci of the Zhorga variety showed that the cultivar is genetically non-homogeneous. Figure 1 shows the results of electrophoresis of the DNA amplification products obtained at three loci. Each track represents the amplificated DNA fragment of the individual plant. At A locus out of 7 DNA fractions of each individual plant, 5 groups were selected by fraction size (by quantity and size of DNA bands on the track). Thus, the fragment in the first track (Zhorga, Aktobe) differs from the others by the absence of almost half of the DNA bands as compared to other groups, and forms the first group. The second group includes tracks, identical to each other in terms of the availability and the size of bands 2 and 7 (L-41 Zhorga, SVT and L-6 Zhorga, SVT). Also the fragment on the third track (L-36 Zhorga, SVT) can be distinguished by the presence of plurality of bands; it forms the third group. The fourth group includes the tracks 4 and 6, identical with each other (L-11 Zhorga, SVT and L-14 Zhorga, SVT) and having the greatest number of bands. A fragment of the fifth track (L-10 Zhorga, SVT), differing from the others, represents the fifth group. With regard to the C locus all of the tracks are identical to each other, i.e. in terms of these loci, Zhorga variety is characterized as monomorphic, whereas relative to D locus the first plant lacks additional DNA band having just 1 track (Zhorga, Aktobe). Thus, with regard to two microsatellite loci out of three, oat of the Zhorga variety proved to be genetically non-homogeneous. This suggests the existence of intracultivar polymorphism of Zhorga variety at the studied microsatellite loci.
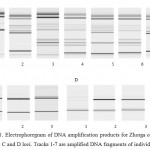 |
Figure 1: Electrophoregram of DNA amplification products for Zhorga oat variety with regard to A, B, C and D loci. Tracks 1-7 are amplified DNA fragments of individual plants |
The analysis findings of microsatellite DNA sequences of the Baige oat variety also showed that the cultivar was genetically non-homogeneous. Out of the 13 samples, the amplified identifying DNA fragments of 3 samples differed from others in size and number of bands (Fig. 2). Two samples were separated by A locus, while one sample was separated by C locus, whereas, the variety was monomorphic with regard to D locus.
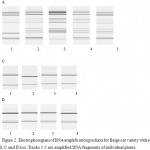 |
Figure 2: Electrophoregram of DNA amplification products for Baige oat variety with regard to A, B, C and D loci. Tracks 1-5 are amplified DNA fragments of individual plants |
The study of 3 microsatellite loci of Pegas variety also revealed that a cultivar was genetically non-homogeneous. This is evidenced by the obtained electrophoregram of DNA amplification products of this variety. As is obvious from Fig. 3, the Pegas variety can be divided into 3 groups at A locus: tracks 1, 2 and 5 are identical, making first group.
The DNA identification fragments at the tracks 3 and 4 differ from the others in size and number of DNA bands, thereby forming the second and third groups, respectively. At that, for the rest two loci all amplification products of DNA identification fragments are identical to each other, indicating that Pegas oat variety is monomorphic with regard to these loci.
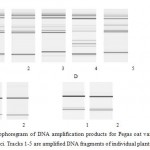 |
Figure 3: Electrophoregram of DNA amplification products for Pegas oat variety with regard to A, C and D loci. Tracks 1-5 are amplified DNA fragments of individual plants |
Figure 4 shows the results of electrophoresis of the Skakun variety amplification products. Analysis of microsatellite DNA sequences of the Skakun variety proves that this cultivar is genetically non-homogeneous. In terms of A locus, out of 6 DNA fractions of each individual plant, the fragments are separated on the tracks 3, 4 and 5. While tracks 3 and 4 are similar in size and number of bands, the track 5 differs from them in a smaller number of bands. With regard to C locus all the DNA fractions of plants are similar, thus the Skakun oat variety regarding to this locus is characterized as monomorphic. With regard to D locus a fragment in the first track differs from the rest by the greatest number of bands.
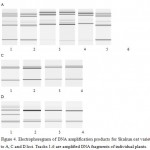 |
Figure 4: Electrophoregram of DNA amplification products for Skakun oat variety with regard to A, C and D loci. Tracks 1-6 are amplified DNA fragments of individual plants |
The research results of SSR loci of Alaman oat variety showed that this cultivar is also genetically non-homogeneous. The Alaman oat turned out to be non-homogeneous with regard to one microsatellite locus out of three (Fig. 5). This is evidenced by the results of electrophoresis of amplification products at three loci – A, C and D. Thus, 5 samples were separated by A locus, whereas with regard to C and D loci the cultivar turned out to be monomorphic.
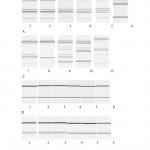 |
Figure 5: Electrophoregram of DNA amplification products for Alaman oat variety with regard to A, C and D loci. Tracks 1-11 are amplified DNA fragments of individual plants |
All varieties in the field differed phenotypically separating vividly by the following traits: leaf blades pubescent on the edges next to the flag leaf and flag leaf inclination both within one plot and in one plant, the plants’ height and length of panicle, the direction and location of panicle branches and location spikelets, and the presence of waxy film on the glumes. It is possible that the intracultivar polymorphism, revealed for represented loci, is associated with these traits. Though, this hypothesis requires additional investigation.
Seeds from selected plants (from one plant) of 5 varieties were sown for further study in the experimental fields of the Institute of Biological, Environmental and Rural Sciences (IBERS) of the Aberystwyth University, the UK, and the Kostanay Agricultural Experimental Station, Kazakhstan. Further, all these selected lines will be studied in more detail in terms of their quantitative and qualitative characters in preliminary variety testing seed-plots.
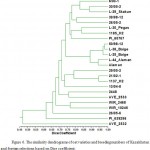 |
Figure 6: The similarity dendrograms of oat varieties and breeding numbers of Kazakhstan and foreign selections based on Dice coefficient |
To identify and determine the degree of genetic relationships between varieties and breeding numbers, a general screening was carried out of the following oat accessions: oats of competitive variety testing, state variety testing, from collection of Aktobe experimental station (Tsygankov V. I.), from collection of the Kazakh Research Institute of Agriculture and Plant Growing (KazNIIZiR) (Sariev B.S.) and foreign selection accessions.
Comparison of varieties to identify similarity measure was performed by cluster analysis method based on Dice coefficient (Fig. 6).
The conducted research allowed identification of two type clusters among the studied varieties. In turn, the varieties and breeding numbers of the first cluster were divided into two subclusters with the similarity quotients equal to 0.77-0.89 and 0.93-0.98, respectively. The first subcluster includes the varieties and breeding numbers of the CT, SVT, Aktobe and ecological variety testing (ESI), as well as one accession of foreign selection. The second subcluster includes the varieties and breeding numbers of the SVT and Aktobe with very close similarity quotients equal to 0.93 – 0.98. Perhaps, this is due to the use of some common source materials.
The second type of cluster combines varieties and breeding numbers of the CT, Aktobe, EVT and five varieties of foreign selection with the similarity quotient equal to 0.47-0.93. When comparing adjoining varieties and breeding numbers pairwise, two breeding numbers from the Aktobe collection differed having very close similarity quotient of 0.93 that is probably also due to the use of related source material when breeding these varieties.
As a result of cluster analysis it can be concluded that the varieties and breeding numbers of Kazakh and foreign breeding materials are genetically closer to each other. Obviously, this is due to the fact that the varieties and breeding numbers of Kazakh and foreign selections have a common origin.
Conclusion
Thus, analysis of microsatellite DNA sequences showed that oat varieties of KazNIIZiR selection can be genetically non-homogeneous. This should be taken into account when developing the variety’s molecular-genetic passport. This, in turn, indicates inconsistency with the requirements on homogeneity and stability of the variety that may be, first of all, due to the certain degree of heterozygosity of the breeding material, which is always present in the material, created by hybridization.
Currently, the country exports grain, seeds, etc., and may remain potentially strong exporter in future. On the eve of accession of Kazakhstan to UPOV (International Union for the Protection of New Varieties of Plants) it is necessary to establish a principled and balanced approach to the issues related to compliance of particular variety to requirements specification. This is necessary for providing legal protection of the International Union. These requirements concern distinctness, uniformity and stability of the certain variety that in itself is already included into the preliminary conditions for entering the cultivar to official list of protected varieties.
Acknowledgements
The authors express their gratitude to Simon Betts for an excellent technical assistance.
References
- Morgante, M., and Olivieri, А.M., 1993, “PCR-Amplified Microsatellites as Markers in Plant Genetics”, Plant Journal, 3, pp.175-182.
- Loskutov, I.G., 2005, “Genetic Collection of Oat”, the Identified Genetic Pool of Plants, All-Union Research Institute of Plant Breeding, St. Petersburg, pp. 773-782.
- Bennett, M.D., and Smith, J.B., 1976, “Nuclear-DNA Amounts in Angiosperms,” Philosophical Transactions of the Royal Society of London, B 274, pp. 227-274.
- Iannucci, A., Codianni, P., and Cattivelli, L., 2011, “Evaluation of Genotype Diversity in Oat Germplasm and Definition of Ideotypes Adapted to the Mediterranean Environment,” International Journal Agronomy, article ID 870925.
- Achleitner, A, Tinker, N.A., Zechner, E., and Buerstmayr, H., 2008, “Genetic Diversity among Oat Varieties of Worldwide Origin and Associations of AFLP Markers with Quantitative Traits,” Theoretical and Applied Genetics, 117(7), pp. 1041–1053.
- Fu, Y.B., Peterson, G.W., Williams, D., Richards, K.W., and Fetch, J.M., 2005, “Patterns of AFLP Variation in a Core Subset of Cultivated Hexaploid Oat Germplasm,” Theoretical and Applied Genetics, 111(3), pp. 530–
- Fu, Y.B., and Williams, D.J., 2008, “AFLP Variation in 25 Avena Species,” Theoretical and Applied Genetics, 117(3), pp. 333–
- Baohong, G., Zhou, X., and Murphy, J.P., 2003, “Genetic Variation within Chinese and Western Cultivated Oat Accessions,” Cereal Research Communications, 31(3–4), pp. 339–
- Paczos-Grzeda, E., 2004, “Pedigree, RAPD and Simplified AFLP-based Assessment,” Euphytica, 138(1), pp.13–
- Li, C.D., Rossnagel, B.G., and Scoles, G.J., 2000, “The Development of Oat Microsatellite Markers and their Use in Identifying Relationships among Avena Species and Oat Varieties,” Theoretical and Applied Genetics, 101, pp.1259–
- Li, R.Z., Wang, S.W., Duan, L.S., Li, Z.H., Christoffers, M.J., and Mengistu, L.W., 2007, “Genetic Diversity of Wild Oat (Avena fatua) Populations from China and the United States,” Weed Science Society America, 55(2), pp. 95–
- Nersting, L.G., Andersen, S.B., von Bothmer, R., Gullord, M., and Jorgensen, R.B., 2006, “Morphological and Molecular Diversity of Nordic Oat through One Hundred Years of Breeding,” Euphytica, 150(3), pp. 327–
- Fu, Y.B., Peterson, G.W., Chong, J., Fetch, T., and Wang, M.L., 2007, “Microsatellite Variation in Avena Sterilis Oat Germplasm,” Theoretical and Applied Genetics, 114, pp. 10229–
- He, X., Bjornstad, A., 2012, “Diversity of North European Oat Analyzed by SSR, AFLP and DArT Markers,” Theoretical and Applied Genetics, 125(1), pp. 57–
- Montilla-Bascón, G., Sánchez-Martín, J., Rispail, N., Rubiales, D., Mur, L., Langdon, T., Griffiths, I., Howarth, C., and Prats, E., 2013, “Genetic Diversity and Population Structure Among Oat Varieties and Landraces,” Plant Molecular Biology Reporter.
- Murray, M.G., and Thompson, W.F., 1980, “Rapid Isolation of High Molecular-Weight Plant DNA,” Nucleic Acids Research, 8(19), pp. 4321–4
(Visited 471 times, 1 visits today)

This work is licensed under a Creative Commons Attribution 4.0 International License.


