

Manuscript accepted on :
Published online on: 15-01-2016
Creation of Database of the Coastal Zone of the Caspian Sea Soil Condition Using GIS Technologies
Samal Syrlybekkyzy1, Gusman Zhardemovich Kenzhetaev2, Farida Kuantkanovna Nurbayev2, Ainur Erbulatovna Zhidebaeva2, Sumbat Elamanovna Koibakova2, Amankul Dzhahankyzy Akbasova3
1Kazakh National Agrarian University Kazakhstan, 050010, Almaty, Abai Street, 8 2Caspian State University named after Sh. Yesenov, 130003, Aktau, 31 microrayon 3International Kazakh-Turkish University named after Yasawi H.A. Kazakhstan, 161200, Turkestan, B. Sattarkhanovа prospect
DOI : http://dx.doi.org/10.13005/bbra/1929

ABSTRACT: The goal of this article is to develop a geospatial database for environmental monitoring of the coastal zone of the Caspian Sea in oil fields areas within the Mangistau region of Kazakhstan with the use of geographic information systems (GIS). To automate data processing, predictive and spatial analysis of field research results, an electronic map of soils conditions of the coastal zone of the Caspian Sea is created in the GIS format with surveys results applied. The programme information-analytical application "Monitoring and Analytics", implemented in a modular type, based on client-server technology, was developed to this electronic map. As a server to store information about the results of the field survey of the area, we selected a database management system (DMS) MS Access, which ensures reliability of the application and adjusts layers of the electronic map.
KEYWORDS: Caspian Sea; coastal soils; GIS; oil field; soil; monitoring; attribute data; database; import of data; Excel; WGS 84 coordinate system; vector; layer; Ms Access; degradation; sampling points; electronic map
Download this article as:| Copy the following to cite this article: Syrlybekkyzy S, Kenzhetaev G. Z, Nurbayev F. K, Zhidebaeva A. E, Koibakova S. E, Akbasova A. D. Creation of Database of the Coastal Zone of the Caspian Sea Soil Condition Using GIS Technologies. Biosci Biotechnol Res Asia 2015;12(3) |
| Copy the following to cite this URL: Syrlybekkyzy S, Kenzhetaev G. Z, Nurbayev F. K, Zhidebaeva A. E, Koibakova S. E, Akbasova A. D. Creation of Database of the Coastal Zone of the Caspian Sea Soil Condition Using GIS Technologies. Biosci Biotechnol Res Asia 2015;12(3). Available from: https://www.biotech-asia.org/?p=4025> |
Introduction
The objective necessity for state environmental monitoring of coastal soils of the North-east Caspian Sea zones in areas of oil companies operation is due to the following main factors:
- increasing anthropogenic pressure on land resources;
- need to allocate anthropogenic changes in a soil condition on the background of natural environmental decision-making.
Soil monitoring is a set of activities such as collection, storage, processing and delivery of large amounts of diverse information for each studied area of oil fields, located in the coastal zone of the Caspian Sea (Law, 2007). The results of the monitoring should include information on the condition of land resources of the studied areas, necessary for management decision-making in the sphere of land matters (Environmental Requirements, 2005).
Solving these monitoring problems is very difficult without creation of the soils condition database, that is, an automated information system (AIS) of land monitoring. The created AIS should contain all of the above information that will allow virtually adopting and implementing correct environmental decisions.
In this regard, the ever-growing amount of information on the status and use of land makes creation of information support for implementation of state land monitoring especially relevant.
Materials and Methods
The main source of factual information – materials of own research on stationary environmental grounds (SEGs) in the coastal zone of the Caspian Sea in the oil fields areas.
Method of soil sampling and laboratory research correspond to the standard practice, which allows preserving continuity of observations and makes it possible to compare data with the results of further studies (Environmental Monitoring, 2010; Production monitoring, 2013; the Sate Standard 17.4.3.01-83, the Sate Standard 17.4.4.02-84; the Sate Standard P 8.589-2001).
We used the basic concepts of the geo-informatics theory and land monitoring, methods of the systematic approach, comparative analysis and modern hardware and software.
Results
Soil along with air and water is the environment of the natural human habitat with which it is directly connected throughout life.
A special place among manifestations of anthropogenic impact, in particular on soil of the coastal zone of the Caspian Sea, belongs to heavy metals pollution, especially in areas of oil fields operation.
Nowadays, the scale and level of impact on the environment during operation of oil fields technological objects are not known accurately.
In this regard, constant monitoring of industrial toxic substances content in coastal soils and their tendency to accumulate is very urgent.
This necessitates scientific substantiation of the level of existing anthropogenic impact and state of the environment components and systematic monitoring with the use of GIS and satellite sensing data (Kenzhetaev, et al., 1986).
In accordance with the work programme approved by the MES Committee of Science of the Republic of Kazakhstan, a field study of the coastal zone of the Caspian Sea at the oil fields of Kalamkas, Arman, Karazhanbas, at stationary environmental grounds (SEGs) was conducted. Monitoring studies included soil studies.
In the autumn of 2014 at 12 stationary environmental grounds (SEGs) field research with soil sampling of the coastal zone of the Caspian Sea in the areas of oil fields operation was conducted in order to determine heavy metals content in soils (Syrlybekkyzy, et al., 2014).
Table 1 shows the coordinates of surveyed stations to create a digital prognostic map. Scheme of monitoring points in the coastal part of the Mangistau region, made in MapInfo Professional 12.0, is shown in Figure 1.
The results of laboratory samples analysis, processed in MUS “Ecological Research Laboratory” of the Department of Natural Resources and Environmental Management of the Mangistau region (DNRandREM) are shown in the following diagrams. To analyse changes in soils heavy metals content, the results obtained in previous periods of observation are presented in the diagrams. For 2012 data is given only for the SEGs, the location of which coincides with the sites, where observation was carried out in 2013-2014. (Kenzhetaev, et al., 2014).
Table 1: Coordinates of stationary environmental grounds (SEG)
| SEG | Oil field | Coordinates | |||
| Longitude | Latitude | ||||
| plan | fact | plan | fact | ||
| 1 | Karazhanbas | 51˚15’41.8032 | 51°16’03,6″ | 45˚8’51.306 | 45°08’56.8″ |
| 2 | Karazhanbas | 51˚16’37.38 | 51°16’32.3″ | 45˚8’49.6608 | 45°08’51.4″ |
| 3 | Karazhanbas | 51˚17’49.2108 | 51°17’48.0″ | 45˚8’49.4772 | 45°08’36.5″ |
| 4 | Karazhanbas | 51˚16’33.204 | 51˚16’35.10 | 45˚7’48.9144 | 45˚7’47.10 |
| 5 | Background | 51˚16’14.6676 | 51˚16’14.7 | 45˚6’25.866 | 45˚06’25.9 |
| 6 | Background | 51˚29’52.5156 | 51°29’43.9″ | 45˚18’24.3396 | 45°18’35.7″ |
| 7 | Background | 51˚41’42.3168 | 51°44’19.1″ | 45˚22’51.1248 | 45°22’39.3″ |
| 8 | Arman | 51˚44’58.5132 | 51°45’11.5″ | 45˚24’43.6176 | 45°24’30.7″ |
| 9 | Arman | 51˚45’22.464 | 51°45’36.1″ | 45˚24’5.5548 | 45°24’01.3″ |
| 10 | Kalamkas | 51˚55’3.0036 | 51°55’35.6″ | 45˚25’0.2784 | 45°25’03.5″ |
| 11 | Kalamkas | 51˚55’3.8712 | 51˚55’17.8 | 45˚23’21.8796 | 45˚23’28.5 |
| 12 | Background | 52˚9’2.5416 | 52˚07’55.6 | 45˚21’27.7524 | 45˚21’59.5 |
Karanzhabas oil field. The results of chemical analysis for heavy metal content of the samples, taken at SEG –1,2,3,4 of the Karazhanbas oil field this autumn, show that only the content of total forms of arsenic exceeds the maximum permissible concentration (MPC).
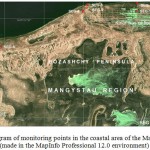 |
Figure 1: Diagram of monitoring points in the coastal area of the Mangistau region |
Average weighted concentration of this element in the 0-20 cm layer this spring changed in the range of 4.32-11.2 mg/kg, which corresponds to 2.4-6.65 MPC. When we considered the content of arsenic in the samples in dynamics (Figure 2) for the entire period of observation from 2012, tendencies demonstrating accumulation of this element in soils were not found. Relatively high arsenic content in soils is not associated with technogenic factors, but it is due to the composition and nature of sedimentary soil-forming material accumulation, that is a provincial feature of this territory.
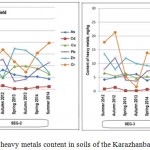 |
Figure 2: Dynamics of heavy metals content in soils of the Karazhanbas oil field (SEG-1,2,3,4) |
This is also confirmed by the fact that the highest concentrations of arsenic are found in soil samples collected in the coastal strip, where the technogenic impact is insignificant. Weighted average barium content in the soil layer 0-20 cm in the autumn of 2014 slightly exceeded Clark only at SEG-1.
At the SEG-2, SEG-3 and SEG-4 barium content was lower than Clark. In 2012-2013 weighted average of the barium content in the 0-20 cm layer often exceeded Clark and reached 1310 mg/kg. The relatively high content of barium in soils of the coastal strip is a widespread phenomenon and is associated with a constant replenishment of soil with hard groundwater, and at the fields it can increase through leaks of formation water. Increase in concentration by autumn is determined by water evaporation from the soil profile on a hot summer and low precipitation.
All other determined ingredients were in the soil at levels well below the MPC or Clark same as in the previous periods of observation. Its weighted average concentration for the entire period of observation changed in different directions. Tendencies of all other ingredients to accumulate in the coastal soils were not found.
Background stationary environmental grounds. In the autumn of 2014 concentrations of heavy metals in soils at background grounds were similar to the concentrations in the spring period and were approximately at the same intervals as at other stationary environmental grounds SEG. Weighted average arsenic content in the 0-20 cm layer at background grounds was 3.93-12.94 mg/kg (1.9-6.5 MPC).
The content of barium ranged from 201.2 mg/kg at the SEG-6 to 685.3 mg/kg at the SEG-5. Other ingredients were in amounts significantly below the permissible values. Dynamics of changes in the concentrations of heavy metals during the whole observation period is shown in Figure 3. As the diagram shows, the content of the determined ingredients for the entire period of observation changed in different directions.
Tendencies showing accumulation of any ingredients in soils were not identified.
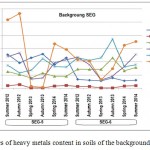 |
Figure 3: Dynamics of heavy metals content in soils of the background grounds (SEG 5-6) |
At SEG-7, SEG-8, SEG-9 of the Arman oil field in the autumn of 2014 only arsenic content exceeded the maximum permissible levels of heavy metals in soils. Weighted average arsenic content in the 0-20 cm layer varied in the range corresponding to the MPC 1.13-1.7 and didn’t exceed the values of the previous observation periods.
Weighted average content of barium in the oil field soil in the autumn of 2014 ranged between 140-143 mg/kg, and didn’t exceed Clarke of this element in soils, and was lower than in the previous observation periods.
The content of other heavy metals in all samples taken at the site of the oil field, as in the autumn of 2014, and in previous observation periods was significantly below permissible levels.
Observations on the content of heavy metals in the oil field soil from 2012 to 2014 did not reveal any tendencies to their accumulation. In the dynamics of heavy metals content during the study period there is a significant variation in the content of elements, both in terms of observation periods and space (according to SEGs) (Figure 4).
The Kalamkas oil field. At the Kalamkas deposit in the spring of 2014 observations were conducted at three sites – SEG-10, SEG-11, SEG-12.
Of all the determined ingredients only arsenic was in concentrations exceeding the permissible value. Weighted average of the arsenic content corresponded to 1.37-2.16 MPC, with the highest concentrations being observed at the SEG-12, which was outside the oil field.
This again suggests that the high content of arsenic is not related to the operation of the oil field, it exceeded the MPC at all the SEGs and the highest concentration of arsenic was observed at SEG-11 (3.6 MPC).
The other determined ingredients at SEG 10 and 12 were in amounts significantly below the permissible values. At SEG 11, located directly on the Kalamkas oil field, on technogenically disturbed lands in the spring of this year, it was observed that the MPC of lead and zinc content exceeded. Autumn concentrations of these elements did not exceed the permissible values.
In the dynamics of heavy metals content in soils of the most remote Kalamkas oil field over the study period at the SEG 10 and 12 there is a significant variation in the content of heavy metals in soils by the observation periods. Tendencies showing accumulation of toxic compounds in soils were not observed (Figure 4).
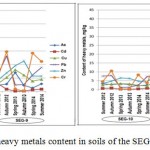 |
Figure 4: Dynamics of heavy metals content in soils of the SEG of Arman and Kalamkas. |
On the basis of attribute data, the electronic map (EM) of the soil condition of the coastal zone of the Caspian Sea in areas of Karazhanbas, Kalamkas and Arman oil fields was created with the research results applied.
EM of the soil condition is created in the GIS MapInfo Professional 12.0 format and is designed to automate data processing, prognostic and spatial analysis of results of the field surveys. Technology of maintaining the electronic map of the soil condition includes stages of field surveys and its post-processing (Tiori, 1985).
At the field phase we had visited the field with the set of measuring equipment, providing soil sampling and latching locations in the SEG areas. The obtained samples were transferred to the MUS “Ecological Research Laboratory” of the Department of Natural Resources and Environmental Management of the Mangistau region (DNRandEM) for analysis. According to the results of the laboratory studies we formed a table of the gridded sampling points.
The programme information-analytical application “Monitoring and Analytics”, implemented in a modular type, based on client-server technology, was developed to this electronic map of the coastal soils condition of the Caspian Sea. As a server, we used the DBMS Microsoft Access, which provides data accumulation of the results of field surveys, reliability of the application and adjustments of the electronic map layers (Lurie, 2002).
For automated data loading the database module has a special function “Import data from Excel file.” With the help of MS Excel, attribute tables to gather information on the main indicators of soil condition were created (heavy metals content in the soils of (HM) for each field (SEG).
The attribute table takes into account:
- hierarchical levels of organization of the system fields (area code + code number of a facility);
- name of the oil field (column B) and database fields – stationary environmental grounds SEG (column C).
As indicators of soil pollution, heavy metal content for each of the SEGs at the oil fields was taken. Database fields of the transformed pivot table contained the following attributes: code number of SEG monitoring points on the territories of oilfields – Kalamkas, Arman, Karazhanbas, N_ID (N_1), content of heavy metals: arsenic As_, cadmium Cd, barium Va_, iron Fe _, nickel Ni _, mercury Hg_, zinc Zn_, lead Pb_, aluminum Al_, silicon Cr_, vanadium V_. This enabled us to adapt tables created in Excel for further binding to the soil pollution electronic map of the fields.
All data, which is stored in the tables, are of two types: numeric and textual. Besides, all of the cells of the table store one value. To exclude data redundancy, the normalization procedure was performed in the created tables to submit data in the fourth normal form (4NF). The normalization procedure is sufficient for real databases, and eliminates logic data redundancy. This means that it is possible to move to the final stage of the design – development of physical models and software analytical applications to the soil condition electronic map of the coastal zone (Koshkarev, 1997).
This step is based on selecting a DBMS, in which physical implementation of the database will occur (DB). We reviewed the most widely used DBMS such as Oracle, IBM DB2, Microsoft SQL Server, Informix and MS Access. (Burrogh, et al., 1998).
Based on the analysis of the previous experience of creating GIS to assess the ecological status of the rapidly developing areas as a software-tool environment for development of a physical model of the database, we selected DBMS MS Access, which has several advantages, namely GIS (WebServer, 2013):
- It is easy to learn how to work with the DBMS.
- No cost for purchasing a separate software-tool kit, as it is included in the standard set of Microsoft Office.
- High reliability of the application.
- A possibility to use the developed database both locally and together with multiple users.
Automated data loading in the database module is performed through a special function “Import data from Excel file”. This enabled us to adapt Excel tables for further binding to the soil pollution electronic map. Then this file was imported into the Ms Access programme, while the key was not created, since it is not recommended.
Working with data from other sources in Access is easy. First, one needs to run the Microsoft Access programme itself. In the Access application in the “External Data” tab in the “Import and binding” group, one needs to select a command for the type of file, which needs to be imported. Click “Excel”. If there is no desired type of programme in the group, click “More options”.
If you cannot find the format type in the “Import” group, you may need to run a programme that created this data, and then save the data in a common format file (for example, in a delimited text file) in the programme before importing the data into Access.
In the dialog box “External Data” click “Browse” to locate the file of the data source, or enter a full path to the data source in the field “File name”. Select the desired parameter in the section “Specify when and where to save the data in the current database” (all programmes allow you to import data, but some programmes also support adding and data binding).
On the last page click “Finish”. When you import objects or during binding tables from an Access database, a dialogue box “Import Objects” or “Link Tables” open. Select the items you want and click “OK”.
The exact sequence of steps depends on the data processing method: import, addition or binding (Arsky, 1992).
If you plan to perform this import operation again later, click “Save import steps” and enter the details.
The MsAccess programme allows you to convert this table to the dbf format for subsequent binding of table data to a shape file of the electronic map of the study area. Binding of tabular data to a shape file is performed by the attribute N_ID (N_1). Then necessary changes are made in the created shape file (Krygier, 2005).
As a result of the studies in 2012-2014, it was found that significant fluctuations in oil content in soils of the studied stationary environmental grounds (SEG) are due to the fact that this type of pollution is of “patchy” nature and during sampling even a slight offset from the sampling point may lead to mismatch between the test results. In this regard, when developing the electronic map, taking this factor into account, at each SEG within a particular oil field in the Caspian Sea coastal area, we provided coordinate thematic layers “sampling points” from the vector map of the corresponding area.
This will determine the areas with the characteristics of “patchy” oil pollution, and fixation of coordinate sampling points and display of these points sequence will provide the desired accuracy of the results of the research analysis (Laykin and others, 2008). In this regard, we perform all the necessary steps to edit attributes of the layer. As for the thematic layer “soil degradation” in the programme MapInfo Professional 12.0 a colour file, corresponding to the content gradation of each of the indicators of heavy metals content according to the monitoring results (Tikunov, et al., 2008).
Discussion
In assessing the heavy metals content and total hydrocarbons in soils, we adopted Maximum Permissible Concentration (MPC) values of pollutants in soils as evaluation criteria (Standards of maximum permissible …., 2004; Ecological requirements …., 2005 and RRD 03.7.0.6.06- 96 Instructions for implementation of …, 1996). It was observed that on all the territory the content of arsenic exceeded the maximum permissible concentrations of elements in soils. The fact that the arsenic content exceeds the maximum permissible concentrations is not due to technogenic soil pollution, but due to natural processes and methodological issues of calculating the MPC. MPC adopted in Kazakhstan, for Arsenic amounts to 2.0 mg/kg (Norms of maximum permissible concentrations …, 2004), which is below its average content in soils.
Therefore, assessment of this element content in soils should be conducted in comparison to its content on the background grounds. At the background grounds the arsenic content also exceeds MPC and is at the same level or even higher than its content on the territory of the oil fields. On this basis, it can be stated that the high content of arsenic is due to natural processes of accumulation and migration of substances and is due to geochemical characteristics of the territory. In soils of the surveyed area an increased content of barium is noted, in some cases it exceeds Clark several times. Increased content of barium can be associated with hard groundwater in the modern coastal plain and with groundwater losses at the oil fields. In 2012-2013 content of total forms of such elements as copper, mercury, lead, cadmium and zinc in soils did not exceed the maximum permissible concentrations in any of the taken samples.
In the spring of 2014 at the SEG-11, which is located directly at the field on disturbed lands, excess of lead content 1.33 MPC and zinc 1.10 MPC was found. In the samples taken in the autumn of 2014 all the determined elements except for arsenic were within the permissible range.
Tendencies to accumulation of heavy metals in soils, according to the results of observations of 2012-2013 at most of SEGs were not identified. Visual observations and laboratory determination of total hydrocarbons content in soils showed inhomogeneous distribution in space. At the wells and other technological objects there are small patches of oil pollution.
At most of the fields and in areas of the background grounds there is no soil pollution by oil. However, at the fields large areas with historic oil pollution were visually identified. Pollution is usually of mosaic character, in small patches in the area of oil fields.
To create and maintain a data bank of the soil condition of the coastal zone of the Caspian Sea in areas of the oil fields Arman, Kalamkas and Karazhanbas it was necessary to pass several successive stages:
- The original stage – creation of an electronic archive of raster file images of the ecological monitoring of the study area.
- Receiving an electronic vectorized map of the study area fields and its division by territories of the oilfields, according to the codes “Instructions … to create a land use data bank (DB) of the Mangistau region of Kazakhstan”.
- Comparison and correction of maps field contours fields of farm boundary adjustment FBA with the modern configuration an electronic vectorized map.
- Filling the data bank by the main indicators of soil condition of the coastal zone of the Caspian Sea for all rounds of the ecological survey on paper.
- Import of the electronic database into the programme module MapInfo Professional 12.0
- Creation of a “sampling points” thematic layer in the areas of SEGs.
- Creating colour layers by the main indicators of soil pollution with heavy metals in all rounds of ecological monitoring of the coastal zone of the Caspian Sea in areas of the oil fields within the Mangistau region of Kazakhstan.
- Creation of an electronic version of a data bank using Excel in MS Access.
Conclusion of the scientific article
Based on the results of the geo-ecological problems research, related to anthropogenic impact of the oil fields activity on soils of the coastal zone of the Caspian Sea within the Mangistau region, the following scientifically substantiated results were obtained (Report on the scientific research, 2014):
- based on the results of ground-based field studies of the coastal zone of the Caspian Sea within the Mangistau region at the oil fields of Kalamkas, Arman, Karazhambas, and the results of laboratory analysis of soil samples, we made tables and diagrams of indicators of gridded sampling points;
- we obtained and arranged the results of ecological monitoring of soil pollution with heavy metals of the coastal zone of the Caspian Sea in areas of the oil fields for the subsequent creation of the database (DB), with import of data into the module “Monitoring and Analytics” from the Excel file;
- we created the GIS format electronic prognostic map of the soil condition of the coastal zone of the Caspian Sea in the oil fields areas by the value of the total index of soil pollution in each of the surveyed stationary environmental grounds (SEG) within the Mangistau region.
As information technologies primarily serve to conserve resources by finding and then using information to improve the efficiency of human activity, the purpose of developing the soils condition database of the coastal zone of the Caspian Sea – concentration of accumulated research, updating existing databases and as a consequence – competent and effective use of funds, assigned for environmental protection. Thanks to information systems, environmental control will be more effective. In this regards, the soils condition electronic map of the coastal zone of the Caspian Sea of oil fields areas was created with all the results of ecological monitoring applied.
References
- Burrogh, P., and McDonnell, R. (1998). Principles of Geographical Information Systems. Oxford University Press.
- Krygier, J., and Wood, D. (2005). Making maps: a visual guide to map design for gis. New York, London: Guilford press, XI.
- Syrlybekkyzy, S., Gusman, Z., Togasheva, A., and Tayzhanova, L. (2014). 17-Year Periods of Rising and Falling Water Levels in the Kazakhstan Section of the Caspian Sea. European Researcher, 69(2), 401-412.
- Arksiy, Y. (1992). Eco-informatics. Theory. Practice. Methods and systems. Edited by Sokolov V. Petersburg: Gidrometeoizdat.
- State Standard 17.4.3.01-83. Nature protection. Soils. General requirements to sampling. (1984). Moscow: Izdatelstvo standartov IPK.
- State Standard 17.4.4.02-84. Soils. Methods of sampling and sample preparation for chemical, bacteriological, helminthological analysis. (1984). Moscow: The USSR State Committee for Standards.
- State Standard Р 8.589-2001. Control of environmental pollution. Metrological support. Main provisions. (2001). Moscow: Standart Inform.
- State environmental monitoring on the shelf and coastal zone of the Caspian Sea with the use of aerospace remote sensing. (2010). Retrieved February 12, 2015.
- Law of the Republic of Kazakhstan “Environmental Code”. (2007, January 15).
- KB Panorama. (2015). Retrieved February 11, 2015, from www.gisinfo.ru/products/gisweb.htm.
- Kenzhetaev, G., Dzhumasheva, K., and Koibakova, S. (1986). Analysis of the effects of oil-producing companies-oil fields on soil pollution in the coastal zone of the Caspian Sea. Proceedings of the international scientific-practical conference “Innovative development of the oil and gas complex”, Part 2, Aktau, 2013, 412-416.
- Kenzhetaev, G., Suleimenova, N., and Syrlybekkyzy, S. (2014). Soil assessment of the coastal zone of the Caspian Sea. Studies, results, Almaty, 4.
- Koshkarev, A. (1997). Geo-informatics. Reference manual. Moscow: Academy.
- Laikin, V., and Uporov, G. (2010). Geo-informatics. Komsomolsk-on-Amur: Publishing house “AmHPSU”.
- Lurie, I. (2002). Basics of geo-informatics and creation of geographic information systems GIS. Moscow: INEX-92.
- Report on the scientific research. Scientific substantiation of a comprehensive study of the environmental components of the coastal zone of the Caspian Sea and technogenic objects. (2014). Astana.
- Industrial monitoring of the environmental components objects AO “Mangystaumunaigas” for 2013. (2013). MUS “Ecological Research Laboratory”. Department of Natural Resources and Environmental Management of the Mangistau region (DNRandEM), Aktau, 146.
- Tikunov, V., Kapralov, E., and Kravtsov, V. (2008). Geo-informatics. Moscow: Academy.
- Tiori, T. (1985). Designing database structures. Text: in 2 books. Translation Tiroi S., Fry J.: English. Moscow: Mir.
- Ecological Requirements in the field of environmental protection and land use. (2005). Astana.
(Visited 266 times, 1 visits today)

This work is licensed under a Creative Commons Attribution 4.0 International License.


