

Manuscript accepted on :
Published online on: 13-01-2016
Assessment of the Ecological Footprint of an Average Household in the Vladimir Region
Karen Oganesovich Karapetyan, and Tatiana Anatolievna Trifonova
1Vladimir State University named after Alexander and Nikolay Stoletovs, 87 Gorky str., Vladimir, Russia, 600000 2Lomonosov Moscow State University 1, Leninskiye Gory str., Moscow, Russia, 119991
DOI : http://dx.doi.org/10.13005/bbra/1972

ABSTRACT: A study for defining ecological footprint of an average household characterizing a detailed profile of materials and energy resources consumption by household members has been made. The direct calculation method with the "Ecological Footprint Calculator" software was used in the work. Peculiarities of ecological footprint distribution by consumption categories, and their load on various types of bioproductive earth surface have been found. The biological capacity of the Vladimir Region has been assessed in detail. The analysis of the Ecological Footprint measurement results showed that out of the six consumption categories analyzed, food and transportation have the greatest share. Although forests cover about 55% of the territory of the Vladimir region, they satisfy only half of the total demand for this type of bioproductive surface. The demand for arable land and infrastructure has been satisfied. A considerable ecological deficiency has been detected in the region, since the obtained ecological footprint value is 5.8 gha/person, which is almost twice the estimated biocapacity of the Vladimir region. The maximum load on ecosystems is the carbon footprint, which amounts to over half of the value of the ecological footprint of the region. In turn, half of the carbon footprint is created by the households using transport.
KEYWORDS: ecological footprint; household; material and energy resources; biocapacity of the territory
Download this article as:| Copy the following to cite this article: Karapetyan K. O, Trifonova T. A. Assessment of the Ecological Footprint of an Average Household in the Vladimir Region. Biosci Biotechnol Res Asia 2015;12(3) |
| Copy the following to cite this URL: Karapetyan K. O, Trifonova T. A. Assessment of the Ecological Footprint of an Average Household in the Vladimir Region. Biosci Biotechnol Res Asia 2015;12(3). Available from: https://www.biotech-asia.org/?p=3799 |
Introduction
The concept of the Ecological Footprint (EF) first appeared in the works of Rees and Wackernagel (Rees, 1992), (Wackernagel and Rees, 1996). Today, the concept of Ecological Footprint is firmly established in the language of modern western literature not only in ecology, but in popular literature and periodicals, as well. EF is considered to be one of the important tools for assessing the progress towards sustainable development (Holmberg et al., 1999).
The Ecological Footprint is a measure of resource consumption expressed as the area of biologically productive land and water area necessary for producing these resources and absorbing resulting wastes (Ewing et al., 2010a).
For calculating the Ecological Footprint, the land and water areas required for producing food, materials and energy, the areas occupied by infrastructure, and the areas required for assimilating produced wastes and CO2 emissions are calculated. It is possible to calculate the EF of a region, an individual country, or the entire planet. This approach makes it possible to correlate the consumption to the “biocapacity” of a region, i.e. the area of biologically productive surface available. The unit of measurement of both the ecological footprint and the biocapacity is “global hectare” (gha), which corresponds to one hectare of biologically productive land or water area that features world-average productivity. For example, if the biocapacity of a country is lower or higher than the measured Ecological Footprint, one can speak about ecological “deficiency” or “excess” of the country, respectively. Due to the fact that the concept of the Ecological Footprint makes it possible to clearly compare the load on nature to its possibilities, the concept of Ecological Footprint gained worldwide recognition so quickly.
Today, Global Footprint Network (GFN) is one of the leaders in developing the tools of the RF concept. This organization performs research and coordinates EF calculation in various countries and regions, publishes national EF indicators for countries of the world, and establishes standards for EF calculation (Global Footprint Network, 2009). In 1970, the environmental footprint of the human race exceeded biocapacity of the Earth, and has increased 50% since then. By 2010, the EF reached 18.1 billion gha, or 2.6 gha per person, while the total biocapacity of the Earth amounted to 12 billion gha, or 1.7 gha per person (WWF, 2014). In other words, the human race’s consumption exceeds the replenishing capacity of the nature by 50%. Thus, EF of the richest countries, such as Kuwait, Qatar, UAE, and USA exceeds 7 gha/person, while in poor countries EF is as low as 1 gha/person and less (Eritrea, Afghanistan, Pakistan, etc.). According to 2009 data, EF of Russia is equal to 4.0 gha/person, and its biocapacity is 6.6 gha/ person. (WWF, 2014)
The analysis of Ecological Footprint for smaller systems, such as the provinces or cities, or even a single household or a business structure, makes it possible to assess sustainability of these systems, and the strategy of their further development (Wilson and Anielski, 2005). EF of many provinces and cities of the world, such as Calgary, San Francisco, Ontario, Quito, etc., has been assessed with participation of GFN and local authorities (Global Footprint Network, 2014).
Such studies are often difficult, due to incompatibility between the local systems of statistical accounting management at enterprises, in cities and regions, and the methods of calculating the national EF (Ewing et al., 2010). This is one of the main difficulties in studying the regional EF in Russia. However, the authors of several Russian publications on this topic note the importance of regional EF measuring, since the rich natural resources of Russia are distributed across the country in a highly uneven manner (the World Wildlife Fund (WWF), 2014). Out of the 83 subjects of the Russian Federation, only 32 have environmental “surplus”, i.e., their biocapacity exceeds the EF (ibid., p. 48-50). EF study makes it possible to compare individual regions from the point of view of depleting the mineral and natural resources (Belik et al., 2013).
This work is aimed at measuring the Ecological Footprint of an average household in the Vladimir Region, estimating biocapacity of the region on the basis of direct accounting for bioproductive areas in the region, and at comparative analysis of the environmental “deficit” or “excess”.
Objects and Methods of Research
The study was focused on the average household in the Vladimir Region. The Vladimir Region occupies 2,908.4 thousand ha, including 1,670 thousand ha covered with forests, 990.9 thousand ha – agricultural land, 207.1 thousand ha – settlements, and 10.9 thousand ha – water fund lands (The Department of Natural Resources and Environmental Protection of the Administration of the Vladimir Region, 2013). The population of the region is 1,442 thousand people, with 78% living in cities. The average population income per capita in 2013 was 18,796 rubles per month. (The Federal State Statistics Service for the Vladimir Region, 2014).
The following approaches and methods were used.
Ecological Footprint Analysis
The Ecological Footprint Analysis is a method of converting the material and energy resources consumed by the man into relevant areas of biologically productive surface of the Earth (Ecological Footprint) required for providing this level of consumption. This concept uses the following classification of types of planet’s biologically productive surface.
- Cropland. These are the most fertile lands where the greatest amount of biomass can grow. It is widely accepted that these lands are 2.8 times more productive than the worlds’ average biologically productive land (Chambers et al., 2000). These are the most valuable lands for food production, since they are used for growing crops.
- Pastures. It is accepted that their average productivity is only 40% of the world’s average productivity.
- Forests. This category includes natural forests and plantations. Despite a number of important inherent functions and environmental services of forests, such as climate regulation, erosion prevention and preservation of biodiversity, they are mainly valued as the source of timber. Productivity of this type of land is 20% above the world’s average productivity.
- Fishing areas. This fishing area covers only the coastal part of the ocean areas within 300 km from the coast, since 90% of the total commercial fishing occurs only in this area, which is considered the most productive. It consists of 2,900 million ha, or 8% of the total area of the ocean.
- Built-up lands. The lands occupied by settlements and their infrastructure, such as buildings, roads, etc. As a rule, these lands historically belonged to the most productive, arable type.
- The Carbon Footprint. This is the area of forests required to absorb CO2 released in course of burning fossil fuels. It includes only a portion of CO2 not absorbed by oceans (Ewing et al., 2010a). It is assumed that CO2 can be absorbed by trees growing in a specially designated area. This category is assigned the same productivity as forests (Chambers et al., 2000).
EF calculation
The ES calculation itself is determined by the main formula
EF= P/Y, (1)
where P is the annual Production of a product, and Y is the Yield of this product (Ewing et al., 2010a). Thus, in order to compare EF for all types of land cover for various countries and regions, the results should be converted into global hectares, i.e., reduced to the world’s average yield of a particular crop or resource, based on bioproductivity of the surface. To do so, the following coefficients are introduced:
PF – productivity factor
i.e., the ratio between the productivity (yield) of a particular resource or an agricultural crop in the country in question to its world’s average productivity. PF are different for different countries, and fluctuate from year to year. For example, according to GFN, arable lands in Germany are over 2 times more productive than the world’s average value, their PF in 2010 was 2.2 ((Ewing et al., 2010), pp. 6).
EqF, the equivalence factor
i.e., the ratio of productivity of one averaged hectare of Earth’s surface of a specific type to the productivity of one averaged hectare of Earth’s surface as a whole. In 2010, GFN adopted the following EqF values for various types of the surface (Table 1):
Table 1: Equivalence Factors for various types of bioproductive surface (Ewing et al., 2010), pp. 8).
| Type of bioproductive surface of the Earth | EqF |
| Cropland | 2.51 |
| Pastures | 0.46 |
| Forests | 1.26 |
| Fishing areas | 0.37 |
| Built-up lands | 2.51 |
Thus, formula (1) takes the following form:
EF= (P/Y)*PF*EqF (2)
It should be noted that most often EF means the value of materials and energy resources consumption per capita, expressed in gha. There are production EFprod and consumption EFcons, which are related by the following formula:
EFcons = EFprod + EFimp-EFexp, (3)
where EFimp and EFexp are ecological footprints of import and export, respectively.
Methods of EF Calculation
Traditionally, there are two methods of calculating EF: compound and component-based (Chambers et al., 2000). Some authors define a third method as well, the Direct one (Xu and San Martin, 2010). These methods differ in data sources.
In this study, the Direct Calculation method was used.
The Direct Calculation method. EF Calculator
The data obtained directly from the source of consumption are used. This method is often used to calculate EF of organizations, households or individual consumers. This approach was implemented in this work with the use of the “Household Ecological Footprint Calculator” software product (Wackernagel, 1997), which makes it possible to calculate individual households’ ecological footprint per one person. It is a spreadsheet containing about 80 questions divided into six categories of household consumption: food, housing, transportation, goods and services, and wastes. The program presents the results in units of area, hectares or acres, depending on the system of measures chosen. This software product also provides ecological footprint detailed distribution in each consumption category by various types of bioproductive surfaces. The method of EF calculation incorporated into the program uses conversion coefficients based on the average yield in the world, which makes comparable the results obtained for different countries. For example, this program was used for calculating EF of an ecovillage and urban households in southern Sweden (Haraldsson and Sverdrup, 2001).
The method of using statistical data
To calculate EF of a household using the EF Calculator, consumption of food, nonfoods, services, and material and energy resources by the members of this household was analyzed in detail. Using statistical data (The Federal State Statistics Service for the Vladimir region, 2011a); the “consumer profile” of region’s average household was formed with regard to all 80 consumption items in the EF Calculator. These data were grouped and summarized according to the six sections in the EF calculator table: food, housing, transportation, goods, services and wastes. It should be noted that except for the data about consumption of food, housing services, and some other services, consumption of goods is accounted for in Russia mainly in monetary units, rather than in physical ones. Cash expenditure were converted into physical units by using the average prices for goods and services (The Federal State Statistics Service for the Vladimir region, 2011b), and the average weight of the purchased products. Information sources were the statistical materials on the Vladimir region, and the average values of the analyzed indicators for the Central region of Russia and Russia in general, as well as the Internet resources, were considered as well. The thus obtained “complete” averaged household consumption data set was processed in the “EF Calculator”. In addition to EF value in gha, the program calculates the share of each of the 6 consumption categories in absolute and relative units, as well as its distribution by various types of the bioproductive surface.
Calculation of biocapacity
The following provisions were used for assessing biocapacity of the Vladimir Region. Biocapacity (BC) of the region is the area of potentially available biologically productive lands and water areas within the region. Biocapacity is measured in global hectares per person. The classification of Earth’s surface and productivity factors described above were used for calculating EF.
For each type of bioproductive surface, biocapacity (BC) is calculated according to the following formula (Ewing et al., 2010):
BC = A*PF*EqF, (4)
where A is the area of available productive surface of the certain type in hectares. Thus, using this formula, the area of tillable lands, pastures, forests, water areas and cities are converted into universal units (gha), taking into account the type of Earth’s surface and its productivity. So, biocapacity of the area of high-yielding Cropland in a favorable climatic zone, expressed in gha, will exceed its physical size in ha.
Results
Results of EF calculation
Processing statistical data resulted in obtaining data about consumption of food, goods, transportation costs and services by the household in the Vladimir region. 80 consumption categories were detected, which were grouped into 6 groups: food, housing, transportation, goods, services and wastes. In particular, the Food group included: 1) Vegetables and fruits, 2) Bread and bakery products, 3) Flour, pasta, rice, cereals, 4) Maize, 5) Legumes, … – 22 categories in total. The Transportation group included the use of a personal automobile, motorcycle, various modes of public transportation, including buses, trams, planes and trains – 12 indicators in total. The Goods group includes 18 categories, including the consumption of clothing made of cotton, wool, synthetic fabrics, wooden items, etc. The Housing group contains information about the size of the property, consumption of electricity, natural gas, etc. Expenses, such as buying clothes, which in the statistics are accounted for in quantitative terms, were converted into physical units. The thus prepared data were processed using the “Household Ecological Footprint Calculator” software program.
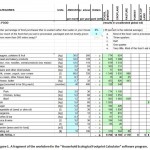 |
Figure 1: A fragment of the worksheet in the “Household Ecological Footprint Calculator” software program. |
Figure 1 shows the worksheet of the “Household Ecological Footprint Calculator” software program (Wackernagel, 1997). It shows the part of the spreadsheet devoted to the calculation of the first of the six consumption groups, namely, “Food.” The weight of each type of food consumed per month is converted into the corresponding share of EF in 4 categories of the bioproductive area: the Carbon Footprint (Fossil Energy), Croplands, Pastures and Fisheries (Figure 1).
Table 2 shows the final results of EF calculation, its distribution by consumption categories (rows) and the areas of bioproductive land and water occupied by them, respectively (columns). The total EF value of an averaged household in the Vladimir Region is 5.8 ha (Table 2).
Table 2: EF calculation for a household
| The Ecological Footprint per a household member | |||||||||
| Categories | Carbon Footprint. | Cropland | Pastures | Forests | Built-up lands | Fishing areas | Total | Total | |
| consumption | m2 | m2 | m2 | m2 | m2 | m2 | m2 | gha | % |
| Food | 1,905 | 7,447 | 1,239 | 0 | 0 | 8,151 | 18,742 | 1.87 | 32% |
| Housing | 2,637 | 0 | 0 | 5,681 | 569 | 0 | 8,887 | 0.89 | 15% |
| Transportation | 14,318 | 0 | 0 | 0 | 691 | 0 | 15,009 | 1.50 | 26% |
| Goods | 5,102 | 391 | 63 | 951 | 76 | 0 | 6,583 | 0.66 | 11% |
| Services | 2,456 | 0 | 0 | 191 | 79 | 0 | 2,726 | 0.27 | 5% |
| Wastes | 3,831 | 0 | 0 | 2,126 | 57 | 0 | 6,015 | 0.60 | 10% |
| Total | 30,249 | 7,838 | 1,302 | 8,949 | 1,472 | 8,151 | 57,961 | 5.80 | 100% |
| Total (gha) | 3.02 | 0.78 | 0.13 | 0.89 | 0.15 | 0.82 | 5.80 | 5.80 | |
| Total (%) | 52% | 14% | 2% | 15% | 3% | 14% | 100% | ||
Biocapacity assessment for the Vladimir Region
The results of the biocapacity calculation for the Vladimir Region are shown in Table 3.
Table 3: Biocapacity assessment for the Vladimir Region
| Type | Area (thousand ha) | EqF | PF | Total (thousand gha) | Total/person (gha) |
| Cropland | 652.7 | 2.51 | 0.84 | 1,376.15 | 0.95 |
| Pastures | 323.1 | 0.46 | 0.84 | 124.85 | 0.09 |
| Forests | 1,670 | 1.26 | 1.38 | 2,903.80 | 2.01 |
| Fishing areas | 10.9 | 0.37 | 0.84 | 3.39 | 0.00 |
| Built-up lands | 320 | 2.51 | 0.84 | 674.69 | 0.47 |
| Total | 5,082.87 | 3.52 | |||
| Total per capita(gha) | 3.52 |
Let us explain some details of calculation on the example of two categories: Cropland and Forests.
Cropland
The area of tilled and fallow lands in the Vladimir Region is 652.7 thousand ha. (The Department of Natural Resources Management and Environmental Protection of the Administration of the Vladimir Region, 2013). In order to assess PF for Cropland, let us compare the average grains yield in the Vladimir Region to the world’s average values. In 2009, the yield of spring wheat in the Vladimir Region was 24.5 kg/ha (The Federal State Statistics Service for the Vladimir region, 2014), with the total harvest being 69.1 thousand tons. The yield of winter wheat amounted to 25.6 thousand tons, with the productivity being 24.5 t/ha. Thus, the weighted average yield of wheat in the Vladimir Region in 2009 was equal to 25.6 Cwt/ha. The world’s average yield of wheat in 2009 was estimated at 30.6 Cwt/ha (FAOSTAT, 2014), (Worldbank, 2014), therefore, for the Cropland in the Vladimir Region, the productivity factor PFp= 25.6/30.6=0.84.
According to Table 1, the Equivalence Factor for Cropland PF=2.51. Therefore, according to Formula 4, the Cropland biocapacity is calculated.
BOp=652.7*0.84*2.51=1376.2 thousand gha.
Forests
According to the UN’s Food and Agricultural Organization, the total world’s area of forests is 4,033,060 thousand ha, and the volume of timber is 527 billion m3 (FAO, 2011), i.e., the average stock of timber per 1 ha of forest land is approximately 130 m3. For the Vladimir Region, the average stock per 1 ha of forest land is 179 m3 (The Department of Natural Resources Management and Environmental Protection of the Administration of the Vladimir Region, 2013). Thus, PFf=179/130=1.38
Biocapacity for other types of bioproductive areas is calculated in the similar way. With regard to the total population of the region, the amount of biocapacity per capita is obtained.
Analysis of the results obtained
Considering the results of EF measurements (Fig. 2 and 3), one can notice that the most significant shares are food consumption, i.e., nearly 1/3 of the EF, and transportation, i.e., 1/4 of the EF. It is therefore no surprise that the main load falls to the area of the Carbon Footprint, i.e., the share of Earth’s used biocapacity that is required to absorb CO2 emitted in the process of production and using vesicles, manufacturing, packaging and transportation of food products.
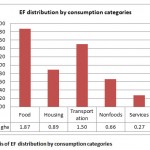 |
Figure 2: Analysis of EF distribution by consumption categories |
Comparing these figures to the biocapacity indicator that is equal to 3.52 gha (Table 3), we can conclude that the Vladimir Region is experiencing ecological deficit of 2.28 gha. The main share of the region’s biocapacity are forests (2.01 gha – Table 3), which is twice the formal demand for timber (category Forests – Figure 3). With that, the main demand for biocapacity is constituted by the carbon footprint, which amounts to over half (52%) of EF, i.e., about 3 gha. This indicator reflects the global trends of natural resources consumption. So, in 2010, the global average carbon footprint amounted to 53% of the total EF of the human race (WWF, 2014).
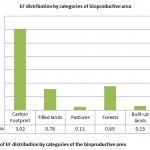 |
Figure 3: Analysis of EF distribution by categories of the bioproductive area |
Analysis of Table 2 shows that half of the carbon footprint is provided by the use of vehicles. Substantial load, about one-sixth of the carbon footprint, is also provided by the consumption of non-food products (Table 2). It should be remembered that carbon footprint is the area of forest required for sequestering CO2, so the real total forest demand in terms of the ecological footprint approaches 4 gha/person (Fig. 4), which twice exceeds the forest resources in the region (Table 3). The only categories of the Earth’s surface, for which the demand is satisfied by the biocapacity of the Vladimir Region are Cropland and Built-up lands (Figure 4 and Table 3).
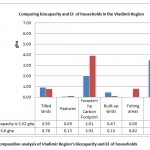 |
Figure 4: Comparative analysis of Vladimir Region’s biocapacity and EF of households |
Discussion
Domestic works on studying regional EFs vary considerably in both the calculation methods and the results obtained. It should be noted that at the dawn of EF research, the authors of the methodology explained that EF is not an accurate model, and that the accuracy of the method is limited mainly by data availability (Chambers, 2000). The choice of a particular method of calculation itself determines the results accuracy. For example, the compound method for calculating EF mentioned in the previous sections has a number of disadvantages when used for local objects, like cities or regions. “Despite the ease of using the compound method for calculating ecological footprint for cities, the method potentially produces erroneous results, since it takes into account only some categories of local consumption data in the city. So, with regard to municipal cargo transportation, it does not consider the use of vehicles by the population during travelling, other modes of transportation – public transportation, air transportation, which can make a significant contribution to the EF” (Xu and San Martin, 2010). So, the WWF report dedicated to EF in the subjects of the Russian Federation (the World Wildlife Fund (WWF), 2014) shows the following values for the Sverdlovsk region: EF=4.57 gha, and BC=2,68 gha. At the same time, I.S. Belik (Belik et al., 2013) assesses EF in the Sverdlovsk region according to the data of 2009 at 16 ha/person, and notes that this value is 3.6 times higher than the biocapacity of the Region (p. 135). The WWF report indicates the following values for the Vladimir region: EF=2.24 gha and BC = 1.37 gha. As we can see, it is about 2 times less than our results. Let us present our observations about possible reasons for results divergence. The use the Gross Product of the Vladimir Region as the main indicator of consumption by the population is itself a source of a significant error, since it is almost impossible to assess the import and the export in the Vladimir Region with sufficient accuracy due to necessary statistical data being missing. That said, despite the discrepancy in the absolute values of EF components, their relative share features similar distribution (Fig. 5). Same as in our study, substantial shares of EF are food and housing. Purchasing food and goods have almost the same EF shares as in our study. The discrepancy in percentage values of transportation-related EF may be caused by the fact that in the WWF’s study, the cost of public transportation was presumably attributed to state services.
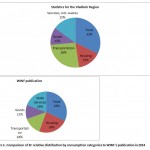 |
Figure 5: Comparison of EF relative distribution by consumption categories to WWF’s publication in 2014 |
Furthermore, the results depend on understanding and interpretation of the EF concept by the authors. So, in the study of the Samara Economic University (Kostin et al., 2014), EF is calculated as the “sum of exploited natural components”, i.e., the components of the region’s biocapacity, and “the anthropogenic load from industry and transportation” (p. 36). This approach rather reflects the anthropogenic load from production, but not from consumption, and their ecological footprints may vary considerably, especially in industrialized regions (see Formula 3). In addition, the anthropogenic load on the components of the planet’s biocapacity that are not represented in a specific region, provided by consumption of imported goods and services, is not taken into account. The EF obtained by the authors is not consistent with the level of income in the regions where the study was performed, although the EF is, by definition, an indicator of consumption of natural resources by the mankind. So, for EF in the Astrakhan Region, the obtained value was 4.9 gha/person, for the Volgograd Region – 6.9 gha/ person, and for the Vladimir Region – 10.4 gha/person (ibid., p. 35). At the same time, the income level of the population of these regions indicates a different level of consumption: the per capita monthly income in the Astrakhan Region is 11,120 rubles, in the Volgograd Region – 10,866 rubles, and in the Vladimir Region – only 9,596 rubles (the 69th score in the Russian Federation) (The Federal State Statistics Service, 2015).
Conclusion
The value of the ecological footprint of an average household in the Vladimir Region according to the statistics of 2011-2014 has been calculated, as well as its distribution by various categories of consumption, and anthropogenic load on the components of the planet’s biologically productive surface area. The EF was calculated by the Direct calculation method with the use of the EF Calculator.
Also, the biocapacity of the Vladimir Region has been assesses. The article revealed a considerable ecological deficit in the region, since the obtained Ecological Footprint value of 5.8 gha/person is almost twice the biocapacity of the Vladimir Region (3,52 gha/person).
Analysis of the results of EF measurement showed that out of the six singled out consumption categories food and transportation have the largest shares. The Carbon Footprint has the maximum load on the ecosystems, which constitutes half of the region’s EF. With that, the value of the Carbon Footprint is halfway the result of intensive use of vehicles by the residents of the region. Although forests cover about 55% of the territory of the Vladimir region, they satisfy only half of the total demand for this type of bioproductive surface. The demand for arable land and infrastructure has been satisfied.
In whole, the method of EF calculation used in the work made it possible to assess the anthropogenic load on the microeconomic scale, i.e., at the level of households. With that, the results of EF measurement were comparable to the results obtained by other domestic authors. Unfortunately, the mentioned works neither describe the methods used for calculating EF, nor show the calculations, therefore it is rather difficult to assess the results themselves, and, moreover, the discrepancy reasons. In future work we plan to examine EF for various types of households in the Vladimir Region, as well as the additional anthropogenic load from countryside real estate of city’s inhabitants.
Acknowledgements
This scientific publication was prepared within the framework of the state assignment to the Vladimir State University No. 37.2108.2014/K for execution of scientific works.
References
- Chambers N., Simmons, C. & Wackernagel, M. (2000). Sharing Nature’s Interest. Ecological Footprints as an Indicator of Sustainability. London: Earthscan.
- Ewing, B., Moore, D., Goldfinger, S., Oursler, A., Reed, A., & Wackernagel, M. (2010a). The Ecological Footprint Atlas 2010. Oakland: Global Footprint Network.
- Ewing, B., Reed, A., Galli, A., Kitzes J., & Wackernagel, M. (2010b).Calculation Methodology for the National Footprint Accounts, 2010 Edition.Oakland: Global Footprint Network.,
- (2014). Wheat World Yield 2009. Retrieved from http://faostat.fao.org/site/567/DesktopDefault.aspx?PageID=567#ancor
- Global Footprint Network (2009). Ecological Footprint Standards 2009. Oakland: Global Footprint Network. Retrieved from footprintstandards.org
- Global Footprint Network. (2014). Local, Regional, and Municipal Applications. Retrieved April, 2015, from http://www.footprintnetwork.org/en/index.php/GFN/page/case_stories/#local
- Haraldsson, H.V., & Sverdrup, H. (2001). Is Eco-living more Sustainable than Conventional Living? Comparing Sustainability Performances between Tow Townships in Southern Sweden. Journal of Environmental Planning and Management, 44(5), 663-679.
- Holmberg, J., Lundqvsit, U., Robert, K-H., & Wackernagel, M. (1999). The Ecological Footprint from a Systems Perspective of Sustainability. International Journal of Sustainable Development and World Ecology, 6, 17-33.
- Rees, W.E. (1992). Ecological Footprint and appropriated carrying capacity: what urban economics leave out. Environment and Urbanization, 4(2), 121-130. http://dx.doi.org/10.1177/095624789200400212
- Wackernagel M., Monfreda, C., Deumling, D., & Dholakia, R. (1997). Household Ecological Footprint Calculator. Retrieved July 2005, from http://www.rprogress.org/newprojects/ecolFoot.shtml
- Wackernagel, M., & Rees, W.E. (1996). Our Ecological Footprint: Reducing Human Impact on the Earth. Gabriola Island, Canada: New Society Publishers.
- Wilson, J., & Anielski, M. (2005). Ecological Footprint of Canadian Municipalities and Regions. Edmonton: Anielski Management Inc.
- (2014). Cereal yield (kg per hectare). Retrieved from http://data.worldbank.org/indicator/AG.YLD.CREL.KG
- (2014). Living Planet Report. Gland: WWF International.
- Xu S., & San Martin, I. (2010). Ecological Footprint for the Twin Cities: Impacts of Consumption in the 7-County Metro Area.College of Design, University of Minnesota.
- Belik, I.S., Starodubets, N.V., & Shutkina, D.N. (2013). Assessing Threats to the Assimilative POTENTIAL. Bulletin of the Urals Federal University, 5 (2013).
- The World Wildlife Fund (WWF). (2014). Ecological Footprint of Constituent Entities of the Russian Federation. (P. Boyev, ed.) Moscow: WWF Russia.
- Annual Report about State of the Environment and Health of the Population in the Vladimir Region in 2012 (2013). Vladimir: Department of Natural Resources Management and Environmental Protection of the Administration of the Vladimir Region.
- Kostina N.V., Rosenberg, A.G., Rozenberg G.S., & Khasaev, G.V. (2014). Indicator Environmental Footprint and Its Relationship to Other Indices of Regional Economy Sustainable Development. The Bulletin of the Samara State University of Economics, 9 (119), 34-41.
- Global Forest Resources Assessment, 2010 (2011). Federal Agency for Education. Retrieved from http://www.fao.org/docrep/014/i1757r/i1757r.pdf
- The Vladimir Region. Statistical Yearbook (2014). Vladimir: The Federal State Statistics Service for the Vladimir Region.
- Key indicators of Sampling Observation of Household Budgets and Living Standards of the Region’s Population in 2006-2010, Statistical Compilation (2011a). Vladimir: The Federal State Statistics Service for the Vladimir Region.
- Prices and Tariffs. 2011 (2011b). Vladimir: The Federal State Statistics Service for the Vladimir Region.
- The Average Cash Earnings Per Capita in the Regions of the RF in 2009-2014 (2015). The Federal State Statistics Service. Retrieved from http://www.gks.ru/free_doc/new_site/population/urov/urov_11sub.htm

This work is licensed under a Creative Commons Attribution 4.0 International License.


