

Manuscript accepted on :
Published online on: 12-01-2016
Analysis of PDLIM4 Expression in Different Subtypes of Breast Cancer
Kravchenko Dmitry Sergeevich1,2, Yuriy Nikolaevich Lezhnin1,2, Elena Ivanovna Frolova1*
1Shemyakin-Ovchinnikov Institute of Bioorganic Chemistry of the Russian Academy of Sciences 117997, Russian Federation, Moscow, GSP-7, Ulitsa Miklukho-Maklaya, 16/10 2Engelhardt Institute of Molecular Biology, Russian Academy of Sciences 119991 Moscow, Russia
DOI : http://dx.doi.org/10.13005/bbra/1866

ABSTRACT: PDLIM4 is an adapter protein which is frequently silenced in different types of cancer, and is eventually induced in the event of phenotypic reversion of cancer cells. Little is known about specific mechanisms that underly involvement of PDLIM4 in the processes of malignant transformation and reversion; several data suggest that PDLIM4 could function as a regulator of c-Src tyrosine kinase activity, other observations indicate that its participation is not mandatory for c-Src regulation. In this study we explored PDLIM4 role as a possible indicator of molecular subtype of breast cancer. We performed RNA sequencing on the panel of breast cancer cell lines grouped by PDLIM4 status and compared their expression profiles with those of different breat cancer subtypes, and observed a correlation between PDLIM4 status and claudin-low phenotype, which may indicate involvement of PDLIM4 in distinct pathologic pathways that lead to malignant transformation of breast epithelium.
KEYWORDS: PDLIM4; RIL; Breast cancer; Claudin-low; Subtypes
Download this article as:| Copy the following to cite this article: Sergeevich K. D, Lezhnin Y. N, Frolova E. I. Analysis of PDLIM4 Expression in Different Subtypes of Breast Cancer. Biosci Biotech Res Asia 2015;12(3) |
| Copy the following to cite this URL: Sergeevich K. D, Lezhnin Y. N, Frolova E. I. Analysis of PDLIM4 Expression in Different Subtypes of Breast Cancer. Biosci Biotech Res Asia 2015;12(3). Available from: https://www.biotech-asia.org/?p=3710> |
Introduction
Breast cancer is the most common cancer for women and the second leading cause of cancer-related death among females in the world (DeSantis, Ma et al. 2014). It accounts for approximately 25% of all female malignancies with a higher prevalence in developed countries (Khazaei Koohpar, Entezari et al. 2015). During the period from 2008 to 2012 the number of patients with breast cancer have increased by 20%, mortality have rosen by 14%. Only in the United States it was estimated 232670 new cases and 40000 deaths in 2014 (National Cancer Institute, 2015).
Despite the global nature of this disease, many aspects of the etiology and pathogenesis of breast cancer remain unclear. The complexity of breast cancer study is caused by the fact that it brings together a large group of histologically and biochemically heterogeneous tumors with discriminative invasiveness, clinical course, and sensitivity to chemotherapy (Knezevic, Pfefferle et al. 2015; Prat, Pineda et al. 2015). Importantly, this complexity is not fully reflected by the main pathological markers: estrogen receptor (ER), progesterone receptor (PR) and human epidermal growth factor 2 (HER2), all of which are routinely used in the clinic practice to stratify patients for prognostic predictions, to select treatments and to include patients in clinical trials (Prat and Perou 2011). Thus it follows a need for a more detailed classification of breast cancer subtypes depending on the nature of malignant transformation. In this connection, research of molecular markers, involved in the processes of oncotransformation and pathways, that regulate the activity of these genes, could bring us towards a complete picture of the molecular mechanisms of breast cancer developing, which in practice facilitates early diagnostics and the choice of optimal treatment strategy.
Among genes, involved in the neoplastic transformation of cells, is the RIL gene. RIL (reversion-induced LIM-domain containing) is a member of ALP/Enigma family of PDZ and LIM domain-containing adapter proteins that have been suggested to participate in many fundamental biological processes such as cytoskeleton organization, neuronal signaling, cell-lineage specification, and organ development as well as pathological processes like oncogenesis (Vanaja, Ballman et al. 2006; Guryanova, Drazba et al. 2011). RIL, later called PDLIM4, was firstly described in 1995 as a potential tumor suppressor (Kiess, Scharm et al. 1995). In humans PDLIM4 gene is localized on chromosome 5 in the 5q31.1 region, often deleted during different types of malignant diseases (Bashirova, Markelov et al. 1998). The PDLIM4/RIL gene may also be epigenetically suppressed, that was found in transcriptome studies of transformed cells, particularly breast cancer cell lines (Vanaja, Ballman et al. 2006; Boumber, Kondo et al. 2007; Feng, Orlandi et al. 2010; Xu, Shetty et al. 2012).
The role of PDLIM4 in the development of breast cancer has not been studied, but numerous data suggest that the correlation between expression changes of this gene with the processes of malignancy deserve attention and require further research (Zhang, Tu et al. 2009). At the initial stage of our investigation we tried to analyze the relationship between the level of PDLIM4 expression and different subtypes of breast cancer.
Materials and methods
Cell culture
Breast cancer cell lines: MCF7, BT-20, T47D, MDA-MB-468, MDA-MB-231, MDA-MB-435s, BT-474 were purchased from American Type Culture Collection (ATCC). These cell lines are widely distributed throughout scientific community and could be presented in multiple clonal variants, which may slightly differ in expression profiles. Results presented here are reflective to clonal variants of cell lines that were in our possession. All cell lines were grown as recommended by ATCC. Media was changed every 24 hours, and cells were harvested after 96 hours of cultivation. Cell lines were maintained in culture and earliest-passage cells have been stored to maintain integrity of the collection. Quality control of cellular cultures was performed by analysis and reanalysis of morphology, doubling times, protein levels and gene expression. Protein and mRNA were extracted from subconfluent cells in the exponential phase of growth in complete media. The source, clinical, and pathological features of tumors used to derive breast cancer cell lines used in this study are presented in table 1 (Neve, Chin et al. 2006).
Table 1: The source, clinical, and pathological features of tumors used to derive breast cancer cell lines used in this study
| Cell line | Gene cluster | ER | PR | HER2 | TP53 | Source | Tumor type | Age (years) | Ethnicity | Culture media |
| MCF7 | Lu | + | [+] | +/−WT | PE | IDC | 69 | W | DMEM, 10% FBS | |
| BT-20 | BaA | − | [−] | ++WT | P.Br | IDC | 74 | W | DMEM, 10% FBS | |
| T-47D | Lu | + | [+] | ++M | PE | IDC | 54 | RPMI, 10% FBS | ||
| MDA-MB-468 | BaA | [−] | [−] | [+] | PE | AC | 51 | B | L15, 10% FBS | |
| MDA-MB-231 | BaB | − | [−] | ++M | PE | AC | 51 | W | DMEM, 10% FBS | |
| MDA-MB-435S | Lu | − | [−] | −WT | PF | AC | 48 | W | DMEM, 10% FBS | |
| BT-474 | Lu | + | [+] | + | + | P.Br | IDC | 60 | W | RPMI, 10% FBS |
AC, adenocarcinoma; BaA, Basal A; BaB, Basal B; IDC, invasive ductal carcinoma;; Lu, luminal; P.Br, primary breast; PE, pleural effusion; W, White; B, Black.
ER/PR/HER2/TP53 status: ER/PR positivity, HER2 overexpression, and TP53 protein levels and mutational status (obtained from the Sanger web site; M, mutant protein; WT, wild-type protein) are indicated. Expression data are derived from mRNA and protein levels presented in previous studies (Neve, Chin et al. 2006). Square brackets indicate that levels are inferred from mRNA levels alone where protein data is not available.
Media conditions: FBS, fetal bovine serum; DMEM, Dulbecco’s modified Eagle’s medium, GIBCO #11965-092; RPMI, RPMI medium 1640, GIBCO #27016-021; L15, Leibovitz’s L-15 medium, GIBCO #11415-064.
Cell lysates
Protein lysates were prepared from cells which were growing at 60%–80% confluency at the time of harvesting. All cells were rinsed in ice-cold PBS with added 1 mM of phenylmethylsulfonyl fluoride (PMSF) and then washed with lysis buffer containing 50 mM HEPES (pH 7.5), 150 mM NaCl, 25 mM β-glycerophosphate, 25 mM NaF, 5 mM EGTA, 1 mM EDTA, 15 mM pyrophosphate, 2 mM sodium orthovanadate, 10 mM sodium molybdate, leupeptin (10 μg/ml), aprotinin (10μg/ml), and 1 mM PMSF. The same buffer was used for cell extracts preparation with addition of 1% NP40. Clarification of lysates was performed by centrifugation and products were frozen at −80°C. Bio-Rad protein assay kit was used for protein concentration determination.
Nucleic acid isolation
DNA isolation
Cells growing exponentially in culture were washed in phosphate buffered saline (PBS), pelleted by centrifugation, resuspended in PBS, and pelleted again. Pellets were either frozen for long-term storage or used to extract genomic DNA directly. Genomic DNA was extracted using the Genomic DNA Purification Kit (Thermo), additionaly underwent phenol/chloroform extraction, and was quantified with intercalcting dye on a microplate fluorimeter. Phenol/chloroform extraction of the resulting DNA resulted in significantly increased measurement precision due to possible removal of proteins that otherwise interfered with DNA amplification and analysis.
RNA isolation, determination of RNA quality and hybridization to microchips
Total RNA was extracted from cell lines using Trizol using standard protocols for RNA extraction (Invitrogen). Briefly, 200 μl of chloroform was added to the tubes contatining 1 ml of Trizol lysates, and the tubes with the lysis mixture were gently inverted for 5 min. After that, the mixture was centrifuged at 12,000 x g for 15 min at 4°C, and the clear upper solution was transferred into clean tube, to which 500 μl of isopropanol was added. The tubes were inverted before incubation on ice for 1 h, which was followed by centrifugation at 12,000 x g for 10 min at 4°C, and the isopropanol was removed. Ice-cold 75% ethanol was added to the RNA pellet for washing. The ethanol was removed after centrifugation at 12,000 x g for 10 min at 4°C. The RNA pellets were gently dried at room temperature for 5–10 min and reconstituted in 50 μl of RNase-free water, and treated with DNase I (Promega). Purified RNA was quantified with NanoDrop ND-1000 spectrophotometer (Thermo Scientific, USA) and its integrity was assessed by denaturing formaldehyde agarose gel electrophoresis and further verified with capillary electrophoresis (Agilent Bioanalyzer, Palo Alto, CA).
cDNA library preparation for RNA-seq
Total RNA was extracted from each cell line in duplicates using TRIzol (Invitrogen) using standard protocols for RNA extraction. For RNA-Seq, RNA libraries were created independently from each RNA sample using a NEBNext Ultra Directional RNA Library Preparation Kit from Illumina. The first step of the sample preparation was removing of ribosomal RNA with RNAMinus Transcriptome Isolation Kit (Invitrogen). Purified samples of total RNA were fragmented into small pieces with the presence of divalent cations at elevated temperatures. After that, resulting RNA fragments were used as templates for first-strand cDNA synthesis with reverse transcriptase and oligo-dT18 primer. Complementary strand of the DNA was then synthesized by DNA polymerase I and RNase H. Double-stranded cDNA fragments were then ligated with adapters and amplified by PCR to obtain complete cDNA library. Sequencing of cDNA fragments was performed on Illumina HiSeq 2000 System (Moscow State University, faculty of Biology).
Differential gene expression analysis and functional annotation
Raw sequence files were subjected to quality control analysis and mapping using CLC Genomic Workbench 6.0.5. DAVID (Database for Annotation, Visualization and Integrated Discovery) version 6.7 software (http://david.abcc.ncifcrf.gov/home.jsp) was used to determine the most functional annotation of significant genes in the datasets.
Western blotting
Protein lysates (20–50 mg) from cell lines were separated under reducing conditions (5 % β-mercaptoethanol), in 12 % Bis-tris gels (Sigma catalog B7535) and SDS-MOPS-Tris running buffer and transferred to polyvinylidene difluoride membranes (PVDF; Millipore). Membranes were incubated overnight at 4 °C, with primary antibodies (anti-beta-actin, Abcam ab6276, 1:5000; anti-RIL, Abcam ab6045, 1:2000), followed by washing with Tris buffered saline – Tween-20 (0.1 %, TBS-T) and secondary antibody (horse radish peroxidase-conjugated anti-goat or anti-rabbit IgG, Santa Cruz Biotechnology sc-2020 and sc-2004, 1:5,000) incubated for 40 min at room temperature. Signal detection was performed with ECL plus system (GE Healthcare, RPN2232).
Immunochemical techniques and immunoblot quantification
Immunoblot analyses were performed using 20 μg clarified cell lysates. The material was electrophoretically resolved on denaturing 12 % Bis-tris gels (Sigma catalog B7535) and SDS-MOPS-Tris running buffer, transferred to PVDF membranes, and probed with specific antisera using standard techniques. Bound antibodies on immunoblots were detected by either chemiluminescent (ECL plus, GE Healthcare) or infrared (LiCor, Odyssey) imaging. Immunoblots analysis of each protein was performed at least twice in all cases to ensure reproducibility.
Results
At the initial stage we analyzed the expression levels of PDLIM4 in a group of breast cancer cell lines using RT-PCR as shown in a figure 1a. Based on the data obtained, the selected cell lines were divided in two groups: the first, where PDLIM4 is expressed normally or overexpressed (MDA-MB-231, MDA-MB-435s, BT-474) and the second, with very low, hardly detectable transcription levels of PDLIM4 (MCF7, BT-20, T47D, MDA-MB-468). Moreover, Western blot analysis of PDLIM4 protein levels in these cell lines (Figure 1b) correlated well with the PDLIM4 mRNA levels. This indicates heterogeneity of breast cancer cell lines and makes us suggest a potential biological relevance of PDLIM4 in the development of this disease.
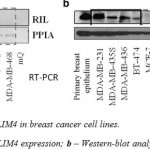 |
Figure 1: Expression of PDLIM4 in breast cancer cell lines |
Expression of PDLIM4 mRNA and protein in various human breast cell lines. (A) PDLIM4 mRNA levels in human breast cancer cell lines by RT-PCR. PPIA mRNA is used as housekeeping control. (B) PDLIM4 protein expression in human breast cancer cell lines by Western blot analysis with an anti-RIL antibody. Beta-actin control staining of blots shows almost equivalent loading of total protein.
The next aim of our work was to identify genes whose expression levels were suppressed or, on the contrary, is upregulated in selected cell lines with high and low level of PDLIM4. We performed RNA sequencing of transcriptomes of cell lines in our panel and compared differentially expressed genes between PDLIM4-positive and PDLIM4-negative groups of cell lines.
RNAseq results analysis revealed a number of genes whose expression was changed in two groups of analyzed cell lines. Some of these genes were upregulated, others were suppressed, compared with normal breast cells. To find a possible correlation between the level of PDLIM4 expression and breast cancer subtype, we compared this data with expression profiles, specific for CL (claudin-low), luminal, Her2+, and basal-like breast cancer types. The lists of genes, upregulated in both groups of cells were compared with the lists of genes, upregulated in different subtypes of breast cancer, so was done for downregulated genes. As a result, there was found a number of genes, whose expression overlapped with expression profile of every subtype of breast cancer. Finally we could compare the similarity of cell lines with high and low expression of PDLIM4 with different cancer types. The results of the research are presented in a figure 2.
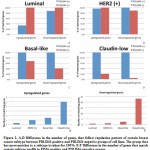 |
Figure 2: A-D Difference in the number of genes, that follow regulation pattern of certain breast cancer subtype between PDLIM4-positive and PDLIM4-negative groups of cell lines. |
The presented data shows that the difference in gene profiles between two groups of cell lines with high and low expression of PDLIM4 depends on subtype of breast cancer. The biggest difference is estimated for the CL subtype and the lowest – for luminal breast cancer. For example, in a list of genes, upregulated in PDLIM4-positive cell lines the number of genes, which are overexpressed in CL subtype is five times bigger, comparing with the list of genes, upregulated in cell lines with low expression of PDLIM4. This correlation can be detected for both upregulated and downregulated groups of genes. This means that there may be a correlation between the level of PDLIM4 expression and the tumor subtype. According the presented results, high level of PDLIM4 expression would be more possibly observed in CL subtype of breast cancer and, on the contrary, suppression of PDLIM4 can be a potential sign of luminal subtype of breast cancer.
Discussion
The presented results indicate possible relationship between elevated levels of PDLIM4 expression and the development of CL subtype of breast cancer, but deserve further testing and research. It is not easy to assess this hypothesis due to the fact, that there are no scientific studies about the correlation between PDLIM4 expression and development of single subtypes of breast cancer. Despite this fact several data declare connection between PDLIM4 and clinical parameters of breast cancer as a whole. Among them it is possible to find characteristics distinctive for a CL subtype and to compare the previously described findings with our recent results.
Several data provide information about the correlation between the level of PDLIM4 and status of one of the main biomarkers, used in clinical practice – progesterone receptors (PR) (Xu, Shetty et al. 2012). High methylation level of PDLIM4 associated with transcriptional silencing, was found in PR negative cancer, in receptor-positive tumors methylation level of PDLIM4 was lower on average (Xu, Shetty et al. 2012). At first glance it is hard to relate this data with our results, indicating correlation between high level of PDLIM4 expression with development of CL subtype, which, as a rule, is characterized by loss of PR, as well and low expression of HER2 and luminal markers such as ER, GATA3, keratins 18 and 19 and the luminal gene cluster. Despite this fact, according to recent studies only 68% of CL tumors are PR negative, whereas 32% demonstrate normal lever of progesterone receptors. Based on this findings, it can be assumed, that high level of PDLIM4 expression can be a sign of PR positive subgroup of CL tumors.
Another important clinical parameter is the differentiation rate of tumor (van Bockel, Verduijn et al. 2014). At the transcriptional level, CL tumors are the most undifferentiated tumors along the mammary epithelial hierarchy (Sabatier, Finetti et al. 2014). Consequently, as CL tumors, as well as basal-like tumors, exhibit properties associated with both epithelial-mesenchimal transition and cancer stem cell self renewal, they are highly resistant to conventional radiation and chemotherapy (Knezevic, Pfefferle et al. 2015). At the same time, despite the apparent similarity to basal-like tumors, CL tumors as a group did not show high expression of proliferation genes and thus are likely slower-cycling tumors. Indeed, significantly lower messenger RNA (mRNA) expression of the cell cycle gene Ki67 was observed in CL tumors when compared with basal-like tumors (Prat, Parker et al. 2010). In this way, it can be supposed, that CL tumors would not be characterized by high level of S-phase fraction (SPF), which is expressed as a percentage of tumor cells in DNA synthesis phase of the cell-cycle. This parameter correlates with proliferative activity of tumor cells and is generally considered to be a prognostic factor in breast cancer (Jourdan, Ferrero-Pous et al. 2002; Baldetorp, Bendahl et al. 2003; Gerashchenko, Huna et al. 2014).
According several data, SPF value positively correlates with high level of PDLIM4 methylation. Lower level of this gene methylation was found in tumors with low SPF value (Xu, Shetty et al. 2012). Summarizing this data, we can see, that it agree with the hypothesis about correlation of high level of PDLIM4 expression with CL tumors.
Conclusions
We compared expression profiles of two groups of breast cancer cell lines, characterized by high and low level of PDLIM4 with expression patterns special for main subtypes of breast cancer. As a result it was found a correlation between overexpression of PDLIM4 and CL subtype of breast cancer. Analysis of available clinical parameters of CL subtype allows as to set up a hypothesis, that high expression level of PDLIM4 can be used as a possible sign of PR negative group of CL tumors.
Despite the fact that we can observe connection between PDLIM4 level and definite cancer subtypes, significant role of this gene in malignant transformation of cells still remains unclear. The further studies have to be focused on revealing of definite mechanisms and signal pathways, connected with PDLIM4. One of possible strategies is to modify expression level of PDLIM4 in breast cancer cells: to use expressor of PDLIM4 in cell lines, were this gene is suppressed and, vise versa, to suppress PDLIM4 expression in cell lines with its normal level. After that it would be possible to analyze transcriptome changes occurred in cells after reversion of PDLIM4 level and to reveal genes, influenced by PDLIM4. Identification of genes, connected with PDLIM4 can help to shed light on controversial mechanisms of PDLIM4 participation in malignant transformation and to find new ways of breast cancer treatment and diagnostic.
Acknowledgements
The work funded by MESR contract №14.604.21.0015 (RFMEFI60414X0015).
References
- National Cancer Institute, 2015. SEER stat fact sheets: Breast. SEER Cancer Statistics Review, 2005 2011. National Cancer Institute, Bethesda, MD. Available online: http://seer.cancer.gov/statfacts/html/breast.html.
- Baldetorp, B., P. O. Bendahl, et al. (2003). “Improved DNA flow cytometric, DNA ploidy, and S-phase reproducibility between 15 laboratories in analysis of breast cancer using generalized guidelines.” Cytometry A 56(1): 1-7.
- Bashirova, A. A., M. L. Markelov, et al. (1998). “The human RIL gene: mapping to human chromosome 5q31.1, genomic organization and alternative transcripts.” Gene 210(2): 239-245.
- Boumber, Y. A., Y. Kondo, et al. (2007). “RIL, a LIM gene on 5q31, is silenced by methylation in cancer and sensitizes cancer cells to apoptosis.” Cancer Res 67(5): 1997-2005.
- DeSantis, C., J. Ma, et al. (2014). “Breast cancer statistics, 2013.” CA Cancer J Clin 64(1): 52-62.
- Feng, W., R. Orlandi, et al. (2010). “Tumor suppressor genes are frequently methylated in lymph node metastases of breast cancers.” BMC Cancer 10: 378.
- Gerashchenko, B. I., A. Huna, et al. (2014). “Characterization of breast cancer DNA content profiles as a prognostic tool.” Exp Oncol 36(4): 219-225.
- Guryanova, O. A., J. A. Drazba, et al. (2011). “Actin cytoskeleton remodeling by the alternatively spliced isoform of PDLIM4/RIL protein.” J Biol Chem 286(30): 26849-26859.
- Jourdan, M. L., M. Ferrero-Pous, et al. (2002). “Flow cytometric S-phase fraction measurement in breast carcinoma: Influence of software and histogram resolution.” Cytometry 48(2): 66-70.
- Khazaei Koohpar, Z., M. Entezari, et al. (2015). “Anticancer Activity of Curcumin on Human Breast Adenocarcinoma: Role of Mcl-1 Gene.” Iran J Cancer Prev 8(3): e2331.
- Kiess, M., B. Scharm, et al. (1995). “Expression of ril, a novel LIM domain gene, is down-regulated in Hras-transformed cells and restored in phenotypic revertants.” Oncogene 10(1): 61-68.
- Knezevic, J., A. D. Pfefferle, et al. (2015). “Expression of miR-200c in claudin-low breast cancer alters stem cell functionality, enhances chemosensitivity and reduces metastatic potential.” Oncogene.
- Neve, R. M., K. Chin, et al. (2006). “A collection of breast cancer cell lines for the study of functionally distinct cancer subtypes.” Cancer Cell 10(6): 515-527.
- Prat, A., J. S. Parker, et al. (2010). “Phenotypic and molecular characterization of the claudin-low intrinsic subtype of breast cancer.” Breast Cancer Res 12(5): R68.
- Prat, A. and C. M. Perou (2011). “Deconstructing the molecular portraits of breast cancer.” Mol Oncol 5(1): 5-23.
- Prat, A., E. Pineda, et al. (2015). “Clinical implications of the intrinsic molecular subtypes of breast cancer.” Breast.
- Sabatier, R., P. Finetti, et al. (2014). “Claudin-low breast cancers: clinical, pathological, molecular and prognostic characterization.” Mol Cancer 13: 228.
- van Bockel, L. W., G. M. Verduijn, et al. (2014). “The importance of actual tumor growth rate on disease free survival and overall survival in laryngeal squamous cell carcinoma.” Radiother Oncol 112(1): 119-124.
- Vanaja, D. K., K. V. Ballman, et al. (2006). “PDLIM4 repression by hypermethylation as a potential biomarker for prostate cancer.” Clin Cancer Res 12(4): 1128-1136.
- Xu, J., P. B. Shetty, et al. (2012). “Methylation of HIN-1, RASSF1A, RIL and CDH13 in breast cancer is associated with clinical characteristics, but only RASSF1A methylation is associated with outcome.” BMC Cancer 12: 243.
- Zhang, Y., Y. Tu, et al. (2009). “Reversion-induced LIM interaction with Src reveals a novel Src inactivation cycle.” J Cell Biol 184(6): 785-792.

This work is licensed under a Creative Commons Attribution 4.0 International License.


