Manuscript accepted on :
Published online on: 12-12-2015
Trends and Patterns of Development of Regional Agricultural Markets in the Russian Federation
Alexey N. Gerasimov, Yevgeny I. Gromov, Natalia V. Kulish, Olga E. Sytnik, Valentina S. Varivoda
Stavropol State Agrarian University, 355017, Russia, Stavropol, Zootechnical Lane, 12
ABSTRACT: The main purpose of this study is to develop a comprehensive scientific issue of ensuring development of local agricultural markets in modern Russia, as well as to identify the main factors that shape the nature of the development of these markets, assess the objective tendencies and patterns of their development, model the condition and project their growth. Synthesized econometric models of production and sales of major agricultural products by undertakings should be seen as a tool for taking management decisions aimed at improving the economic relations and providing the most efficiency of the ongoing policy measures in the region. It should be remembered that in order to obtain reliable results of modeling and forecasting, the synthesized system of econometric equations and predictions derived from them require periodic updating and addition due to changing conditions.
KEYWORDS: sustainable development; assessment; econometric approach; factors of agricultural production; forecasting
Download this article as:| Copy the following to cite this article: Gerasimov A. N, Gromov Y. I, Kulish N. V, Sytnik O. E, Varivoda V. S. Trends and Patterns of Development of Regional Agricultural Markets in the Russian Federation. Biosci Biotech Res Asia 2015;12(2) |
Introduction
The process of global integration of economic relations is accompanied by an aggravation of processes of regional differentiation, which promotes the emergence of a plurality of specific branches of the evolution of local markets of various sizes, the level of development and the nature of the products traded on them (Tatuev, 2012; Tatuev et al., 2014). This aspect is fully applicable to the development of local agricultural markets in modern Russia, which are designed to meet the needs of society in products that make up the basis of food of the population of the corresponding regions (Uglitskikh and Klishina, 2014). At the same time, sustainable development of these markets ensures solution of the issue of national priority – food security of the Russian Federation (Sklyarov et al., 2013).
Sustainable development of certain local markets in the face of uncertainty and increased risks requires testing of the scientifically-based modeling and forecasting techniques, use of formal methods to identify the main patterns of development and strong trends that allow to objectively consider prevailing economic conditions and changes in market conditions (Skripnichenko, 2011).
Correct assessment of the objective tendencies, science-based application of modeling techniques and formulation of aggregate forecast scenarios of development are very important for the development of regional agricultural markets that have significant growth potential (Gerasimov et al., 2014). In this regard, the study of trends and patterns of development of the regional agricultural market is relevant for modern Russia.
Use of forecasting techniques is now a sufficient condition for a stable and sustainable development of agriculture (Tatuev, 2010). It should consider the objective assessment of the situation in the sector at the regional level, as it affects the efficiency of economic activities of agricultural producers. The methods of economic-mathematical modeling and adaptive prediction are of particular importance in this case, as they result in the ability to correct plans for development of the region in time.
Methodology of simulation of indicators of the state and development of the regional agricultural market
Scientific approach, along with the wording of the general objectives of this study in accordance with the needs of managing the agrarian economy, also requires a description of the methodology used in the process of learning and formalization of the models used to solve the tasks (Bobryshev et al., 2014). However, methods and models are needed in the methodology of research as tools to develop management solutions, draw conclusions and findings, substantiate strategic plans and event policy.
Under the proposed research methodology, the econometric approach to modeling and forecasting of the main indicators of the state and development of agriculture allows to ultimately choose the best option of managerial decision-making and provides the highest efficiency of the proposed activities. As part of the econometric approach, the technique for modeling the main indicators of the state and development of local food markets is schematically shown in Figure 1.
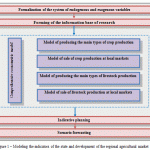 |
Figure 1: Modeling the indicators of the state and development of the regional agricultural market |
In our opinion, the method of modeling and forecasting of the main indicators of the state and development of the regional agricultural market in more detail can be represented by a sequence of 10 interrelated stages:
- Analysis of the current state of agribusiness in the region;
- Goal setting, rationale for the development and use of comprehensive econometric model;
- Formalization of a system of effective and factor model indicators;
- Development of the scheme of structural and logical relationships between the studied groups of indicators of the state and development of agriculture;
- Formation of the initial information base of research: establishment of units and a period of observation;
- Specification of equations of dependence of a comprehensive econometric model in the context of the studied sub-sectors;
- Use of stepwise procedures of selection of essential factor variables for each equation in the system;
- Parameterization of the econometric equations of the system using special methods of the parameter assessment depending on the degree of identifiability of the comprehensive model, verification of their practical significance;
- Use of the statistically significant econometric models to predict the values of the endogenous variables that characterize the state of the studied sub-sectors:
- specification of the trend models for the point estimation of the predicted values of factor variables (selected in the equations of the relevant system) for each of the objects of observation;
- calculation of confidence limits of the forecast that reflect the optimistic and pessimistic scenarios of the projected changes in the indicators;
- calculation of the roundup value of forecast evaluation of effective performance of the system (for North Caucasus Federal District as a whole or for a relevant leading region) as the aggregated result for a set of objects of observation;
- Analysis of the results of modeling and scenario forecasting of the studied parameters in order to develop a set of measures to stimulate the further development of agribusiness in Stavropol Territory
The use of econometric models allows to better understand the studied processes and phenomena, thereby helping formulate objective conclusions based on the results and build more accurate predictions of the necessary indicators. Thus, the econometric approach used in accordance with the used methodology allows to choose the best option of taking managerial decision, which provides the highest efficiency of ongoing activities in the region.
Formalization of a system of effective and factor model indicators
One of the most important tasks of the specification of comprehensive econometric models of the state and development of the local agricultural market in Stavropol Territory is formalization of a system of effective and factor variables included in the equations. Such a system of effective and factor indicators for the construction of comprehensive econometric models must contain a group of endogenous variables, whose values are determined within the model, and exogenous variables that are external to the model, their values are determined outside the model, and therefore they are assumed fixed.
Since the purpose of the study is to examine the patterns and identify trends in the development of local agricultural markets in Stavropol Territory, we consider it appropriate to single out the following groups of endogenous variables:
- group of endogenous variables of the main types of crop production:
Y11 – grain production by agricultural undertakings of Stavropol Territory, thous. tons; Y21 – sunflower production by agricultural undertakings of Stavropol Territory, thous. tons;
- group of endogenous variables of the main types of livestock production:
Y31 – production (raising) of beef by agricultural undertakings of Stavropol Territory, thous. tons; Y41 – production (raising) of pork by agricultural undertakings of Stavropol Territory, thous. tons;
- group of endogenous variables of sales of crop products at local markets:
Y12 – grain sold by agricultural undertakings of Stavropol Territory, thous. tons; Y22 – sunflower seeds sold by agricultural undertakings of Stavropol Territory, thous. tons;
- group of endogenous variables of sales of livestock products at local markets:
Y32 – production (realization for slaughter) of beef by agricultural undertakings of Stavropol Territory, thous. tons; Y42 – production (realization for slaughter) of pork by agricultural undertakings of Stavropol Territory, thous. tons.
The following indicators were used as exogenous variables of the comprehensive econometric model proposed for construction:
Х11 – production of sugar beet by agricultural undertakings of Stavropol Territory, thous. tons; Х12 – production of milk (with given fat content) by agricultural undertakings of Stavropol Territory, thous. tons; Х21 – sugar beet sold by agricultural undertakings of Stavropol Territory, thous. tons; Х22 – milk sold by agricultural undertakings of Stavropol Territory, thous. tons; X31 – level of profitability (loss) of crops, %; X32 – level of profitability (loss) of sunflower, %; X33 – level of profitability (loss) of sugar beet, %; X34 – level of profitability (loss) of cattle gain, %; X35 – level of profitability (loss) of pigs gain, %; X36 – level of profitability (loss) of milk and milk products, %; X41 – production cost of 1 ton of grain, rub.; X42 – production cost of 1 ton of sunflower, rub.; X43 – production cost of 1 ton of sugar beet, rub.; X44 – production cost of cattle gain, rub./ton; X45 – production cost of pigs gain, rub./ton; X46 – production cost of milk, rub./ton; X51 – average price of grain sold across all channels, rub./ton; X52 – average price of sunflower sold across all channels, rub./ton; X53 – average price of sugar beet sold across all channels, rub./centner; X54 – actual sale price of livestock and poultry, rub./ton; X55 – actual sale price of milk, rub./ton; X6 – average annual value of fixed assets, mln. rub.; X7 – current assets, mln. rub.; X8 – average monthly wage of workers, rub.; X9 – average per capita population income per month, rub.; X10 – investment in fixed assets of agriculture, mln. rub.
Defined goals and objectives of the present study, an analysis of the current situation at local agricultural markets in Stavropol Territory, and a reasonable system of effective and factor variables of the comprehensive econometric model allowed to offer structural and logic relationships and interdependence of groups of endogenous variables of production and sales and main groups of exogenous variables.
Specification of dependencies of the comprehensive econometric model in the context of the studied sectors of agriculture
According to the proposed algorithm of research and the constructed system of effective and factor indicators, the assessment of the relationships in the framework of the proposed structural and logic scheme at the specification stage is carried out using multivariate linear dependencies that are appropriate to consider in the form of multiple linear regression equations, which is due to the simplicity of the subsequent interpretation of the results (Gerasimov et al., 2015).
In general, the models of production and sale of main types of agricultural products by agricultural producers of Stavropol Territory can be represented as follows:
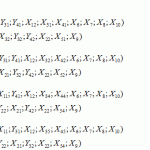
In accordance with the proposed procedure, it is required to carry out a stepwise selection of significant factor variables in each equation of the system in order to improve their practical significance. The matter is that at the initial stage in the formation of a system of indicators, it included all the possible conditions for the functioning of local markets for crop production. However, the main purpose of constructing comprehensive econometric models is not so much the assessment of the relationships between all selected indicators (both strongly and weakly interrelated with the effective ones) as modeling of the processes and phenomena studied only by the most important factors that have a really strong effect on endogenous variables.
Computational procedures in accordance with the proposed method of modeling and forecasting of the results of operation and development of local regional agricultural markets were performed using the SPSS software package.
Results of the analysis of the current state of agribusiness in the region
In order to identify promising directions of development of regional agricultural markets, we should define the scope of the considered areas of specialization of agribusiness of the region (Tatuev and Bahturazova, 2014). Thus, the next stage requires consideration of the structure of the regional product of the North Caucasus Federal District (NCFD) in order to identify the leading regions in agricultural production (Sklyarov et al., 2015).
Analysis of the structure of the gross regional product (GRP) of the NCFD regions and the total GRP of the NCFD shows that all the NCFD regions differ significantly in the structure of the gross regional product (Lescheva et al., 2014), while all the NCFD subjects give an expressed priority to agricultural production (share of agriculture in GRP of the NCFD is more than three times higher than the corresponding figure in the industry’s contribution to the GRP of the Russian Federation). Secondly, Stavropol Territory leads in the volume of agricultural production. It follows that the emphasis in modeling and forecasting of production and sales in the regional agricultural market should be made on Stavropol Territory (Glotova et al., 2014).
Assessing the situation in the grain market and its processing in the NCFD, it should be noted that for the period of 2007-2012, the subjects of the federation included in the district have produced more than 10% of grain in the structure of its production in the Russian Federation (Gerasimov et al., 2014), while the share of Stavropol Territory in grain production in the NCFD is more than 80% (Figure 2).
The main sellers of grain in the North Caucasus region are agricultural producers from Stavropol Territory, accounting for 68.7% of the total sales volume or 4.53 mln. tons on average over the analyzed period, which is shown in Figure 3 (Trukhachev et al., 2014).
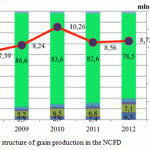 |
Figure 2: Volume and structure of grain production in the NCFD |
Assessing the overall situation in the local market of sunflower seeds and products of their processing in the NCFD, we noticed that the average annual production volume over 2007-2012 amounted to 441.8 thous. tons, which is higher than the values of this indicator in the region recorded for 2011 and 2012. (Trukhachev et al., 2015). However, we cannot convincingly argue about the current trend of declining production of sunflower seeds, because the values of this indicator vary considerably from year to year. At the same time, it is obvious that the main producers of these products are agricultural undertakings and peasant (farming) enterprises (Tomilina et al., 2013) of Stavropol Territory (more than 85% of the production of sunflower seeds in the NCFD) (Figure 4).
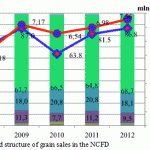 |
Figure 3: Volume and structure of grain sales in the NCFD |
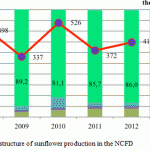 |
Figure 4: Volume and structure of sunflower production in the NCFD |
Therefore, special attention in modeling and forecasting production of volumes of sunflower seeds production should be given to such a region of the NCFD as Stavropol Territory (Stavropol Territory agrarian economics, 2014).
Studying the size and structure of the sales of sunflower seeds in the NCFD, we should also note a dominant position of producers of Stavropol Territory in the local market (Figure 5).
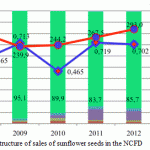 |
Figure 5: Volume and structure of sales of sunflower seeds in the NCFD |
A similar assessment of the situation in the local market of livestock production leads to the conclusion about the leading role of such sectors of the industry as production of beef and pork. Average annual volumes of production and sales of these agricultural products in Stavropol Territory are major contributors to the production and sale of these NCFD products (Erokhin et al., 2015). Based on the findings, we consider it appropriate to focus on Stavropol Territory in modeling and forecasting the production volumes of beef and pork.
Forecasting the parameters of development of the market of crop production in Stavropol Territory
It is advisable to perform parameterization of regression dependences of production and sales of grains from a set of exogenous variables to produce objective results on the basis of systems of simultaneous equations, which should be built separately for each of the types of agricultural products (Uglitskikh and Klishina, 2013).
The system of equations resulting from the selection of essential factor variables of the models of production and sales of grain has the following structural form:

The statistical significance of the regression models is due to the magnitude of Fisher’s F-criterion. Thus, according to data from the Y11, Y12 models, the maximum ratio of the factor and residual dispersion is observed in the Y11 model at 176.34 times, and minimal – in the Y12 model at 125.56 times. The highest value of the multiple coefficient of determination was obtained at this stage for the Y12 equation, according to which the volume of grain sales by agricultural undertakings of Stavropol Territory were explained at 93.4% by the variation of the factors included in the model.
The value of significance of the F-criterion (Sig.) shows the probability of error at which it is permissible to reject the null hypothesis and accept the alternative. In statistical studies, there is a common terminology that refers to the confidence intervals of probability. Statements with the probability of error are called significant; statements with the probability of error – very significant; and statements with the probability of error – the most significant. Thus, it can be concluded that all Y11, Y12 models obtained at this stage are the most significant.
Building a system of equations of production and sales of grain with high statistical characteristics allows to use the obtained results to predict the values of the endogenous variables.
At the final stage, the obtained predicted values of exogenous and endogenous variables were substituted into the right side of the system of recursive equations, and the aggregated result of predictive values of indicators is determined. Results of adaptive prediction of endogenous variables of the developed system of econometric equations for the production and sales of grain by agricultural undertakings of Stavropol Territory are presented in Figures 5-6, and the sale prices – in Figure 7.
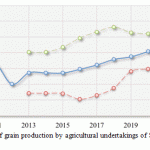 |
Figure 6: Forecast of volume of grain production by agricultural undertakings of Stavropol Territory in 2013-2025, thous. tons |
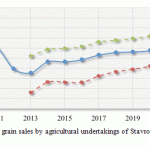 |
Figure 7: Forecast of volume of grain sales by agricultural undertakings of Stavropol Territory in 2013-2025, thous. tons |
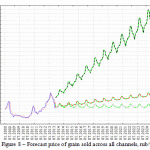 |
Figure 8: Forecast price of grain sold across all channels, rub/ton |
The system resulting from the selection of essential factor variables of models of production and sales of sunflower seeds has a structural form and is shown below:
The results for the model (6) follow that the maximum ratio of factor and residual dispersions is observed for the endogenous variable Y22 (102.53 times), the minimum – for Y21 (98.65 times). Confidence intervals of probability of error allow to conclude that the dependences of the system of regression equations (6) are the most significant.
The highest value of the multiple coefficient of determination was obtained at this stage for the second equation, in accordance with which the sales of sunflower seeds by agricultural undertakings of Stavropol Territory were explained at 91.6% by the variation of the factors included in the model.
Building a system of equations of production and sales of sunflower with high statistical characteristics allows to use the obtained results to predict the values of the endogenous variables. Results of the adaptive prediction of endogenous variables of the developed system of econometric equations for the production and sale of sunflower seeds by agricultural undertakings of Stavropol Territory are presented in Figures 8-9, and sale prices – in Figure 10.
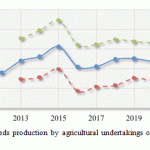 |
Figure 9: Forecast of sunflower seeds production by agricultural undertakings of Stavropol Territory in 2013-2025, thous. tons |
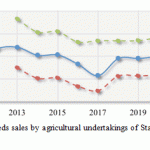 |
Figure 10: Forecast of sunflower seeds sales by agricultural undertakings of Stavropol Territory in 2013-2025, thous. tons |
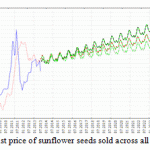 |
Figure 11: Forecast price of sunflower seeds sold across all channels, rub/ton |
Forecasting the parameters of development of the market of livestock production in Stavropol Territory
In result of the use of the stepwise selection procedures (“inclusion-exclusion”) of the essential factor variables, we obtained the structural form of the model of production and sales of beef by agricultural undertakings of Stavropol Territory:

The resulting system of econometric equations is presented as linear models of multiple regression. At that, the data for the model (7) follow that the maximum ratio of factor and residual dispersions is observed in the dependency for Y32 at 123.25 times, and the minimum – for Y31 at 104.62 times. The highest value of the multiple coefficient of determination was obtained according to the data of Stavropol Territory for to the equation Y31, in accordance with which the volumes of beef production in Stavropol Territory were explained at 92.3% by the variation of the factors included in the model.
Unbiased and consistent estimates of model parameters in the system of equations of production and sales of beef by agricultural undertakings of Stavropol Territory and the high quality of statistical characteristics of the models allow to use the results to predict the values of the endogenous variables. Results of the adaptive prediction of endogenous variables of the developed system of econometric equations are presented in Figures 11-12, and sale prices – in Figure 13.
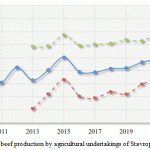 |
Figure 12: Forecast of beef production by agricultural undertakings of Stavropol Territory in 2013-2025, tons |
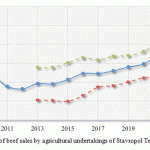 |
Figure 13: Forecast of beef sales by agricultural undertakings of Stavropol Territory in 2013-2025, tons |
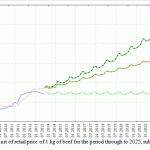 |
Figure 14: Forecast of retail price of 1 kg of beef for the period through to 2025, rub. |
In result of the use of the stepwise selection procedures (“inclusion-exclusion”) of the essential factor variables, we obtained the structural form of the model of production and sales of pork by agricultural undertakings of Stavropol Territory:

The resulting system of econometric equations is presented as linear models of multiple regression. At that, the data for the model (8) follow that the maximum ratio of factor and residual dispersions is observed in the equation for Y41 variable at 142.83 times, and the minimum – for Y42 at 98.34 times. The highest value of the multiple coefficient of determination was obtained according to the data of Stavropol Territory for to the equation Y42, in accordance with which the variation of volumes of pork sales in Stavropol Territory was explained at 86.2% by the factors included in the model.
Results of the adaptive prediction of endogenous variables of the developed system of econometric equations are presented in Figures 14-15, and sale prices – in Figure 16.
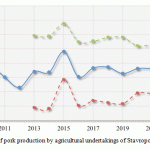 |
Figure 15: Forecast of pork production by agricultural undertakings of Stavropol Territory in 2013-2025, tons |
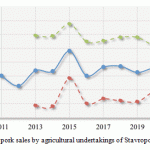 |
Figure 16: Forecast of pork sales by agricultural undertakings of Stavropol Territory in 2013-2025, tons |
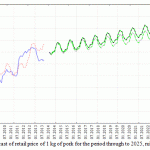 |
Figure 17: Forecast of retail price of 1 kg of pork for the period through to 2025, rub |
Conclusion
In result of studying the structure of GRP of the NCFD, we can conclude that all the subjects of this territory give an expressed priority to agricultural production. At the same time, Stavropol Territory leads the market of agricultural products. Agrarian area of agribusiness is the leading sector of economics, agriculture generates 10% of gross regional product, accumulates 13% of total investment and plays an important social role by providing employment for 17% of the population of the region.
With significant economic potential, the territory has the opportunity to address not only regional, but also federal tasks of providing the population with food. Stavropol Territory produces about 9% of grain, 6% of sunflower, 5% of sugar beet, takes 2nd place in the country for the production of wool. According to estimates of various ratings, it is one of the most effective subjects of the Federation by agricultural production.
In result of the study, a method of adaptive forecasting of production and sales of agricultural products in the regional market was proposed and tested.
To ensure the sustainable development of local agricultural markets in the current conditions, we propose the following:
- Apply the proposed method of adaptive forecasting of production and sales of agricultural products in the local market.
- Use software product that allows to analyze the volume and structure of agricultural production at the meso level in automatic mode.
- Apply econometric models of production and sales of main types of agricultural products in the regional market in order to predict various horizons of the main levels of the represented indicators.
Acknowledgement
The authors express their profound gratitude to the rector of the Stavropol State Agrarian University, Professor Vladimir Ivanovich Trukhachev, for the opportunity to conduct research in the innovative laboratories of the educational institution.
References
- Bobryshev, A.N., T.N. Uryadova, E.P. Lyubenkova, V.S. Yakovenko and O.A. Alekseeva, 2014. Analytical and management approaches to modeling of the accounting balance sheet. Life Science Journal, 11(8): 502-506.
- Erokhin, V., A. Ivolga and W. Heijman, 2014. Trade liberalization and state support of agriculture: Effects for developing countries. Agricultural Economics (Czech Republic), 60(11): 524-537.
- Gerasimov, A.N., Y.I. Gromov and Y.S. Skripnichenko, 2015. Assessing of the prospects for the creation of advanced socioeconomic development centers in the agricultural sector of the Stavropol Krai. Actual Problems of Economics, 164(2): 396-402.
- Gerasimov, A.N., E.I. Gromov and O.I. Shatalova, 2014. Implementation of econometric approach to determination of prospective directions in development of local markets of crop products. Actual Problems of Economics, 156(10): 456-465.
- Gerasimov, A.N., E.I. Gromov and Y.S. Skripnichenko, 2014. Development of localized in space economies in traditionally agricultural regions of Russian Federation. Actual Problems of Economics, 156(6): 264-276.
- Glotova, I.I., E.P. Tomilina and I.P. Kuzmenko, 2014. Modeling the processes of own working capital reproduction in agricultural organizations. Life Science Journal, 11(5): 536-541.
- Lescheva, M.G., A.G. Ivolga and O.M. Labenko, 2014. Special methodological aspects of economic analysis for rural territories development. Actual Problems of Economics, 159(9): 432-439.
- Sklyarov, I.Y. and Y.M. Sklyarova, 2013. Development of small forms of entrepreneurship and agricultural production in Russian village. Middle East Journal of Scientific Research, 17(4): 424-428.
- Sklyarov, I.Y., Y.M. Sklyarova, A. Latysheva and I.M. Podkolzina, 2015. The Evaluation of the Agro-Business Resource Potential in Southern. Published by Canadian Center of Science and Education. Asian Social Science, 11(3): 305-312.
- Tatuev, A.A. and T.V. Bahturazova, 2014. Personal savings: controversial role in extended reproduction. Life Science Journal, 11(12): 375-379.
- Tatuev, A.A., D.A. Edelev and A.H. Zhankaziev, 2015. The State Unified Exam as a Requirement in Russia’s New Economic Relations. Asian Social Science, Vol. 11, 6: 1165-1172.
- Tomilina, E.P., I.I. Glotova and I.P. Kuzmenko, 2013. Development of integration processes in the traditional sectors of agriculture. Middle East Journal of Scientific Research, 13(SPL.ISSUE): 178-182.
- Trukhachev, V., A. Ivolga and M. Lescheva, 2015. Enhancement of land tenure relations as a factor of sustainable agricultural development: Case of Stavropol Krai, Russia. Sustainability (Switzerland), 1(7): 164-179.
- Trukhachev, V.I., V.Z. Mazloev, I.Y. Sklyarov and Y.M. Sklyarova, 2014. Analysis of the market for agricultural products in South Russia. American-Eurasian Journal of Sustainable Agriculture, 8(6): 52-59.
- Uglitskikh, O.N. and J.E. Klishina, 2013. Modeling interregional inter-branch relations as an element of interaction between the branches of the agroindustrial complex. Middle East Journal of Scientific Research, 13(SPL.ISSUE): 183-190.
- Uglitskikh, O.N. and J.E. Klishina, 2014. Providing financial support for nature conservation activities in regions. Life Science Journal, 11(10): 543-547.
- Agrarian economy of Stavropol Territory: problems of functioning and development prospects, 2014. Eds., Trukhachev, V.I. Stavropol: AGRUS: 580.
- Skripnichenko, Yu.S., 2011. Cluster approach to the construction of territorial-production systems. Bulletin of the University (State University of Management), 24: 221-223.
- Tatuev, A.A., 2010. Directions of the transformation of regional development. Terra Economicus, Vol. 8, 4-3: 97-100.
- Tatuev, A.A., 2012. Priorities of modernization of socioeconomic development of the region. Economics, 87: 71-75.
(Visited 307 times, 1 visits today)

This work is licensed under a Creative Commons Attribution 4.0 International License.


