

Manuscript accepted on :
Published online on: 25-12-2015
А. А. Imanbayeva1 and I. F. Belozerov2
1General Director Candidate (Biology) RSE "Mangyshlak Experimental Botanical Garden" SC MES RK, Kazakhstan 10 micro district, Aktau city, Mangistau , 13000 2Deputy General Director for Science Candidate (Agricultural) RSE "Mangyshlak Experimental Botanical Garden" SC MES RK, Kazakhstan 10 micro district, Aktau city, Mangistau, 130000
ABSTRACT: The work presents the results of research works related to intensity of transpiration, water holding, content of chlorophyll and heat tolerance of woody plants at Mangistau arid conditions in seasonal and intraday dynamics and in connection with soil humidity and main meteofactors, and materials of the correlation and regression analysis with graphical representation in the form of graphs
KEYWORDS: transpiration intensity; water holding; chlorophyll content; heat tolerance; adaptation; correlation; regression
Download this article as:| Copy the following to cite this article: Imanbayeva A. A, Belozerov I. F. Physiological Indicators of Wood Introducents’ Growth and Development under Arid Conditions of Mangistau. Biosci Biotech Res Asia 2015;12(2) |
Introduction
Mangistau is situated in the desert zone of the West Kazakhstan with the strongly continental climate. The winter period is short and with little snow but rather cold. Summers are hot and longstanding. High summer air temperatures (up to 43-450С), strong deficit of atmospheric moisture (the number of precipitations is 107-180 mm per year), salt salinity, strong winds and high solar activity create certain difficulties in phytointroduction and planting process and stipulate the desert character of Mangistau flora. Monocyclic herbaceous plants of 268 species or 43.1% prevail in the natural flora, 247 species (40%) belong to perennial herbaceous plants. Woody plants are presented by only 100 species (16.2 % of the total number). In the area under research there are no trees as a life form of natural vegetation [1].
That’s why in the complex of events related to Mangistau botanic reclamation an important part is assigned to woody plants introduction. However, according to the conducted experiments, the creation of woodlands in the desert zone happened to be quite a difficult task. The majority of the introduced plants were observed to have various damages and even die in the hottest and driest years [2-4]. One of the principal reasons of this fact is inadequate rationale of the wood species range.
There are several methods in plants introduction theory the best known and widespread of which in the twentieth century include climatic analogues method [5], generis complexes method [6], ecological and historical method [7], method with the usage of floras genetic affinity while selecting introducents [8, 9], phytogeographical method [10], ecological and physiological method [11], methodological recommendations for selecting trees and shrubs for plants introduction (1981), recommendations on projected forecasting of introduction results based on the gained experience (1986) and on introduction zoning [6-9, 12-16], ecological and extrapolation method of the range selection [17].
Using large volume of factual material on plants introduction, perspective species of woody plants are basically pointed out on the basis of studying phenology, growth rhythms, and introducents development in botanical gardens collections. Such approach prevails and provides good results; however, it does not allow to investigate the mechanisms of plants adaptation to unfavorable environment. The experiments conducted earlier and related to studying introducents water exchange and heat tolerance educed some peculiarities of their adaptation; however, as a whole conclusions regarding the plants tolerance to various environmental factors are based on the literature data.
The aim of this research was to study physiological indicators of woody introducents in the intraday and seasonal dynamics and to carry out their correlational analysis for investigating mechanisms of introducents adaptation to Mangistau desert principal stress factors.
Materials and Research Methods
21 collectors’ species of trees and shrubs of various geographic origin, level of biopersistence, exigence to humidity and forms of growth were selected as objects of the research; they included 5 conifers: Platycladus orientalis (L.) Franco, Juniperus virginiana L., Pinus pallasi-ana Lamb., Pinussilvestris L., Juniperussabina L., 13 leafy ones: Quercus robur L., Crataegus ambigua C. A. Mey, Fraxinus sogdiana Bunge, Berberis vernae Schneid., Betula verrucosa Ehrh., Populus diversifolia Schrenk., Populus bolleana Lauche., Robinia pseudoacacia L., Elaeagnus oxycarpa Schlecht., Gleditsia triacanthos L., Maclura aurantiaca Nutt., Ulmus pumila L., Syringa josikae Jacg., and 3 fruiters: Amygdalus nana L., Malus sieversii (Ldb.), Armeniaca vulgaris Lam.
The following methods were applied while conducting physiological researches: water holding by drying leaves to permanent weight at the temperature of 100-1050С; transpiration intensity intensity on decreasing the mass of the cut leaves by a weight method [18]; chlorophyll content in leaves at the PD -303 UV spectrophotometer [19-21]; and heat resistance by a generally accepted thermos bulbs method [19]. While transpiration intensity intensity studies, such principal meteofactors as luminance, temperature and air humidity were taken into account. Luminance was changed with the aid of “TKA-Lux” light meter, soil humidity was simultaneously defined by a thermostatic and weighing method.
Statistical processing of the received results was conducted according to the methodology of G.F. Lakin [22] also using the package of Statgraphics Centurion XVI.I statistic software (2011).
Research Results and Their Discussion
A significant part in the complex of events during the plants introduction is assigned to studying introducents adaptation ability in the introduction area. In particular, important indicators of the adaptation reaction under the conditions of the Mangistau desert include transpiration intensity intensity as an indicator of optimizing solar radiation absorption and water consumption, chlorophyll concentration as the most important component of the leaves photosynthetic apparatus and heat resistance that reflects plants ability to bear high temperatures and overwarming. That’s why our researches regarded these physiological parameters as principal markers of wood and ornamental introducents introduction value.
According to average 3 years’ data, all introducents were classified into three groups according to the variables of transpiration intensity (hereinafter referred to as the IT) (Table 1):
- weakly transpirating (less than 250 mg/g of damp leaves weight per hour) – all conifers (Eastern Biota – Platycladus orientalis (L.) Franco, American Cedars – Juniperus virginiana L. and Crimean Pine – Pinus pallasi-ana Lamb.),
- medium transpirating (250 – 500 mg/g of damp leaves weight per hour) – Honey Locust (Gleditsia triacanthos L.), Osage Orange (Maclura aurantiaca Nutt.), Sharp-Fruited Oleaster – (Elaeagnus oxycarpa Schlecht.), Bolle’s Poplar (Populus bolleana Lauche), Heterophillous Asiatic Poplar (Populus diversifolia Schrenk.), Russian Almand (Amygdalus nana L.), Warty Birch (Betula verrucosa Ehrh.), Verna Barberry (Berberis vernae Schneid.), Sogdian Ash (Fraxinus sogdiana Bunge), Apricot (Armeniaca vulgaris Lam.), and
- highly transpirating (above 500 mg/g of damp leaves weight per hour) – Crataegus Ambigua (Crataegus ambigua C. A. Mey), English Oak (Quercus robur L.), Asian Wild Apple (Malus sieversii (Ldb.) M.Roem.).
The absolute maximum of IT (1,578 mg/g per hour) was observed with a moisture-loving tree Populus bolleana Lauche. and other woody plants of the mesophytes and mesohygrophytes series: Betula verrucosa Ehrh. (1,115), Crataegus ambigua S. A. Meu (1,546), Berberis vernae Schneid.(1,011), Gleditsia triacanthos L.(1,428) and Quercus robur L.(1,313 mg/g per hour).
Table 1: Transpiration Intensity and Water Holding of Woody Plants Leaves, 2012-2014
| Plant title | Transpiration Intensity | Water ration in leaves, % | ||||
| min. | max. | average | min. | max. | average | |
| Conifers | ||||||
| Platycladus orientalis (L.) Franco | 62 | 559 | 215 | 38 | 80 | 57.0 |
| Juniperus virginiana L. | 54 | 591 | 204 | 35 | 85 | 59.5 |
| Pinus pallasi-ana Lamb. | 69 | 590 | 199 | 37 | 85 | 60.5 |
| Average: | 54 | 591 | 206 | 35 | 85 | 59.0 |
| Leafy trees and shrubs
|
||||||
| Betula verrucosa Ehrh. | 151 | 1,115 | 478 | 40 | 85 | 64.0 |
| Crataegus ambigua C. A. Mey | 78 | 1,546 | 520 | 48 | 78 | 67.5 |
| Berberis vernae Schneid. | 180 | 1,011 | 480 | 46 | 93 | 67.0 |
| Gleditsia triacanthos L. | 72 | 1,428 | 353 | 45 | 87 | 61.5 |
| Quercus robur L. | 34 | 1,313 | 533 | 61 | 85 | 70.0 |
| Maclura aurantiaca Nutt. | 14 | 980 | 404 | 44 | 80 | 60.0 |
| Elaeagnus oxycarpa Schlecht. | 91 | 838 | 367 | 44 | 85 | 64.0 |
| Populus bolleana Lauche. | 20 | 1,578 | 459 | 34 | 80 | 60.0 |
| Populus diversifolia Schrenk. | 165 | 1,023 | 417 | 45 | 92 | 64.5 |
| Fraxinus sogdiana Bunge. | 122 | 822 | 441 | 40 | 84 | 64.5 |
| Average: | 14 | 1,578 | 445 | 34 | 93 | 64.3 |
| Fruiters and shrubs | ||||||
| Armeniaca vulgaris Lam. | 162 | 1,292 | 465 | 43 | 96 | 69.5 |
| Amygdalus nana L. | 153 | 1,134 | 401 | 43 | 94 | 71.5 |
| Malus sieversii (Ldb.) M.Roem. | 115 | 969 | 571 | 47 | 96 | 72.5 |
| Average: | 115 | 1,292 | 479 | 43 | 96 | 71.2 |
| Average for all plants: | 14 | 1,578 | 407 | 34 | 96 | 64.6 |
Transpiration has intraday and seasonal dynamics. There are several approaches to the interpretation of transpiration seasonal dynamics. Relating the process of physiological water return to the combination of meteofactors, the majority of researchers specify the close correlation only subject to sufficient water provision of woody plants [18, 23-25]. According to the authors’ attendance, transpiration intensity increases from spring to mid-summer and then decreases by autumn. Another approach is based on gradual aging of leaves bio colloid protoplasm that stipulates regular decrease in the transpiration discharge during the whole vegetation period [26, 27]. I.I.Sidnicyn observed similar transpiration dynamics [28] but he explained it by constant depletion of the soil water content. In our experiment every vegetation month the soil humidity varied according to a strictly defined interval – from pre-watering level (70-75) up to 100% of full field water capacity as all collectors’ species of woody plants are grown only under the conditions of regular irrigation, and samples were selected in the middle of the inter-watering period. Only meteofactors and physiological condition of the woody plant changed.
The picture of seasonal TI dynamics received for the prevailing number of introducents in average for three years looks like a unimodal curve with the peak in June (Table 2) that is stipulated by a depression of physiological water return in July-August from high temperature and solar insolation, from aging of the leaves apparatus, worsening of temperature mode and increase in the air humidity in September (Fig. 1).
The seasonal dynamics of TI looks very unusual with one of the most biologically stable species Sharp-fruited Oleaster (Fig. 1). Its variable strictly corresponds to the temperature variation, and that’s why the maximum is observed in July, and the minimum in May and September. It is also proved by the correlation analysis according to the results of which this brood has the highest negative intercommunication (r = -0.64) with the air temperature (Table 3).
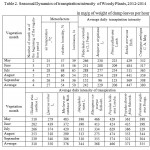 |
Table 2: Seasonal Dynamics of transpiration intensity of Woody Plants, 2012-2014 in mg/g of weight of damp leaves per hour |
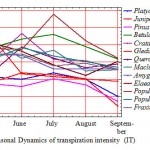 |
Figure 1: Seasonal Dynamics of transpiration intensity (IT) |
According to the average data, the correlation ratio of TI is statistically veracious only with the number of the month as of the beginning of the vegetation period (r=-0.91) that gave an opportunity to establish the regression equation (Fig. 2) with air temperature (r=0.13) and humidity (r=0.49) as well as luminance (r=-0.37), the importance correlation is insufficient, being 5 %.
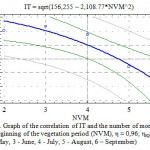 |
Figure 2: Graph of the correlation of IT and the number of months as of the beginning of the vegetation period (NVM), η = 0,96; ηкр05 = 0,88 (2 – May, 3 – June, 4 – July, 5 – August, 6 – September) |
Table 3: Correlation of transpiration intensity with the Number of the Vegetation Month and Principal Meteofactors at Seasonal Dynamics Research
|
Plant |
Number of the vegetation month | Meteofactors | ||
| air temperature, 0С | relative humidity, % |
luminance, lx |
||
| Platycladus orientalis (L.) Franco | -0.69 | 0.37 | 0.97 | 0.70 |
| Juniperus virginiana L. | -0.62 | 0.51 | 0.87 | 0.80 |
| Pinus pallasi-ana Lamb. | -0.62 | 0.41 | 0.99 | 0.72 |
| Betula verrucosa Ehrh. | -0.47 | 0.71 | 0.84 | 0.92 |
| Crataegus ambigua C. A. Mey | -0.49 | 0.31 | 0.22 | 0.47 |
| Gleditsia triacanthos L. | -0.80 | -0.72 | 0.19 | -0.41 |
| Quercus robur L. | 0.00 | 0.64 | 0.01 | 0.57 |
| Maclura aurantiaca Nutt. | -0.87 | -0.28 | 0.48 | 0.03 |
| Amygdalus nana L. | -0.88 | -0.50 | 0.06 | -0.20 |
| Elaeagnus oxycarpa Schlecht. | -0.77 | -0.64 | -0.14 | -0.42 |
| Populus bolleana Lauche. | -0.10 | 0.74 | 0.83 | 0.82 |
| Populus diversifolia Schrenk. | -0.60 | 0.44 | 0.47 | 0.65 |
| Fraxinus sogdiana Bunge. | -0.91 | -0.32 | 0.32 | 0.03 |
| Average for all plants: | -0.91 | 0.13 | 0.49 | 0.37 |
| Note – Critical value of the correlation coefficient at the 5 per cent level of signification is 0.88 | ||||
In the seasonal and time aspect the TI correlation between the chosen taxas is evaluated as high only between the representatives of one morphology and systematic group or in case of the similarity of steadiness and confinedness of the native habitat. For example, conifers species – r = 0.91-0.92, Elaeagnus oxycarpa Schlecht. and Populus diversifolia Schrenk. – 0.70. In other cases it is unveracious in order of performance (r<rкр05).
As for the variability of TI during the vegetation, woody plants are allocated as follows (Table 4): 1) low mutation (Cv< 10%): Betula verrucosa Ehrh.; 2) medium (Cv> 10-20%): Amygdalus nana L., Quercus robur L., Populus diversifolia Schrenk., Fraxinus sogdiana Bunge. and 3) high (Cv> 20%): Platycladus orientalis (L.) Franco., Juniperus virginiana L., Pinus pallasi-ana Lamb., Crataegus ambigua C. A. Mey, Gleditsia triacanthos L., Maclura aurantiaca Nutt., Elaeagnus oxycarpa Schlecht., Populus bolleana Lauche. Taxas that are the most widespread in Mangistau greening enter the groups with the highest variability of TI due to better adaptation to desert conditions of vegetation.
Unlike transpiration seasonal development, the intraday dynamics is affected by a less number of endo and exophatic causes. However, its character is very variegated and depends on both changes of meteorological conditions and species biology (Table 5).
Table 4: Principal Statistics of Meteofactors and Transpiration Intensity According to the Materials of Studying Seasonal Dynamics in mg/g of weight of damp leaves per hour
| Plants | X | Sx | Cv | Plant | X | Sx | Cv |
| Platycladus orientalis (L.) Franco | 242 | 23.4 | 21.7 | Maclura aurantiaca Nutt. | 376 | 34.8 | 20.7 |
| Juniperus virginiana L. | 229 | 34.7 | 33.9 | Amygdalus nana L. | 344 | 20.0 | 13.0 |
| Pinus pallasi-ana Lamb. | 206 | 22.1 | 23.9 | Elaeagnus oxycarpa Schlecht. | 368 | 33.2 | 20.1 |
| Betula verrucosa Ehrh. | 447 | 12.1 | 9.8 | Populus bolleana Lauche. | 466 | 43.7 | 21.0 |
| Crataegus ambigua C. A. Mey | 380 | 35.6 | 21.0 | Populus diversifolia Schrenk. | 371 | 19.0 | 11.5 |
| Gleditsia triacanthos L. | 310 | 50.5 | 36.4 | Fraxinus sogdiana Bunge. | 355 | 18.8 | 11.9 |
| Quercus robur L. | 350 | 27.1 | 17.3 | Average: | 342 | 19.2 | 12.5 |
| Note – X is an average value of the variable, Sx is an error of the average and Cv is a variation coefficient, % | |||||||
Table 5: Daily Dynamics of Woody Plants Transpiration Intensity (Average Data), 2012-2014
| Meteofactors,
plants |
Time | Average | |||
| 0930 | 1130 | 1430 | 1630 | ||
| Platycladus orientalis (L.) Franco | 254 | 300 | 251 | 249 | 264 |
| Juniperus virginiana L. | 270 | 289 | 261 | 260 | 270 |
| Pinus pallasi-ana Lamb. | 281 | 277 | 235 | 274 | 267 |
| Betula verrucosa Ehrh. | 583 | 509 | 535 | 445 | 518 |
| Crataegus ambigua C. A. Mey | 344 | 392 | 413 | 448 | 399 |
| Gleditsia triacanthos L. | 347 | 332 | 277 | 346 | 325 |
| Quercus robur L. | 375 | 370 | 369 | 480 | 399 |
| Maclura aurantiaca Nutt. | 383 | 407 | 464 | 345 | 400 |
| Amygdalus nana L. | 312 | 359 | 396 | 355 | 355 |
| Elaeagnus oxycarpa Schlecht. | 330 | 365 | 514 | 442 | 413 |
| Populus bolleana Lauche. | 445 | 502 | 529 | 460 | 484 |
| Populus diversifolia Schrenk. | 337 | 422 | 422 | 549 | 432 |
| Fraxinus sogdiana Bunge. | 424 | 347 | 378 | 395 | 386 |
| Average: | 360 | 375 | 388 | 388 | 378 |
According to the average data, three types of the intraday rhythm of transpiration are singled out: 1) “growing” (from morning till evening) – Platycladus orientalis (L.) Franco, Juniperus virginiana L., Betula verrucosa Ehrh.; 2) “falling” (fro morning till evening) – Gleditsia triacanthos L. and 3) “changeable” (with the maximum at noon) – Pinus pallasi-ana Lamb., Crataegus ambigua C. A. Mey, Quercus robur L., Maclura aurantiaca Nutt., Amygdalus nana L., Elaeagnus oxycarpa Schlecht., Populus bolleana Lauche., Populus diversifolia Schrenk., Fraxinus sogdiana Bunge.
However, in July, the hottest and driest month, according to the intraday dynamics of IT, the majority of plants must be referred to the “changeable” type with the minimum at noon. Transpiration curves sort of deflate. The change of transpiration intensity ceases to correspond to the intraday process of meteofactors. Asymmetry of transpiration curves is registered towards antemeridian or postmeridian hours. L.N.Alekseenko [29] and I.M.Hashes [30] pointed at this peculiarity. The first author explains the shift of the maximal transpiration intensity with endo causes. Transpiration discharge without regulatory activity of plants themselves must gradually increase by 2 p.m. and then decrease, also gradually. However, in some period of the day the plant starts failing to provide leaves with the amount of water required for exhaling in accordance with the energy inflow. At this time the maximum transpiration is observed; after that it weakens and does not correspond to the process of meteofactors, and is defined by physiological condition [29, 31]. Thus, even under the conditions of high relative water supply, the desert climate makes plants actively regulate their water exchange. On average the maximum of transpiration intensity is fixed for all plants under experiment for May, June, August and September at 2.30 p.m. with the decrease and increase towards morning and evening hours. In hot July IT gradually decreases during the day by 5-12%.
Since transpiration is the final stage of irrigation water circulation in soil and plant, its contingence with soil humidity and leaves water holding closely related to it is doubtless even from the logical point of view [18, 30-38]. The level of transpiration decreases as the soil humidity lowers. The less there is water in soil, the weaker plant water supply is. A decrease in the water content automatically lowers the transpiration process due to stomatal and out of stomatal regulation.
In our research even subject to using a complex degree connection (Fig. 3) the correlation of transpiration intensity and leaves water holding is statistically veracious at the 5 percent level of the importance (η=0.79).
The soil humidity designates only 11.6 % of all TI changes (r=0.34), which is less than expected and is stipulated, first of all, by its dependence on other factors, meteorological in particular (Table 6). Herewith, the correlation coefficient varies for various woody plants between very wide limits – from 0.17 to 0.56. In average the most veracious regression equation in order of importance between TI and soil humidity has a square degree (Fig. 4) and the correlation ratio (η) is 0.66.
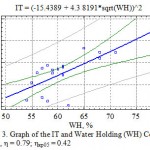 |
Figure 3: Graph of the IT and Water Holding (WH) Correlation, η = 0.79; ηкр05 = 0.42 |
Table 6: Dependence of transpiration intensity on Soil Humidity (per Three Summer Months in Average)
in mg/g of weight of damp leaves per hour
| Soil humidity, plants | Days Number after watering | Average | Correlation coefficient | |||
| 1 | 3 | 5 | 8 | |||
| Water content in the layer of 1 m: | ||||||
| – total, m3/ha | 1,433 | 1,356 | 1,227 | 1,116 | 1,283 | – |
| – in % of the minimum soil water capacity | 95.8 | 90.6 | 81.9 | 74.5 | 85.7 | – |
| Woody plants | ||||||
| Platycladus orientalis (L.) Franco | 185 | 224 | 155 | 161 | 181 | 0.23 |
| Juniperus virginiana L. | 180 | 157 | 160 | 170 | 167 | 0.21 |
| Pinus pallasi-ana Lamb. | 162 | 214 | 184 | 208 | 192 | 0.31 |
| Betula verrucosa Ehrh. | 484 | 545 | 476 | 484 | 497 | 0.56 |
| Crataegus ambigua C. A. Mey | 659 | 799 | 601 | 577 | 659 | 0.46 |
| Gleditsia triacanthos L. | 392 | 308 | 371 | 347 | 354 | 0.29 |
| Quercus robur L. | 838 | 784 | 876 | 705 | 801 | 0.32 |
| Maclura aurantiaca Nutt. | 607 | 650 | 582 | 502 | 585 | 0.17 |
| Amygdalus nana L. | 598 | 553 | 518 | 457 | 531 | 0.35 |
| Elaeagnus oxycarpa Schlecht. | 461 | 276 | 442 | 410 | 397 | 0.31 |
| Populus bolleana Lauche. | 405 | 600 | 528 | 514 | 512 | 0.25 |
| Populus diversifolia Schrenk. | 446 | 392 | 367 | 356 | 390 | 0.31 |
| Fraxinus sogdiana Bunge. | 712 | 700 | 536 | 473 | 605 | 0.50 |
| Average: | 471 | 510 | 474 | 437 | 483 | 0.34 |
| Note – Critical value of the correlation coefficient at the 5 per cent level of signification is 0.47 | ||||||
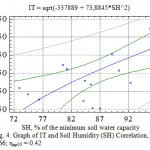 |
Figure 4: Graph of IT and Soil Humidity (SH) Correlation, η = 0.66; ηкр05 = 0.42 |
In addition to soil humidity content, basic factors of the environment that influence transpiration include luminance intensity, relative humidity and air temperature, speed of the wind. Internal factors include area, location and structure of leaves, behavior of stomatoes and efficiency of the action of the absorbing roots surface. There are also complicated interrelations between various factors.
The higher the deficit of air humidity is, the lower (more negative) its water potential is and the quicker exhaling is. As a whole, it is also true for transpiration. However, it is necessary to take into account that if there is water lack, the leaf undergoes the stomatal and out of stomatal regulation. Due to it, the external conditions impact has a soft character, and the transpiration starts increasing slower that it should. In spite of it, the general regularity of the transpiration dependence on the atmosphere water intension is true: the lower is the air relative humidity, the higher is TI.
The analysis of the research collected materials showed the presence of a significantly close connection of TI with air relative humidity (η > ηкр05) practically for all woody plants chosen for the experiments (Table 7). The graph of the multiplicative correlation of TI and RH shows an explicitly expressed tendency of the decrease in the transpiration discharge with the increase in the water content in the air (Fig. 5).
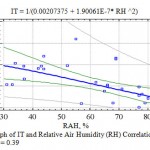 |
Figure 5: Graph of IT and Relative Air Humidity (RH) Correlation, η = 0.59; ηкр05 = 0.39 |
Graph of IT and Relative Humidity (RH) Correlation
Table 7: Correlation of transpiration intensity with the Part of the Day and Principal Meteofactors at Studying the Intraday Dynamics
| Plant | Part of the day | Meteofactors | ||
| air temperature, С0 | relative humidity, % | luminance, lx | ||
| Platycladus orientalis (L.) Franco | -0.07 | 0.21 | -0.51 | 0.44 |
| Juniperus virginiana L. | -0.06 | 0.08 | -0.42 | 0.62 |
| Pinus pallasi-ana Lamb. | -0.06 | 0.11 | -0.51 | 0.62 |
| Betula verrucosa Ehrh. | -0.26 | 0.05 | -0.37 | 0.59 |
| Crataegus ambigua C. A. Mey | 0.23 | 0.18 | -0.57 | 0.19 |
| Gleditsia triacanthos L. | -0.06 | 0.61 | -0.21 | -0.23 |
| Quercus robur L. | 0.18 | 0.20 | -0.69 | 0.14 |
| Maclura aurantiaca Nutt. | -0.02 | 0.43 | 0.05 | -0.31 |
| Amygdalus nana L. | 0.21 | 0.30 | -0.50 | 0.05 |
| Elaeagnus oxycarpa Schlecht. | 0.32 | 0.36 | 0.09 | -0.29 |
| Populus bolleana Lauche. | 0.06 | 0.31 | -0.06 | -0.02 |
| Populus diversifolia Schrenk. | 0.30 | 0.32 | -0.70 | 0.02 |
| Fraxinus sogdiana Bunge. | -0.05 | 0.52 | -0.33 | 0.07 |
| Average for all plants: | 0.12 | 0.46 | -0.59 | 0.19 |
| Note – Critical value of the correlation coefficient at the 5 per cent level of signification is 0.39 | ||||
The next factor of the environment influencing the transpiration process that we researched is air temperature. It is known that in case of an increase in the temperature the amount of water vapor suffusing this space rises considerably. An increase in the water vapor elasticity causes an increase in the humidity deficit that in its turn increases the amount of the transpirated humidity. There is a statistically veracious connection between IT and air temperature both according to average correlation coefficient – r = 0.46 (Fig.7) and correlation ratio (0.40) of the complex multiplicative degree formula (Fig. 6).
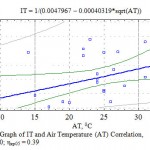 |
Figure 6: Graph of IT and Air Temperature (AT) Correlation, η = 0.40; ηкр05 = 0.39 |
During the research for the first time for the Mangistau conditions regression equitation was established and a graph of TI correlation with luminance was made (Fig. 7). The graph displays that an increase in the luminance intensity within the researched interval from 29.1 to 75.6 lux does not lead to the depression of the transpiration process due to closing stomatoes from strong solar radiation and overheating.
Transpiration intensity depends on the development phase, too. As a rule the transpiration decreases with an increase in the age. High inhalation with young leaves may occur due to the strengthening of cuticular transpiration that is weakly developed in this period. Thus, according to the data of P.L.Genkel [39], the cuticular transpiration of young leaves of a birch tree is about 50%, and only 20% of the total inhalation with the old ones. Herewith, it is interesting that not only the proper age of the leaf but also the total age of the whole plant has an impact on the inhalation intensity.
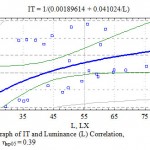 |
Figure 7: Graph of IT and Luminance (L) Correlation, η = 0.38; ηкр05 = 0.39 |
P.L.Genkel [39] considers that gradual decrease in the transpiration intensity in the process of ontogenesis of both an organ and a plant as a whole can be an evidence of the biogenetic law (ontogenesis recapitulates phylogenesis). It is true there is a correspondence between the way plants adapted to land life style in phylogenesis and to better reserve of water in intogenesis.
The regularity of TI decrease with the age within the interval of 2-20 years for the majority of taxas under Mangistau conditions (Table 8) is observed, although in a weak form. The correlation relation in average for all introducents even in case of using a S-curve dependence (Fig. 8) is 0.38 at the critical indicator of 0.47.
The variability and multiplication of transpiration process factors do not allow to refer its intensity to markers of plants biopersistence so far. However, a certain contingence of their resistance to arid conditions of the vegetation environment with TI variation coefficient was investigated. The higher it is, the more resistant the introducent is due to the autoregulation of the water mode. For example, plants with the highest variability of physiological inhalation (38.2 – 47.2%) included such broods that are resistant under local conditions as Platycladus orientalis (L.) Franco, Elaeagnus oxycarpa Schlecht., Populus bolleana Lauche., Populus diversifolia Schrenk. (Table 9). And, on the contrary, less resistant plants – Betula verrucosa Ehrh., Crataegus ambigua C. A. Mey, Gleditsia triacanthos L. and Fraxinus sogdiana Bunge. – have the variation coefficient of 5-15% less.
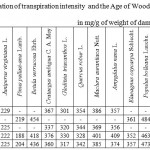 |
Table 8: Correlation of transpiration intensity and the Age of Woody Plants in mg/g of weight of damp leaves per hour |
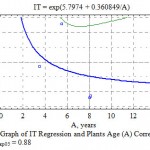 |
Figure 8: Graph of IT Regression and Plants Age (A) Correlation, η = 0.48; ηкр05 = 0.88 |
Table 9: Principal Statistics of transpiration intensity According to the Materials of Intraday Dynamics, 2012-2014 in mg/g of weight of damp leaves per hour
| Plant | X | Sx | Cv | Plant | X | Sx | Cv |
| Platycladus orientalis (L.) Franco | 264 | 20.4 | 39.4 | Maclura aurantiaca Nutt. | 400 | 33.8 | 43.0 |
| Juniperus virginiana L. | 270 | 21.0 | 39.6 | Amygdalus nana L. | 356 | 16.1 | 23.1 |
| Pinus pallasi-ana Lamb. | 267 | 22.1 | 42.2 | Elaeagnus oxycarpa Schlecht. | 413 | 30.9 | 38.2 |
| Betula verrucosa Ehrh. | 518 | 28.0 | 27.5 | Populus bolleana Lauche. | 485 | 25.3 | 26.6 |
| Crataegus ambigua C. A. Mey | 399 | 28.2 | 36.0 | Populus diversifolia Schrenk. | 433 | 40.1 | 47.2 |
| Gleditsia triacanthos L. | 326 | 22.6 | 35.3 | Fraxinus sogdiana Bunge. | 386 | 19.0 | 25.0 |
| Quercus robur L. | 399 | 32.6 | 41.6 | Average: | 378 | 16.1 | 21.8 |
| Note – X is an average value of the variable, Sx is an error of the average and Cv is a variation coefficient, % | |||||||
The chlorophyll content in leaves depends not only on the conditions of the organism but also its genetic nature. That’s why it can be used as a physiological indicator that characterizes ontogenetic, age and genetic peculiarities of plants. The number of pigments also reflects the plant reaction to the factors of the habitat. The relation between photosynthesis and water mode is basically stipulated by the impact the water has on the whole complex of plant life processes, but first of all, synthesis of green pigments. Plants with high resistance to drought lose less water, and chlorophyll in them is more stable [40, 42].
According to our data, seasonal content of chlorophyll in the majority of taxas looks like a bimodal curve with maximums in June and September (Table 10). Herewith, according to average data, the difference in the leaf intension with chlorophyll between June and July is basically minimal (0.02-0.09%). The chlorophyll content with more biologically resistant woody plants (Siberian Elm, Sharp-fruited Oleaster) is exposed to seasonal effects in a less degree. In addition, chlorophyll in leaves of shrubs during the vegetation period is on a more permanent level than in trees.
Conifers are less rich in chlorophyll (0.52%) as to leafy plants (0.75%). Based on the research materials, the content of chlorophyll cannot be recognized as a true indicator of plants resistance so far as it greatly depends on bioecological features of introducents especially under unfavorable conditions of the Mangistau desert.
Table 10: Seasonal Dynamics of Chlorophyll Content in Leaves of Woody Trees in per cent of damp weight
| Plant | Month | |||||
| May | June | July | August | September | average | |
| Conifers and shrubs | ||||||
| Platycladus orientalis (L.) Franco | 0.58 | 0.58 | 0.48 | 0.41 | 0.58 | 0.53 |
| Juniperus virginiana L. | 0.82 | 0.23 | 0.15 | 0.12 | 0.23 | 0.31 |
| JuniperussabinaL. | 0.67 | 0.99 | 0.92 | 0.85 | 0.98 | 0.88 |
| Pinussilvestris L. | 0.84 | 0.27 | 0.19 | 0.16 | 0.29 | 0.35 |
| Average: | 0.73 | 0.52 | 0.44 | 0.39 | 0.52 | 0.52 |
| Leafy trees and shrubs | ||||||
| RobiniapseudoacaciaL. | 0.63 | 0.92 | 0.93 | 0.85 | 0.98 | 0.86 |
| Berberis vernae Schneid. | 0.31 | 0.55 | 1.11 | 1.03 | 1.17 | 0.83 |
| Betula verrucosa Ehrh. | 0.31 | 1.01 | 0.92 | 0.84 | 1.01 | 0.82 |
| Crataegus ambigua C. A. Mey | 0.62 | 0.78 | 0.73 | 0.67 | 0.78 | 0.72 |
| Ulmus pumila L. | 0.47 | 0.77 | 0.75 | 0.66 | 0.78 | 0.69 |
| Gleditsia triacanthos L. | 0.42 | 0.63 | 0.58 | 0.49 | 0.61 | 0.55 |
| Quercus robur L. | 0.48 | 0.86 | 0.84 | 0.80 | 0.86 | 0.77 |
| Elaeagnus oxycarpa Schlecht. | 0.51 | 0.77 | 0.74 | 0.69 | 0.79 | 0.70 |
| Maclura aurantiaca Nutt. | 0.63 | 0.60 | 0.53 | 0.49 | 0.59 | 0.57 |
| SyringajosikaeJacg. | 0.58 | 0.74 | 0.69 | 0.63 | 0.74 | 0.68 |
| Populus bolleana Lauche. | 0.41 | 0.71 | 0.73 | 0.66 | 0.79 | 0.66 |
| Populus diversifolia Schrenk. | 0.41 | 0.71 | 0.73 | 0.66 | 0.79 | 0.66 |
| Fraxinus sogdiana Bunge. | 0.40 | 1.49 | 1.40 | 1.37 | 1.46 | 1.22 |
| Average: | 0.48 | 0.81 | 0.82 | 0.76 | 0.87 | 0.75 |
| Fruiters and shrubs | ||||||
| Armeniaca vulgaris Lam. | 0.33 | 0.44 | 0.39 | 0.33 | 0.47 | 0.39 |
| Amygdalus nana L. | 0.97 | 0.23 | 0.13 | 0.24 | 0.24 | 0.36 |
| Malus sieversii (Ldb.) M.Roem. | 0.42 | 1.26 | 1.14 | 1.18 | 1.27 | 1.05 |
| Average: | 0.57 | 0.64 | 0.55 | 0.58 | 0.66 | 0.60 |
| Average for all introducents: | 0.54 | 0.73 | 0.70 | 0.66 | 0.77 | 0.68 |
Significant differences are noticed between species of woody and shrubby introducents according to heat tolerance level (heat resistance) [19, 40, 41]. The majority of plants start suffering at the temperature of 35-40°С already. Droughty organs bear elevated temperature better: seeds up to 120°С, blossom dust up to 70°С [19].
High temperature perniciously influences organisms causing damages of membranes and albumens. Even partial denaturation of some ferments that are the most labile to temperature leads to the violation of exchange processes concordance. Liquefiable nitrogeneous compounds and other poisonous intermediary products of exchange are accumulated causing cells death. Photosynthesis is especially sensitive to elevated temperatures (at 35-40°С already). The activity of phytohormones and gibberellins also decreases. This is one of the reasons of the slowdown of growth process [40-43].
Plants worked up a system of morphological and physiological accommodations protecting them from thermal damages: light coloring, stowing and curling of leaves, downiness or paleolas, thin layers of the phellem, big thickness of cuticular layer, high content of carbonhydrates and low content of water in cytoplasm, etc. [20, 40, 41].
In our experiments (Table 11) weak damage of leaves is observed in many introducents as a brown discoloration at the temperature of water of 50°С. At this temperature burden brown discoloration of more than 50% of the leaf area was fixed with Betula verrucosa Ehrh., SyringajosikaeJacg. and Malus sieversii (Ldb.) M.Roem. Total brown discoloration is basically noted when the temperature reaches 70 – 80°С. If to accept a 50% damage of leaves as a criteria, woody plants can be classified into three groups according to the level of heat tolerance: 1) “low” (50°С) – Betula verrucosa Ehrh., SyringajosikaeJacg. and Malus sieversii (Ldb.) M.Roem.; 2) “medium” (60°С) – Berberis vernae Schneid., Betula verrucosa Ehrh., Crataegus ambigua C. A. Mey, Gleditsia triacanthos L., Ulmus pumila L., Quercus robur L., Elaeagnus oxycarpa Schlecht., Maclura aurantiaca Nutt., and 3) “high” (70°С) – Platycladus orientalis (L.) Franco, Juniperus virginiana L., Pinus pallasi-ana Lamb. During the vegetation period the ability of plants to bear high temperatures practically does not change in spite of the leaf apparatus aging and changes of the weather conditions that is related to its genetic impaction for every specific species.
Table 11: Defining Heat Tolerance of Plants, 2013-2014
| Plant | Level of leaves damage at the temperature of | ||||
| 40°С | 50°С | 60°С | 70°С | 80°С | |
| Conifers | |||||
| Platycladus orientalis (L.) Franco | – | – | + | ++ | +++ |
| Juniperus virginiana L. | – | – | + | ++ | +++ |
| Pinus pallasi-ana Lamb. | – | – | + | ++ | +++ |
| Leafy trees and shrubs | |||||
| Berberis vernae Schneid. | – | + | ++ | +++ | +++ |
| Betula verrucosa Ehrh. | + | ++ | ++ | +++ | +++ |
| Crataegus ambigua C. A. Mey | – | + | ++ | +++ | +++ |
| Gleditsia triacanthos L. | + | + | ++ | +++ | +++ |
| Ulmus pumila L. | – | + | ++ | +++ | +++ |
| Quercus robur L. | – | + | ++ | +++ | +++ |
| Elaeagnus oxycarpa Schlecht. | – | + | ++ | +++ | +++ |
| Maclura aurantiaca Nutt. | – | + | ++ | +++ | +++ |
| SyringajosikaeJacg. | + | ++ | +++ | +++ | +++ |
| Populus bolleana Lauche. | – | + | ++ | +++ | +++ |
| Populus diversifolia Schrenk. | – | + | ++ | +++ | +++ |
| Fraxinus sogdiana Bunge. | – | + | ++ | +++ | +++ |
| Fruiters and shrubs | |||||
| Armeniaca vulgaris Lam. | + | + | ++ | +++ | +++ |
| Amygdalus nana L. | + | + | ++ | +++ | +++ |
| Malus sieversii (Ldb.) M.Roem. | + | ++ | ++ | +++ | +++ |
Conclusions
Thus, according to the results of the 3 years’ researches, three groups of introducents were singled out according to variables of the water transpiration discharge: weakly transpirating (3 species of trees), – medium transpirating (7 species of trees and shrubs), and highly transpirating (3 species of trees). According to the results of the correlation analysis, a close correlation of TI with water holding of woody plants leaves (r = 0.79) is defined. Soil humidity predetermines from 11.6 to 43.6 % of changes of the transpiration discharge (r = 0.34; η = 0.66). The correlation ratio of TI with relative humidity (r = -0.59) and air temperature (r = 0.46) is veracious on the importance level of 5%. It is connected with the luminance variable statistically unveraciously (r = 0.19). Seasonal dynamics of TI for the majority of introducents looks as a unimodal curve with the maximum in June. Three types are singled out for the day rhythm: “growing” (from morning till evening – three species of trees), “falling” (from morning till evening – one species of trees and “changeable” (with the maximum at noon – nine species of trees and shrubs). Based upon the researching material, due to significant variability and multiple factors, the intensity of the transpiration process cannot be referred to criteria of woody plants resistance. However, herewith, noticeable connection of introducents biological resistance with the TI variation coefficient was investigated. As soon as its values grow, the tolerance of plants to torrid conditions of the habitat usually increases due to their increased ability to self-regulate water exchange.
Seasonal variation of chlorophyll content is characterized by a bimodal curve with the maximums in June and September. In the most biologically resistant species (Siberian Elm, Sharp-fruited Oleaster) the content of chlorophyll exposes to seasonal fluctuations in a less degree. During the vegetation period chlorophyll in shrubs is contained on a more stable level than in trees. Conifers are saturated with chlorophyll (0.52 %) in a less degree as to leafy ones (0.75%).
According to heat resistance, plants are classified into three groups: “low” (50°С) – 3 species, “medium” (60°С) – 8 and “high” (70°С) – 3 taxas.
Bioecological indicator fixed genetically and weakly amenable to intraspecific changes can be fully used as a diagnostic characteristic of the introduction value of plants under arid conditions.
The received data will be used for developing and implementing a scientifically grounded range of woody introducents for landscaping and phytomelioration under Mangistau desert arid conditions.
The researches have been conducted within “Introduction of Plants as a Scientific Basis of Enriching and Preserving Plants of Kazakhstan Ex-situ and In-situ, Optimizing Innovational Technologies on Reproduction, Cultivation and Landscaping of the Western, Central and Eastern Regions of the Republic of Kazakhstan“ grant project of the Ministry of Education and Science of the Republic of Kazakhstan (2012-2014).
References
- Safronova, I.N., 1996. Deserts of Mangyshlak (Vegetation Study). Works of V.L. Komarov Botanical Institute of the Russian Academy of Sciences. Issue 18. Saint Petersburg: State enterprise printing products number 3 (ATRT-3), pp: 212.
- Akhmatov, K.A., 1976. Adaptation of Woody Plants to Drought. Frunze: Ilim Publishing House, pp: 200.
- Liubimov, V.B., 2002. Ecological Basics of Theory and Practice of Trees and Shrubs Introduction in Arid Areas, thesis of PhD in Biology, Voronezh State Academy of Forestry, Voronezh, pp: 496.
- Imanbaeva, A.A. and O.N. Kosareva, 2012. Woody Plants of the Mangyshlak Research Botanical Garden. 40 Years of Introduction. Aktay: Typography LLP «SK-print», pp: 243.
- Mayer, H., 1909. Waldbau auf Naturgeschichtliher Grundlage. Berlin: Parey, pp: 319.
- Rusanov, F.N., 1971. Generis Complexes Method in Plants Introduction and Its Further development. Bulletin of Botanical Garden of the Academy of Sciences of the USSR, 81: 15-20.
- Kultiasov, M.V., 1953. Ecological and Historical Method in Plants Introduction. Bulletin of the Main Botanical Garden, 15: pp: 24-39.
- Kormilitsyn, A.M., 1969. Genetic Affinity of Floras as a Basis for Choosing Woody Plants for Their Introduction and Selection. Selection of Stonefruits and Subtropical Fruitlers, Fancy Woody, Flowery and Ethereal and Vegetable Oil Crops, Vol. XI. Simferopol: the Nikitsky State Botanical Garden, pp: 145-164.
- Kormilitsyn, A.M., 1977. Methodological Recommendations on Selecting Trees and Shrubs for Introducing in the South of the UUSR. Yalta: the Nikitsky State Botanical Garden, pp: 29.
- Vavilov, N.I., 1967. Botanical and Geographical Basics of Selection. Selected Works, Vol.1. Leningrad: Nauka, Leningrad branch, pp: 343-404.
- Petuhova, I.P., 1981. Ecological and Physiological Introductions of Woody Plants. М: Nauka, pp: 124.
- Lapin, P.I. and S.V. Sidneva, 1973. Assessment of the Perspective of Woody Plants Introduction According to Sighting Data. In the Experience of Woody Plants Introduction. Moscow: the Botanical Garden of the Academy of Sciences of the USSR, Nauka, pp: 7-80.
- Lapin, P.I., 1974. Introduction of Woody Plants in Midland of the European Part of the USSR (scientific basis, methods and results). Leningrad: Nauka, Leningrad branch, pp: 137.
- Petukhova, I.P., 1986. Ecological and Physiological Basics of Woody Plants Introduction. Moscow: Nauka, pp: 124.
- Proskuriakov, M.A. and V.G. Rubanik, 1986. Experience and Perspectives of Forecasting Results of Introduction of Woody Plants in Kazakhstan. Bulletin of the Main Botanical Garden, 139: 55-58.
- Golovkin, B.N., 1986. To Issue on Introduction Zoning. Bulletin of the Main Botanical Garden, 139: 3-6.
- Baitulin, I.O., M.A. Proskuriakov and S.V. Chekalin, 1992. Systematic and Ecological Approach to Plants Introduction in Kazakhstan. Part 2. Almaty: Kainar, pp: 198.
- Ivanov, L.A., A.A. Silina and Yu.L. Tselniker, 1952. On Transpiration of Field-Protecting Broods Under Conditions of the Derkulskaya Plain. Botanical Journal, Vol. 37, 2: 113-138.
- Viktorov, D.P., 1983. Mini Practice on Plants Physiology. Мoscow: Vysshaya Shkola, pp: 135.
- Tretiakov, N.N., 1990. Practice on Plants Physiology. Мoscow: Agropromizdat, pp: 271.
- Plotnikova, V.I. and E.A. Zhivuhina, 2001. Practice on Plants Physiology. Moscow: “Akademia” Publishing Center, pp: 144.
- Lakin, G.F., 1990. Biometrics. Мoscow: Vysshaya Shkola, pp: 352.
- Bikhele, Z.N., H.A. Moldau and Ross Yu.K., 1980. Mathematic Modeling of Transpiration and Photosynthesis under Lack of Soil Humidity. Leningrad: Hydrometeoizdat, pp: 224.
- Tselinker, Yu.L., 1958. On Water Regime of Forest Stands during the First Life Years. Labors of Forest Institute, 41: 87-95.
- Silina, А.А., 1955. On Transpiration of Woody Broods of the Telermanovsky Forestry. Plants Physiology, Vol. 2, 4: 38-44.
- Smirnov, I.A., 1977. Verdurization and Afforestation Amelioration in the Unsaturated Zone. Almaty: Kainar, pp: 152.
- Kraevoy, S.Ya., 1970. Ecological and Physiological Basics of Protective Afforestation in the Neardesert. Мoscow: Nauka, pp: 240.
- Sudnitsyn, I.I., 1979. Movement of Soil Humidity and Water Consumption of Plants. Мoscow: Publishing House of the Moscow University, pp: 255.
- Alekseenko, L.N., 1975. Peculiarities of Pristine and Seasonal Process of Intensity of Ley Plants Transpiration. Botanical Journal, Vol. 60, 12: 1740-1749.
- Hashes, Ts.M., 1971. On Physiology of the Pristine Rhythm of Woody Plants Transpiration. Ecology, 6: 82-90.
- Parent B, Turc O, Gibon Y, Stitt M & Tardieu F (2010) Modelling temperature-compensated physiological rates, based on the coordination of responses to temperature of developmental processes. Journal of Experimental Botanic 61: 2057–2069.
- Gann, L.P. and O.V. Kolov, 1975. On Peculiarities of Water Exchange of Rapidly Foetal and Common Forms of Circassian Walnuts. Water Exchange in Basic Types of Vegetation of the USSR. Novosibirsk: Nauka: 116- 121.
- Gordeeva, T.K., 1952. Intensivity of Plants Transpiration in the Volga-Ural Comprehensive Neardesert Interfluve Areas. Botanical Journal, Vol. 37, 4: 526-531.
- Gulidova, I.V., 1955. On Transpiration of Woody and Shrubby Broods in the Subzone of Southern Black Soils. Works of Forest Institute, 27: 11-128.
- Kramer, P.D. and T.T. Kozlovsky, 1983. Physiology of Woody Plants. Мoscow: Lesnaya Promyshlennost, pp: 464.
- Hlebnikova, N.A. and M.I. Markova, 1955. Transpiration of Young Woody Plants under Conditions of the Caspian Plain. Works of Forest Institute, 27: 73-91.
- Tselniker, Yu.L., 1958. On Indicators of Water Regime of Leaves of Woody Broods in Steppe Zone. Works of Forest Institute, 41: 36-54.
- Ghannoum O. C4 photosynthesis and water stress // Journal Annals of Botany. – 2009. – V. 103. – P. 635–644.
- Genkel, P.A., 1982. Physiology of Plants Heat and Drought Resistance. Мoscow: Nauka, pp: 10-219.
- Maksimov, N.A., 1952. Selected Works on Plants Drought and Winter Resistance, Vol.1. Мoscow: Selhozgiz, pp: 576.
- Kramer, P.D. and Y. Kozlovsky, 1983. Physiology of Woody Plants. Мoscow: Lesnaya Promyshlennost, pp: 532.
- Kalituho, L.N., N.L. Pshybytko, L.F. Kabashnikova and P. Jahns, 2003. Photosynthetic Apparatus and High Temperature: Role of Light. Bulletin Plant Physiology, Special Issue: 281–289.
- Chaves, M.M., J. Flexas and C. Pinheiro, 2009. Photosynthesis under Drought and Salt Stress: Regulation Mechanisms form Whole Plant to Cell. Journal Annals of Botany, 103: 551-560.

This work is licensed under a Creative Commons Attribution 4.0 International License.


