

Manuscript accepted on :
Published online on: 12-12-2015
I. S. Beyshova,1 G. D. Chuzhebaeva1, M. Zh Aubakirov1, A. S. Kozhmuhametova1, A. A. Stakheev2 , D. Y. Ryazantsev2, S. K. Zavriev2, A. T Oleynik3
1Kostanay State University named after A. Baitursynov, 110000, Republic of Kazakhstan, Kostanai, st. A. Baytursynova 47 2Institute of Bioorganic Chemistry of M. Shemyakin and Y.Ovchinniokov (Institute of Bioorganic Chemistry), Moscow. 3LLC "Kazakh Scientific and Research Institute of Plant Protection and Quarantine".
ABSTRACT: Traditional methods of complex diagnostics, including the selection of species in pure culture, selection environments and cultivation conditions, obtaining monoporosa isolates and microscopy are long, time-consuming and ineffective. Immune-enzyme analysis method takes a few hours, however, developed on the basis of the methodology of species-specific, predictive and quantification S. tritici and S. nodorum in the leaves and seeds of wheat insensitive do not always provide a clear identification of these species. The introduction of express methods of diagnostics of Septoria leaf blotch on the basis of the polymerase chain reaction (PCR) in modifications of Real-Time lets quickly and accurately diagnose the disease. A system of highly specific sensitive PCR diagnostics of pathogenic fungi Septoria tritici and Stagonospora nodorum, causing diseases of cereals in Northern Kazakhstan is developed. The primers and probes are designed based on partial sequences of the internal transcribed spacer of ribosomal DNA (ITS) provides a quick and accurate identification of pathogens Septoria by quantitative PCR without the risk of contamination of the work area with amplification products. Effectiveness of the test-system was also demonstrated in samples of total DNA isolated from the infected herbarium material.
KEYWORDS: genus Septoria; diagnostics; polymerase chain reaction; primer probe
Download this article as:| Copy the following to cite this article: Beyshova I. S, Chuzhebaeva G. D, Aubakirov M. Zh, Kozhmuhametova A. S, Stakheev A. A, Ryazantsev D. Y, Zavriev S. K, Oleynik A. T. Development of PCR Diagnosis of Pathogenic Fungi of the Genus Septoria, Affecting Cereal Crops in Northern Kazakhstan. Biosci Biotech Res Asia 2015;12(2) |
Introduction
On the territory of the Republic of Kazakhstan, as in many other countries, septoria spot is a particularly dangerous disease of cereal crops. The disease is caused by fungi of the genus Septoria. The disease affects the upper tiers of the leaves of plants and cause significant loss of yield (up to 40-50% with epiphytoties). Climatic conditions in northern Kazakhstan favor the development and dissemination of Septoria, reducing the profitability of grain production. According to the Resolution of the Government of the Republic of Kazakhstan dated December 10, 2002 № 1295 “On approval of lists of quarantine facilities and especially dangerous pests” (as amended and supplemented on 23. 11. 2005), Septoria spot of cereals was included in the “list of especially dangerous pests and diseases of agricultural plants”.
Annual losses due to pests and diseases of crops, according to the Organization for Food and Agriculture (OFA), is approximately 20-25% of potential global harvest of food crops. Therefore, timely diagnosis is essential to protect plants, as well as to increase production and safety of agricultural products [1].
Traditional methods of complex diagnostics, including allocation of species in pure culture, the selection of media and cultivation conditions, obtaining single-spore isolates and microscopy are time-consuming, laborious and insufficiently accurate. ELISA analysis takes a few hours, but it developed on the basis of species-specific techniques, presymptomatic and quantify S. tritici and S. nodorum in the leaves and seeds of wheat are not sensitive enough and do not always provide accurate identification of these species.
An alternative conventional approach is molecular technologies, primarily based on the polymerase chain reaction (PCR) and its modifications. These methods are fast, specific, and their use does not require a great deal of experience and highly qualified personnel. Today there is a number of works on finding genetic markers and PCR diagnosis of fungal pathogens of grass-family, including pathogens Septoria. In particular, in the United States, work on the identification and mapping of microsatellite loci from the database EST Septoria tritici is provided [2]. A team of scientists investigated the specificity and sensitivity of PCR diagnostics Septoria musiva, S. populicola and S. Populi [3]. Also, in China, in cooperation with the United States conducted a study on the development of primers and optimization of parameters of PCR for the diagnosis of pathogenic fungi [4]. However, it should be noted that the volume of genetic data for the pathogens Septoria today is limited. In particular, only a small amount of loci is sequenated and SCAR-markers are proposed on this base [5], providing unambiguous identification of the pathogenic fungus.
Thus, the establishment of a domestic test systems for the diagnosis of pathogens Septoria of grass-family on the basis of new DNA markers is an essential problem of modern Kazakh science and connected with the need of early diagnosis of the disease [6].
Polymerase chain reaction (PCR) comparing with microbiological methods is more sensitive and specific, and its modification in format quantitative PCR (“RT-PCR”) using a hybridization probe having a fluorescent label allows to analyze the results of reaction in the process and without carrying out electrophoresis, and also allows the quantitative analysis.
The introduction of short-time diagnostic methods of Septoria based on quantitative PCR provides quickly and accurately predict progression of the disease, effectively detect pathogens and provide an opportunity to automate the quantitative analysis.
Materials and Methods
- Strains of fungi and samples of grain The study analyzed:
- 14 strains of fungi of the genus Septoria;
- Samples of infected with pathogens Septoria herbarium material.
2. Isolation of DNA
To obtain an abundant culture of fungi mycelium replated in petri dishes with potato-sucrose agar (PCA), and grown in the dark for 7-10 days. Isolation of DNA from fungal cultures and infected wheat seedlings were performed according to the method based on the use of cetyltrimethylammonium bromide (CTAB) as a surfactant, with some modifications [7]. General procedure was as follows:
Mycelium, selected with microbiological loop from the Petri dishes, homogenised in a pre-warmed to 65 ° C lysis buffer (1 M Tris-HCl, pH 7.5; 5 M NaCl; 0.5 M EDTA, pH 8.0; 2% CTAB; 1% mercaptoethanol) (100 mg mycelium ratio: 5 ml of buffer). The homogenate was incubated at 65 ° C for 1.5 hours with intermittent shaking. Then, an equal volume of chloroform, mixed and centrifuged at 5000 rev / min for 10 min. The upper phase was transferred to a clean tube, added thereto, an equal volume of isopropanol, mixed and incubated at -20 ° C for 30 minutes, then centrifuged at 5000 rev / min for 20 min. Remove the supernatant, the precipitate was washed with 70% ethanol and dissolved in 500 .mu.l MilliQ, was added 1 ul RNKzy A (10mg / ml) was incubated at 37 ° C for 30 min. Then added sequentially equal volume (500 ul) of phenol and chloroform, centrifuged at 13,000 rev / min for 5 min., After which the upper phase containing the DNA was transferred to a clean tube, and precipitated with 96% ethanol in the presence of 1/10 volume 3M sodium acetate. Centrifuged, the supernatant was collected, the precipitate was dissolved in 100 l MilliQ.
DNA concentrations were determined by a spectrophotometer NanoVue («GE Healthcare», USA). Before introduction into the reaction mixture of DNA isolated from cultures monosporovyh, diluted to 10 ng / ml.
Selection of specific primers and fluorescently labeled probes.
Search gene sequences for the selection of universal primers produced in GenBank NCBI (http://www.ncbi.nlm.nih.gov/GenBank). Alignment of the nucleotide sequences was performed using the algorithm Clustal W (Thompson et al., 1994) [8]. Performance Evaluation of primers and probes was performed using the program Oligo 6.71.
PCR and analysis of results
Amplification was carried out in the detection thermocycler DT-96 (“DNA Technology”, Russia). Composition of the reaction mixture comprised 18 .mu.l 1,25h PCR buffer, 0.24 l 25 mM dNTPs, 0,125 l of each primer (100 M) 0.14 l hydrolyzable probe (TaqMan, [9]) labeled with a fluorophore FAM (50 M) (for quantitative PCR), 5 l solution Taq-polymerase, 3 l of DNA solution (all reagents production of LLC “Agrodiagnostika”). As the reaction proceeds for each sample the connection between fluorescence level and the number of cycles was determined, and using the supplied software to thermocycler corresponding graph was built. To determine the values of Cq threshold analysis method was used [10].
For all primers a universal amplify program was used, including the following steps: 94 ° C – 1 min (1 cycle); 94 ° C – 10 seconds, 64 ° C – 20 seconds, 67 ° C – 20 seconds (50 cycles).
When testing specific primers in the reaction mixture an internal control was added (IC). As IC plasmid construct was used to insert size of 560 bp, flanked by inverted sequences homologous to one of the primers used for amplification of IC. Probe to the IC also represented TaqMan, however, it has been labeled with another fluorophore (HEX).
When cloning positive controls detection of the amplification products was performed by the method of gel electrophoresis. Electrophoresis was performed at a current of 400 mA in 2.5% agarose gel in buffer TAE (40 mM trishydroxymethylaminomethane, 20 mM glacial acetic acid, 1 mM EDTA) supplemented with 0.5 ug / ml ethidium bromide. To estimate the molecular weight of the fragments using DNA molecular weight markers of 100 bp GeneRuler 1 kb GeneRuler. The results are visualized by electrophoresis on a transilluminator ECX-15-M (Viber-Lourmat, France).
To isolate plasmid DNA a set of reagents «GeneJet plasmid Miniprep Kit» («Fermentas», Lithuania) was used on the manufacturer’s protocol.
Plasmids containing the insert as the amplification product with universal primers were given for sequenation to JSC “Eurogen”. Plasmids containing the amplification product with specific primers were used as required positive controls with each of the developed test systems.
Results and Discussion
The selectionand optimization ofspecific primersto identifySeptoria triticiandStagonospora nodorum
Today loci which are commonly used in phylogenetics, molecular taxonomy and specific identification of pathogenic fungi, are beta-tubulin genes, translation elongation factor 1 alpha and internal transcribed spacers of ribosomal DNA (ITS) [11, 12]. Unfortunately, those sequences that were previously in the NCBI database, and that we have used for the selection of primers to the gene translation elongation factor 1 alpha, no longer belongs to the species Septoria tritici and Stagonospora nodorum. Therefore, the alignment of these areas, as well as the results are not shown.
Thus, partial sequence of the gene beta-tubulin and the internal transcribed spacer of ribosomal DNA were selected. Fig. 1 shows alignment of partial sequences of the internal transcribed spacer used for the selection of primers for the detection of S. tritici and S. nodorum.
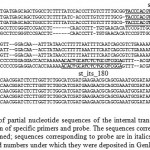 |
Figure 1: Alignment of partial nucleotide sequences of the internal transcribed spacer of ribosomal DNA used for the selection of specific primers and probe. The sequences corresponding to the primers are shown in bold and underlined; sequences corresponding to probe are in italics. SN – S. nodorum; ST – S. tritici. For each strain listed numbers under which they were deposited in GenBank NCBI. |
 |
Figure 1: (continuation) |
A complete list of oligonucleotides selected for the research given in Table. 1.=
Table1: List of oligonucleotides selected to identify S. tritici and S. nodorum. The structures of the primers and probes selected for the development of test systems are highlighted in bold.
|
Genus |
Locus |
Oligonucleotide | |
| Name | Sequence 5′-3′ | ||
| S. tritici | ITS1-ITS2 | st_its180 | ACACTGCATCTCTGCGTCGGA |
| st_its550 | CGAGGTCAACCTGAGGTGTGATTT | ||
| stn_its330 | FAM-TCGAATCTTTGAACGCACATTGCGC-BHQ1 | ||
| B.-tubulin | st_tub1120 | TCCCCGGTCAGCTCAACAGC | |
| st_tub1430 | ATCCACTCGACGAAGTATGCGGT | ||
| stn_tub1190 | FAM-GTCTCCACTTCTTCATGGTCGGTTTCGC-BHQ1 | ||
|
S. nodorum |
ITS1-ITS2 | sn_its130 | TACCCACGTTTCCTCGGCAG |
| sn_its550 | CTGATCCGAGGTCAAAAGTTAGAAA | ||
| stn_its330 | FAM-TCGAATCTTTGAACGCACATTGCGC-BHQ1 | ||
| B.-tubulin | sn_tub1120 | TTCCCCGGTCAGCTCAACTCT | |
| sn_tub1430 | GATCCACTCAACGAAGTAGGACGA | ||
| stn_tub1190 | FAM-GTCTCCACTTCTTCATGGTCGGTTTCGC-BHQ1 | ||
To assess the specificity of the primers, their performance characteristics, and to select the optimum to create a pair of test systems was carried out their empirical testing using DNA samples isolated from cultures of fungal mycelium single-spore species studied. To assess the possible inhibition of the reaction and for detection of false negative results, into the reaction mixture IC was added (cm. “Materials and Methods”).
In all cases the value of the fluorescence IC probe exceeded 2.5 times its level of background fluorescence, indicating the absence of PCR inhibition. In embodiments where the observed formation of specific PCR product was less than the signal VC is several times as compared with embodiments in which the formation of a specific product does not occur.
DNA results of single-spore cultures S. tritici and S. nodorum by quantitative PCR using primers for the beta-tubulin gene and ITS are shown in Table. 2.
Table 2: The results of quantitative PCR with primers specific for allegedly S. tritici and S. nodorum, matched to a partial nucleotide sequences and ITS gene beta-tubulin. HEX – internal control. “-” – Negative control.
| Sample | Cq (ITS) | Cq (BTub) | Cq (HEX) |
| 1 (S. nodorum) | – | – | + (33.1) |
| 2 (S. nodorum) | – | – | + (33.5) |
| 3 (S. nodorum) | – | – | + (31.2) |
| 4 (S. nodorum) | – | – | + (31.7) |
| 5 (S. nodorum) | – | – | + (32.2) |
| 6 (S. nodorum) | – | – | + (30.4) |
| 7 (S. nodorum) | + (17.6) | + (26.1) | – |
| 8 (S. nodorum) | + (25.5) | – | + (32.2) |
| 9 (S. nodorum) | + (21.8) | + (29.4) | – |
| 10 (S. nodorum) | + (19.2) | + (25.5) | – |
| 11 (S. nodorum) | + (23.6) | + (31.6) | – |
| 12 (S. nodorum) | + (18.7) | + (26.1) | – |
| 13 (S. nodorum) | + (21.1) | + (27.7) | + (32.1) |
| 14 (S. nodorum) | + (34.9) | – | + (33.5) |
| – | – | – | + (33.7) |
| 1 (S. tritici) | + (25.1) | – | + (32.4) |
| 2 (S. tritici) | + (27.0) | + (31.1) | – |
| 3 (S. tritici) | + (23.8) | + (28.4) | – |
| 4 (S. tritici) | + (30.5) | – | + (32.3) |
| 5 (S. tritici) | – | – | + (31.9) |
| 6 (S. tritici) | + (26.5) | + (29.8) | + (30.6) |
| 7 (S. tritici) | – | – | + (30.5) |
| 8 (S. tritici) | – | – | + (31.7) |
| 9 (S. tritici) | – | – | + (32.3) |
| 10 (S. tritici) | – | – | + (34.1) |
| 11 (S. tritici) | – | – | + (31.6) |
| 12 (S. tritici) | – | – | + (32.1) |
| 13 (S. tritici) | – | – | + (32.0) |
| 14 (S. tritici) | – | – | + (32.0) |
| – | – | – | + (31.9) |
No signal of the internal control in some samples apparently may be due to competitive inhibition by the specific sample. Thus, none of the primer pairs showed no cross-reaction with other species, indicating their specificity.
The primers selected for gene beta-tubulin showed higher values of threshold cycles, i. e., they are less sensitive than the primers matched with ITS nucleotide sequences. In addition, the primers of the gene beta-tubulin was detected in general fewer samples than the primers selected to ITS sequences. Thus, for further work primer pairs st_its_180-550 sn_its_130-550 were selected as well as probe stn_its330.
Analysis of theinfectedherbarium material
2 samples of material from herbarium of the collections of KSU named after A. Baitursynov were analyzed using the primer pairs selected at the previous stage of the research. The results are shown in Table. 3.
Table 3: Results of the analysis of total DNA isolated from herbarium material by quantitative PCR with primer pairs st_its_180-550 and sn_its_130-550, and probe stn_its330. IC – internal control. “+ Pole” – a positive control, “-” – negative control.
|
Sample |
Cq (S. tritici) | Cq (S. nodorum) |
Cq (ВК) |
| Herbarium №1 | + (33.3) | + (19.7) | + (31.8) |
| Herbarium №2 | – | + (22.1) | + (30.6) |
| + ccont. (S. tritici) | + (22.5) | – | + (32.2) |
| + cont. (S. nodorum) | – | + (17.7) | + (31.0) |
| – | – | – | + (30.6) |
Thus, in both herbarium specimens in large quantities S. nodorum was detected, while S. tritici was identified in only one sample (herbarium №1). These data suggest a high degree of infestation of the sample №1, especially species of S. nodorum. This result does not contradict the fact that the study of DNA isolated from the mycelia which showed negative in all the samples, as studied cultures were screened out with the other samples.
Positive controls development; determination of the sensitivityof the reaction.
The PCR products from each primer pair was cloned into a plasmid vector and the resulting structure was used as a standard positive control. Also the sensitivity of test systems for each pair of primers was determined. For this quantitative PCR was carried out successive tenfold dilutions of genomic DNA S. tritici and S. nodorum, taken in the range from 101 to 106 pg of DNA pathogen per reaction. The limit of sensitivity of each of the test systems was 10 pg of DNA of the pathogen for a reaction, which is relatively high. Standard graphs of the relation of Cq values and the number of copies of a specific DNA per reaction are shown in Fig. 2.
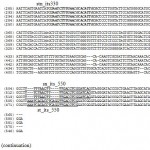 |
Figure 2: Standard graphs of relation of Cq and the concentration of DNA in the sample (logC). A – for the primer pair st_its_180-550; B – for the primer pair sn_its_130-550. |
Conclusion
Thus, we developed the system which allows to identify pathogens Septoria of grass-family Septoria tritici and Stagonospora nodorum which are widespread in northern Kazakhstan in a simple, fast and reliable way. Also, it is essential that the system is highly sensitive, and its use eliminates the risk of contamination of the working and analytical space with amplification products. It can serve as a basis for creating standard test kits – for routine diagnosis of pathogens Septoria and in scientific research. Early detection of pathogens Septoria allows to protect grass-family effectively and discard deeply infected material. This package of measures will provide an opportunity to significantly improve the efficiency and profitability of agricultural production, and in turn, reduce losses.
References
- Polyakov I. M., Shumakov E. M Plant protection // Soviet encyclopedia. – P. 1969-1978.
- Stephen B. Goodwin, Theo A.J. van der Lee, Jessica R. Cavaletto, Bas te Lintel Hekkert, Charles F. Crane, Gert H.J. Kema Identification and genetic mapping of highly polymorphic microsatellite loci from an EST database of the septoria tritici blotch pathogen Mycosphaerella graminicola // Fungal Genetics and Biology. – May 2007. – Volume 44, Issue 5. – P. 398-414.
- Nicolas Feau, Jerry E. Weiland, Glen R. Stanosz, Louis Bernier Specific and sensitive PCR-based detection of Septoria musiva, S. populicola and S. populi the causes of leaf spot and stem canker on poplars // Mycological Research. – September 2005. – Volume 109, Issue 9. – P. 1015-1028.
- Zhonghua Ma, Themis J. Michailides Approaches for eliminating PCR inhibitors and designing PCR primers for the detection of phytopathogenic fungi // Crop Protection. – February 2007. – Volume 26, Issue 2. – P. 145-161.
- Paran I., Michelmore R.W. Development of reliable PCR-based markers linked to downy mildew resistance genes in lettuce // Theoretical and Applied Genetics. – 1993. – № 85. – P. 985-993.
- Fraaije B. A., Hollomon, D. W. Novel DNA diagnostic technology in plant disease control using Septoria tritici as a model. // IACR-Long Ashton Research Station, Bristol. – 1997. – In: Project report № 245. – P. 27.
- Murray, M.G., Thompson, W.F. Rapid isolation of high molecular weight plant DNA // Nucl. Acids Res. – 1980. – № 8. – P. 4321-4325.
- Thompson, J.D., Higgins, D.G., Gibson, T.J. CLUSTAL W: improving the sensitivity of progressive multiple sequence alignment through sequence weighting, position-specific gap penalties and weight matrix choice // Nucleic Acids Research. – 1994. – № 22. – P. 4673-4680.
- Holland P.M., Abramson R.D., Watson R., Gelfand D.H. Detection of specific polymerase chain reaction product by utilizing the 5’→3′ exonuclease activity of Thermus aquaticus DNA polymerase. // Proceedings of the National Academy of Sciences. – 1991. – № 16. – P. 7276-7280.
- RebrikovD. V., SamatovG. A.,TrofimovD. Yu., P.Semenov, SavilovaA. M. ,KofiadiI. A. ,J. J. AbramsPCR”real time” //Binom.Laboratoryknowledge. – 2009. – P. 123.
- AbramovS. L.,RyazantsevD. Y.,VoinovaT. M., ZavrievS. K. Diagnosisof pathogenic fungiSeptoria triticiandStagonospora nodorum through FLASH-PCR method // BioorganicChemistry. – 2008. – № 34. – P. 97-102.
- Ryazantsev D. Y., Abramova S. L., Evstratova S. V., Gagkaeva T. Y., Zavriev S. K. Diagnosis of toxigenic fungi of the genus Fusarium though FLASH-PCR method // Bioorganic Chemistry. – 2008. – № 34. – P. 716-724.

This work is licensed under a Creative Commons Attribution 4.0 International License.


