

Manuscript accepted on :
Published online on: --
Categorising the Quality and Estimating the Quantity of the Milk by Embedded System using Zigbee
Syed Rahim, S. Santhosh Varma, Kavi Priya
ECE/Sathyabama university Chennai, INDIA
ABSTRACT: This project deals with categorising the quality and estimating the quantity of the milk using Ph sensor and Level sensor and to transfer the entire data to the dairy farm PC using Zigbee communication. Milk is very important due to its special nutritive value and important role for human and animal health. The paper aimed to present some aspects regarding milk quality and quantity estimation The existing milk analysers categorises the milk based on the quantity level only .So High quality milk does not contain its value, because treated as quantity based. So in this proposed system each customer should have their own card for accessing the milk diaries. High quality milk should have good density, so density of the milk is measured by using an intensity sensor and also level of the milk will be measured by using a level sensor. The amount is credited based upon the quantity (level) and quality (intensity) of the milk, which is sent through the Zigbee. High quality milk will be stored in one tin can and others will be stored in another tin can. Cost can also be estimated easily by this technology.
KEYWORDS: Dairy panel;Sensors;Corrected lactometer reading;Electronic milko testers;Radiofrequency identification
Download this article as:| Copy the following to cite this article: Rahim S, Verma S. S, Priya K. Categorising the Quality and Estimating the Quantity of the Milk by Embedded System using Zigbee. Biosci Biotech Res Asia 2015;12(2) |
Introduction
Dairy farms in India are generally co-operative.The primary source of milk to dairy was by farmers. They will give the original raw milk to the dairies. Since more number of farmers are depositing their milk in the dairy, it is a daily task of the dairy to assess the quality of milk from each farmer.Several tests are available to estimate the quality of the milk like content of protein,lactose,water etc.. Most dairies use only the fat content test and CLR (Corrected Lactometer Reading) to judge milk quality.But here by using the intensity sensor the quality of the milk was determined and can be categorise the milk based on its quality. We can fix the price to milk based on its quality.Quantity of the milk can be measured by the level sensor.The milk with gooh Ph value can be treated as high quality milk and remaining as poor quality milk. By using a solenoid valve the poor quality milk will be transferred to other containers.Each dairy farmer is provided with an RFID card with his details.When he came to check the quality of his milk,he has to swipe the RFID tag and need to pour the milk in container to check.The details of the farmer and his milk quality will be send to Dairy Farm PC using Zigbee type of communication.Use of RFID tags and Zigbee Communication was the additional feature of this project.
As dairy industry is a joint business of farmer, so farmers took more interest in it & because of this in India more number of Cooperative dairies are formed. Time required for processing this milk is more as after procuring the milk from farmers at village cooperative societies it is then tested for the quality by measuring the FAT content, density of milk & quantity of milk. As this process is time consuming hence farmers has to stay in a line for an hour or more. Secondly, some milk collection centers do not have the costly milk analyzing equipment.
Dairy information service kiosk offers extensive knowledge and service delivary mechanism through a daily portal.The disk when used with the dairy portal in union,enhances the scope of the services that would benfit the farmers and as well as the dairy farm industry.
In general, embedded systems are
- system built to perform its duty,completely or partially independent of human intervention.
- specially designed to perform few tasks in most efficient way
- Controlling and driving the motor,sensing the temperature etc.,
Real time embedded systems are classified in to hard real time and soft real time embedded systems and also in to hybrid real time embedded system.
Existing System
Current milk quality standards in India include the followings:
- Amount credited based on the quantity level
- Man power should be involved in milk dairy so possibility of robbery
- High quality milk does not contain its value, because treated as quantity based.
A number of researchers have contributed their research works in estimating the milk analysis using embedded systems.Here we can discuss some of the important techniques we had in the previous milk analysers.
Literature Survey
1) Development of Milk Analysis Reliable Embedded System for Dairy Farmers. (Yadav and MR.Kulakarni)
This paper clearly gives the information regarding milk analyzing. It explains clearly, the working principle used in the Milkometer reading which is used to measure the quality and quantity of the milk.The working principle is amount of light scattered by the milk sample is a measure of the fat content in the milk. High intensity LED is used as a light source. Correct lactometer reading also explained in this paper.By this correct lactometer reading, the specific gravity of the milk and the temperature deviation of the milk is measured .We also came across system designing . This paper is good example of the fusion of biochemical and electronics engineering. The milk collection parameters such as weight, FAT & CLR are measured by this system is also explained.
2) Low cost milk analysing and billing system using election card.(Prof.S.V. Arote, Prof. S.B. Lavhate)
In this paper it is clearly explained that the basic components needed for the milk analysis done by low cost and billing system has done by using election card.We came across block diagram of milk collection centre in this paper,it consists of sensor block and a microcontroller ,an LCD, a signal conditioner ,a keyboard etc., Now a days, the date is stored in smart cards . User can go any time to collect his payment.By using this election card the billing system was explained in this paper.
3) Milk protein analysis.( B. Ribadeau-Dumas and R. Grappin )
In this paper, the various methods of current or potential use for detecting and determining them in dairy products are reviewed. Methods: under direct methods, they have used Kjeldahl method in which the protein content can be measured.
Under indirect methods, they have used dye-binding method and infra-red method for protein content testing.
This review concerns ail types of analysis dealing with proteins in milk, dairy and a few non-dairy products. Only the methods that are in current use, or those which have been recently published and might become of general use, will be considered. For all of them, the reader will be supplied with basic principles, schematic descriptions, references and critical evaluations
4) Compositon and Adulteration Analysis of Milk Samples.( Mohammad Ayub*, Quasid Ahmad)
In this paper we came across different materials and methods for the milk anlaysis.
The different materials tested in the milk are Fat, Protein, Water and Ash Methods used:
(a)Gerber method in which fat can be determined.
(b) kjeldahl method in which protein can be determined.
(c) AOAC methodin which water and ash can be determined.
Hydrogen peroxide detection and carbonate and bicarbonate detection was done in this particular analysis. Starchy material detection was also done. Finally it concludes the results of percentage of proteins,water ,fat and ash available in the milk sample. The collected milk samples were analyzed for various adulterants i.e. carbonate, flour and hydrogen peroxide. All the five samples evaluated at regular intervals showed no sign of the adulterants.
Proposed System
- In this proposed module, each customer should have their own card for accessing the milk diaries. High quality milk should have good density, so density of the milk is measured by using an intensity sensor and also level of the milk will be measured by using a level sensor.
- The amount is credited based upon the quantity (level) and quality (intensity) of the milk, which is sent through the Zigbee.
- High quality milk will be stored in one tin can and others will be stored in another tin can.
BLOCK DIAGRAM
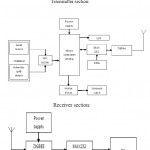 |
Block diagram Transmitter sectionClick here to View figure |
a) MICRO CONTROLLER(AT89S52):
- 4.0V to 5.5V Operating Range
- Fully Static Operation: 0 Hz to 33 MHz
- Three-level Program Memory Lock
- 256 x 8-bit Internal RAM
- 32 Programmable I/O Lines
- Three 16-bit Timer/Counters
- Eight Interrupt Sources
- Full Duplex UART Serial Channel
- Low-power Idle and Power-down Modes
- Interrupt Recovery from Power-down Mode
- Watchdog Timer
- Dual Data Pointer
- Power-off Flag
b) PH SENSOR:
- A pH meter is an electronic device used for measuring the pH (acidity or alkalinity) of a liquid (though special probes are sometimes used to measure the pH of semi-solid substances). A typical pH meter consists of a special measuring probe (a glass electrode) connected to an electronic meter that measures and displays the pH reading.
- The probe is an essential part of a pH meter, it is a rod like structure usually made up of glass. At the bottom of the probe there is a bulb, the bulb is a sensitive part of a probe that contains the sensor.
Never touch the bulb by hand and clean it with the help of an absorbent tissue paper with very soft hands, being careful not to rub the tissue against the glass bulb in order to avoid creating static..
c) MAX 232:
- The MAX232 IC is used to convert the TTL/CMOS logic levels to RS232 logic levels during serial communication of microcontrollers with PC. The controller operates at TTL logic level (0-5V) whereas the serial communication in PC works on RS232 standards (-25 V to + 25V).
- The intermediate link is provided through MAX232. It is a dual driver/receiver that includes a capacitive voltage generator to supply RS232 voltage levels from a single 5V supply. Each receiver converts RS232 inputs to 5V TTL/CMOS levels. These receivers (R1 & R2) can accept ±30V inputs.
- The transmitters take input from controller’s serial transmission pin and send the output to RS232’s receiver. The receivers, on the other hand, take input from transmission pin of RS232 serial port and give serial output to microcontroller’s receiver pin.
d) ZIGBEE MODULE:
- ZigBee is a wireless high level communication protocal using small, low-power digital radios based on an IEEE 802 standard for personal area networks.
- ZigBee devices are often used in mesh network form to transmit data over longer distances, passing data through intermediate devices to reach more distant ones
- ZigBee’s key features are as follows:
(a) Reliable and self configuration
(b) Supports large number of nodes
(c) Very long battery life
(d) Secure
(e) low cost
(f) Can be used globally
e) LEVEL SENSOR:
- An infrared sensor is an electronic instrument that is used to sense certain characteristics of its surroundings by either emitting and/or detecting infrared radiation.
- It is also capable of measuring heat of an object and detecting motion. Infrared waves are not visible to the human eye.
- In the electromagnetic spectrum, infrared radiation is the region having wavelengths longer than visible light wavelengths, but shorter than microwaves.
- The infrared region is approximately demarcated from 0.75 to 1000µm. The wavelength region from 0.75 to 3µm is termed as near infrared, the region from 3 to 6µm is termed mid-infrared, and the region higher than 6µm is termed as far infrared.
- Infrared technology is found in many of our everyday products. For example TV etc.,
f) LCD:
- LCD (Liquid Crystal Display) screen is an electronic display module and find a wide range of applications. A 16×2 LCD display is very basic module and is very commonly used in various devices and circuits.
- These modules are preferred over seven segments and other multi segment LEDs.
- The reasons being: LCDs are economical; easily programmable; have no limitation of displaying special & even custom characters (unlike in seven segments), animations and so on.
- A 16×2 LCD means it can display 16 characters per line and there are 2 such lines. In this LCD each character is displayed in 5×7 pixel matrix. This LCD has two registers, namely, Command and Data.
g) Analog to digital convertor:
The ADC804 is an analog to digital converter whic is used to convert analog signals to digital so that any microcontroller can sense the signal and works accordingly. Resolution of this IC is 8 bits and works with +5V. If input voltage 5V then converted digital output is FF.
Pin description of ADC804 :
CS : Chip Select:
It is an active low input used to activate the ADC804 IC. To activate ADC804, this pin must be low.
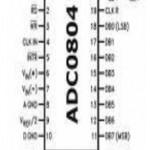 |
Analog to digital convertor |
RD: Read:
It is an active low input used to get the converted data out of the ADC chip. The ADC converts the analog input to its binary equivalent and holds in an internal register. When a CS = 0 and high- to-low pulse is applied to the RD pin, then 8-bit digital output is available at the D0-D7 data pins.
WR: Write:
This is an active low input used to inform the ADC to start the conversion process. ADC starts converting analog input to digital, when CS = 0 and a low-to-high pulse is applied to WR pin. The amount it takes to convert varies depending on the CLK IN and CLK R values. When the data conversion is complete, the INTR pin is forced low by the ADC804.
INTR — end of conversion, goes low to indicate conversion done
Data bits — D0-D7
CLK IN & CLK R
h) RS232:
Rs232 is a standard communicaton protocol for linking the computer and its peripheral devices to allow serial data exchange.In simple terms RS232 defines the voltage for the path used for data exchange between the devices.It specifies common voltage signal level,common pin wire configuration and minimum,amount of control signals.As mentioned above this standard was designed with specifications for electromechanically teletypewriter and modern system and did not define elements such as character encoding,framing of characters,error detection etc., that are essential features when data transfer takes place between a computer and a printer.Without which it could not be adoptedto transfer data between the computer and a printer.To overcome this problem a single integrated circuit called a UART known as universal asynchronus reciver/transmitter is used in conjunction with RS232
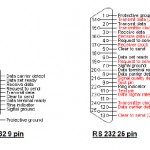 |
Rs232 is a standard communicaton protocol for linking the computer and its peripheral devices |
| DB9 | DB25 | Acronym | Full name | Direction | |
| Pin 3 | Pin 2 | TXD | Transmit Data | out | |
| Pin 2 | Pin 3 | RXD | Receive Data | in | |
| Pin 7 | Pin 4 | RTS | Ready to send | out | |
| Pin 8 | Pin 5 | CTS | Clear to send | in | |
| Pin 6 | Pin 6 | DSR | Data set Ready | In | |
| Pin 4 | Pin 20 | DTR | Data terminal Ready | out | |
| Pin 1 | Pin 8 | DCD | Data Carrier Detect | in | |
| Pin 9 | Pin 22 | RI | Ring Indicator | in | |
| Pin 5 | Pin 7 | SG | Signal Ground | – | |
i) ZIGBEE:
- ZigBee is a specification for a suite of high level communication protocols using small, low-power digital radios based on an IEEE 802 standard for personal area networks. ZigBee devices are often used in mesh network form to transmit data over longer distances, passing data through intermediate devices to reach more distant ones. This allows ZigBee networks to be formed ad-hoc, with no centralized control or high-power transmitter/receiver able to reach all of the devices. Any ZigBee device can be tasked with
- ZigBee is targeted at applications that require a low data rate, long battery life, and secure networking. ZigBee has a defined rate of 250 kbit/s, best suited for periodic or intermittent data or a single signal transmission from a sensor or input device. Applications include wireless light switches, electrical meters with in-home-displays, traffic management systems, and other consumer and industrial equipment that requires short-range wireless transfer of data at relatively low rates. The technology defined by the ZigBee specification is intended to be simpler and less expensive than other WPANs, such as Bluetooth or Wi-Fi
- ZigBee builds upon the physical layer and medium access control defined in IEEE standard 802.15.4 (2003 version) for low-rate WPANs. The specification goes on to complete the standard by adding four main components: network layer, application layer, ZigBee device objects (ZDOs) and manufacturer-defined application objects which allow for customization and favor total integration.
- Besides adding two high-level network layers to the underlying structure, the most significant improvement is the introduction of ZDOs. These are responsible for a number of tasks, which include keeping of device roles, management of requests to join a network, device discovery and security.
- ZigBee is not intended to support powerline networking but to interface with it at least for smart metering and smart appliance purposes.
- Because ZigBee nodes can go from sleep to active mode in 30 ms or less, the latency can be low and devices can be responsive, particularly compared to Bluetooth wake-up delays, which are typically around three seconds.[3] Because ZigBee nodes can sleep most of the time, average power consumption can be low, resulting in long battery life.
ZIGBEE PROTOCAL STACK:
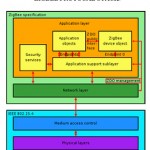 |
ZIGBEE PROTOCAL STACK |
j) FLASH PROGRAMMER:
- An Universal programmer TOP2005 is a universal mode programmer designed for developing MCU/MPU and writing all kinds of memories, EPROM, eeprom with the characteristics of small size, low power consumption and high reliability.
- An USB interface, no need external power supply TOP2005 adopts USB universal serial port to connect PC, which offers high rate of transmission, high interference free performance and high unfailing performance without external power source, so it is fit for outing use of battery-powered notebook PC.
- TOP2005 is a latest product TOP2005 is a TOP2004 update version, which is smaller in size and more stable for programming
FEATURES:
- Supporting 2.5 to 6.5V devices;
- Adopting USB interface power source instead of external power source
- Connecting PC through USB universal serial port at a transfer rate of 12MHz/s
- Supporting battery-powered laptop as well as desktop
- Perfect over-current protection to programmer and device against damage
- USB loading capacity testing (0 to 10 grades)
- All-pin inspection is able to find the contacting status of every pin
- 40 pin imported universal locking socket
- Operating under WINDOWS98SE/ME/2000/XP
- Plastic shell, small size, light weight and low power consumption
- Supporting automatic-detection of manufacturer and mode
- MCU/MPU timing, programming speed is independent of computer
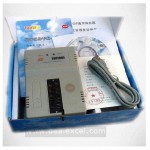 |
FLASH PROGRAMMER |
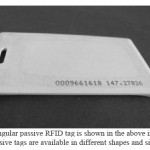 |
A rectangular passive RFID tag is shown in the image |
k) RFID TAG:
- RFID tag is a small device which stores and sends data to RFID reader. They are categorized in two types –active tag and passive tag. Active tags are those which contain an internal battery and do not require power from the reader.
- Typically active tags have a longer distance range than passive tags. Passive tags are smaller and lighter in size than the active tags.
- They do not contain an internal battery and thus depend on RFID reader for operating power and certainly have a low range limited up to few meters
- A rectangular passive RFID tag is shown in the above image.
The passive tags are available in different shapes and sizes
SOFTWARE REQUIREMENTS
a) KEIL MICRO VISION:
- Keil Micro Vision is an integrated development environment used to create software to be run on embedded systems (like a microcontroller). It allows for such software to be written either in assembly or C programming languages and for that software to be simulation a computer before being loaded onto the microcontroller.
- keil μVision3 is an IDE (Integrated Development Environment) that helps write, compile and debug embedded programs. It encapsulates the following components:
- A project manage
- A make facility.
- Tool configuration.
- Editor
- A powerful debugge
b) EMBEDDED C PROGRAMMING:
- Embedded C programming was the only way to program the microcontroller we used in this project i.e ATMEL 89S52.
- Two salient features of embedded programming are code speed and code size.
- Code speed is governed by processing power ,timing constraints, where code size is governed by available program memory and use of programming language.
- Main goal of embedded c programming is to get maximum features in minimum space and minimum time
PROCEDURE OF PROPOSED WORK:
Step:1
First of all we need to switch on the power supply of transmitter side of the kit and then we need to switch on receiver part of zigbee.
Step:2
Pour the milk in the container which is fixed with the ph sensor and level sensor.
Step:3
Install the hyperterminal software in the PC where we can view the final result. Set the baudrate of 9600 in hyperterminal.
Step:4
Keep the RFID tag near Rfid reader. Details of the tag were programmed to the microcontroller, So in LCD we can see the details of the dairy farmer and using zigbee those details were transferred to PC.
Step:5
PH and level sensors will detect the quality and quantity of the milk and details were transferred to PC using Zigbee type of communication. Price can also be estimated at last by programming the microcontroller.
Step:6
If the PH value exceeds the good quality range then those milk can be treated as unwanted milk.
CIRCUIT MODULE:
 |
CIRCUIT MODULE |
RESULT:
Farmers were the main benificiaries of this project. Main benefits of this project when compared to previous existing milk analysers are :
- Accurate Ph value and level of milk can be determined
- Cost of the milk can also be calculated easily.
- Unwanted milk will be poured out immediately from the container if it is not containing good Ph value.
- The entire data base of farmers details can be stored in Pc. Each farmer is provided with a unique ID number. The daily transduction for each farmer is to be stored on PC. The database can be in the following table:
| Name | PH Value | quantity | Cost |
| XXX | 006 | 200ml | 20Rs |
Conclusion:
This paper is a good example for fusion of biochemical and electronics engineering. Milk parameters such as PH value and quantity of the milk were determined more easily than the previous existing milk analysers. Use of RFID will be much easier and Zigbee for data transmission to PC will be more convenient than other type of communications. It will be easy for dairy farm management also to detect the milk parameters and to maintain the entire database of the farmers.
References:
- Yadhav S.N, Kulkarni S.A, Development of Milk Analysis Reliable Embedded System for Dairy Farmers, International Jouranl of Emerging Technology and Advanced Enginering, ISSN 2250-2459, PP: 497-500, Volume 2, Issue 7, July 2012
- B.Ribadeau-dumas and R.Grappin ,Milk protein analysis, https://hal.archives-ouvertes.fr/hal-00929173/document 1989, 69 (5), pp.357-416.
- Prof.S.V.Arote,Prof.S.B. Lavhate ,Low cost milk analysisng and billing system using election card , IEEE Jul 2011, Page(s): 967 – 989
- Funke gerber ,Laboratory catalogue for milk analysis, Vol. 23, No. 4, 2007 http://funke-gerber.de/FG_Kat_ENG.pdf
- M.kproof-,Quality control of raw cow’s milk by head spaceanalysis, https://www.wageningenur.nl/upload_mm/4834da38ed254_H eadspace%20analysis%20%26%20mastitis%20diagnosis.pdf
- Dairy Milk Analyser:http://www.bruker.com/Dairy?gclid=Cj0KEQiA6ounBRCq0LKBjK GgysEBEiQAZmpvA4MyI_RRGnXKF9DNgCoUxPryc61NElpqbTz Kork-fjIaAtLP8P8HAQ
- Md.Ajmal shah ,Microbial analysis and quality control of Milk,International journal of pharmaceutical research and bio-science Issn:2277-8713 volume2(4) PP:243-252 ( 2013)
- Md.Ayub, Quasid ahamad-Compostion and adulteration analysis of milk samples Vol. 23, No. 4, 2007 http://www.aup.edu.pk/sj_pdf/COMPOSITION%20AND%20ADULTERATION%20ANALYSIS%20OF%20MILK%20SAMPLES.pdf
- Prof.Dr.Martin Grunow –“Embedding food quality modeling for milk supply chains” https://upcommons.upc.edu/pfc/bitstream/2099.1/14423/1/texto.pdf

This work is licensed under a Creative Commons Attribution 4.0 International License.


